


LifeSpring Assisted Living
Memory Care & Assisted Living · Catonsville, MD


LifeSpring Assisted Living
Memory Care & Assisted Living · Catonsville, MD
LifeSpring Assisted Living accepts Medicaid.
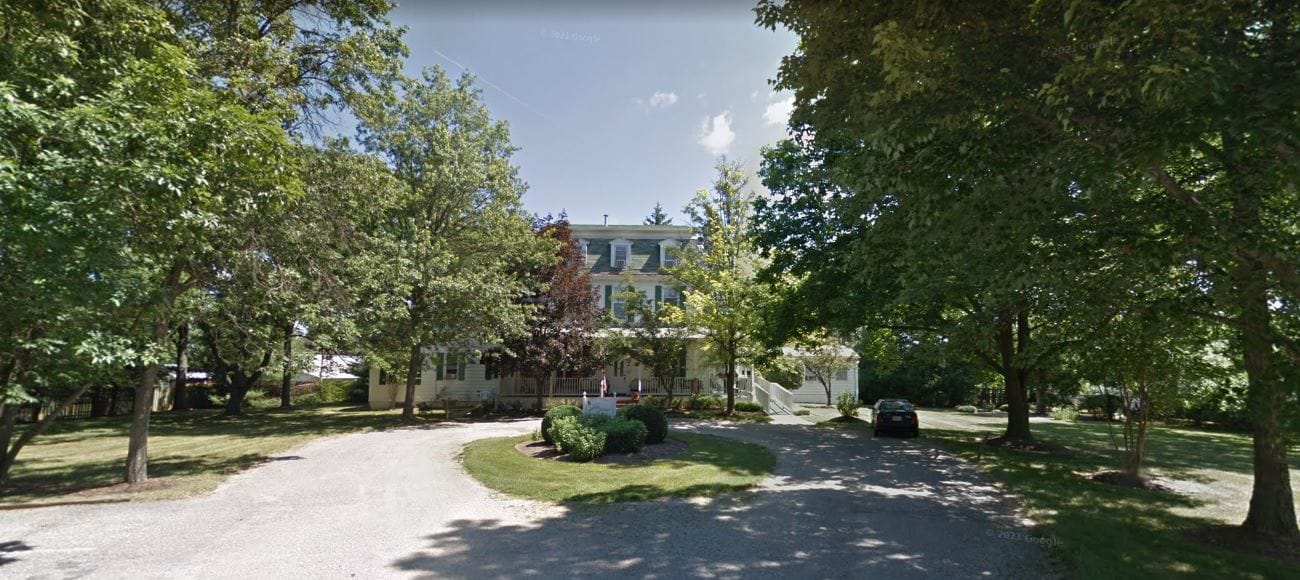
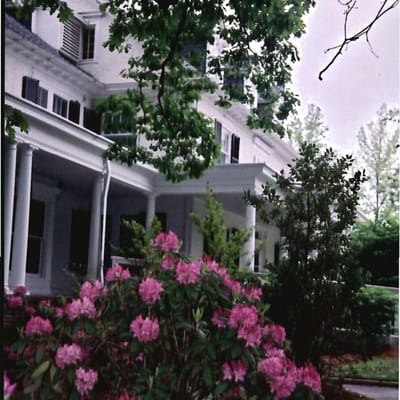
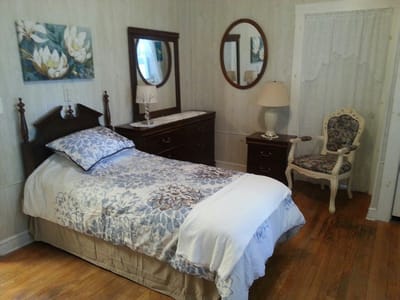
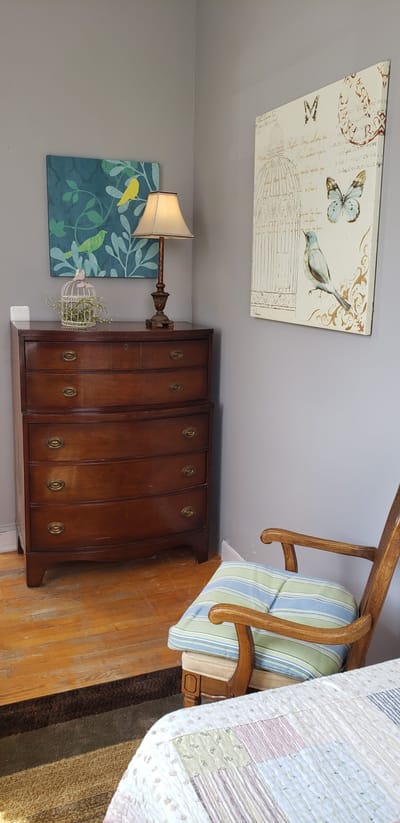
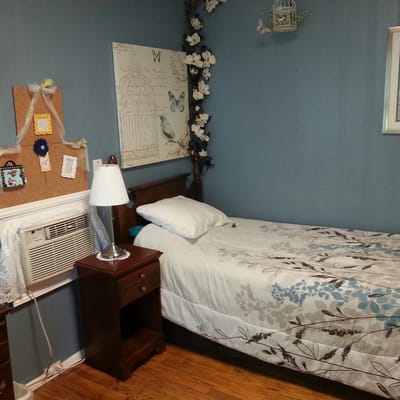
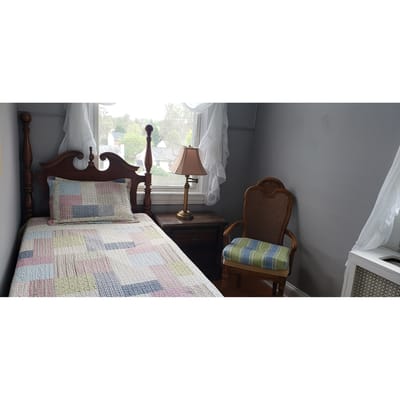
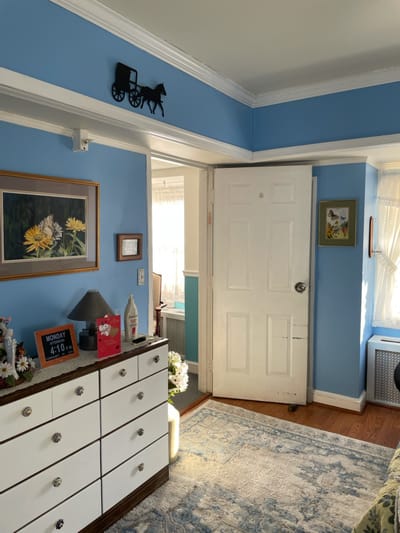
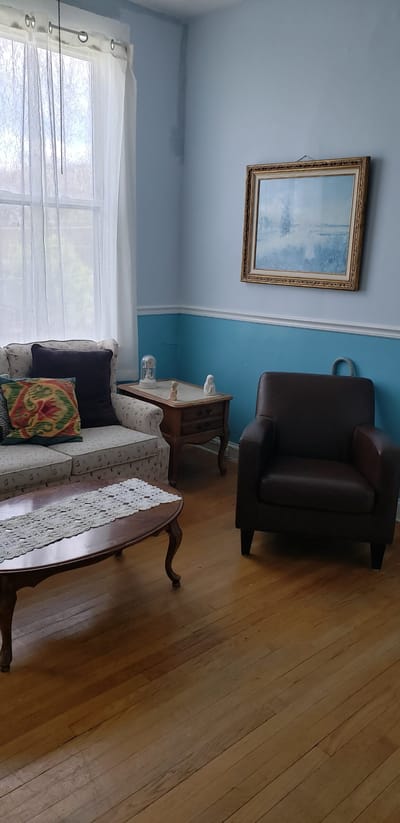
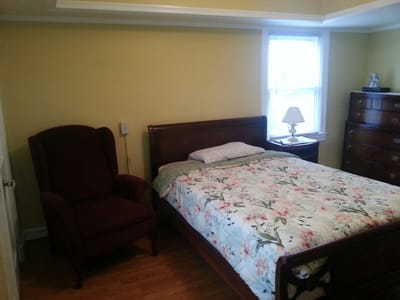
The sister home of The Waterfalls of Catonsville, Lifespring is the assisted living place that boasts a vibrant environment with a friendly atmosphere that allows seniors to nurture and grow as individuals. The senior living community has a personalized care program that caters to the specific needs of unique individuals. Families can rest easy knowing that their loved ones are treated as their own in a home-like setting.
Lifespring’s residential lifestyle is focused on reaching holistic wellness supported by a personal touch approach that creates a mutual level of trust between senior and staff. Accommodations include aromatherapy, in-home chef-prepared meals, social activities, stimulating assisted living activities, and enriching programs.
15-bed community Rank #277 / 697Bed count — State benchmarkedThis home is ranked 277th out of 697 homes in Maryland. Shows this facility's certified or reported bed count compared to other Maryland SNFs. Larger communities may offer more amenities, programs, and on-site services for residents and families.Click the rank badge to see the full State ranking.Click here to see the full State ranking.
A smaller, more intimate setting that may offer a quieter environment and closer staff-resident interactions.
27 years in operation Rank #61 / 208Years in operation — State benchmarkedThis home is ranked 61st out of 208 homes in Maryland. Shows how long this facility has been in operation compared to other Maryland SNFs. Longer operating histories may benefit residents, families, and staff.Click the rank badge to see the full State ranking.Click here to see the full State ranking.
A longer operating history, which may indicate experience navigating regulations and delivering ongoing care.
Walk Score: 21 / 100 Rank #731 / 985Walk Score — State benchmarkedThis home is ranked 731st out of 985 homes in Maryland. Shows how walkable this facility's neighborhood is compared to the average Walk Score across Maryland SNFs. Higher scores benefit residents, families, and staff.Click the rank badge to see the full State ranking.Click here to see the full State ranking.
Car-dependent. Most errands require a car, with limited nearby walkable options.
About this community
Facility TypeAl
CountyBaltimore
Profit StatusFalse
Private Room
$129 - $129 per day
Semi-Private Room
$129 - $129 per day
Hospice Affiliations
Staffing
Key information about the people who lead and staff this community.
No CNA training program
Rehabilitation Services
Respite Care
Doctor on Staff
Nursing Services
24-Hour Staffing
Mild Alzheimer's Level
Moderate Alzheimer's Level
No severe Alzheimer's level
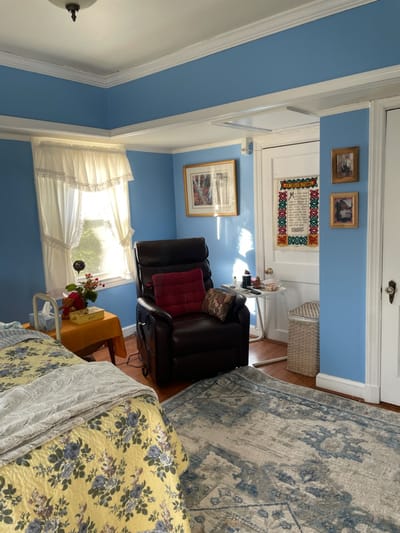
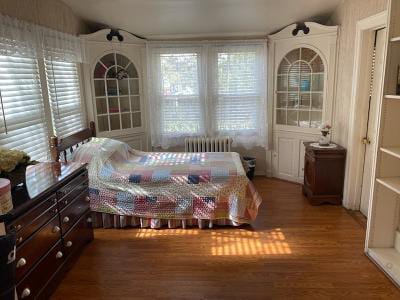
Private And Semi-Private Rooms
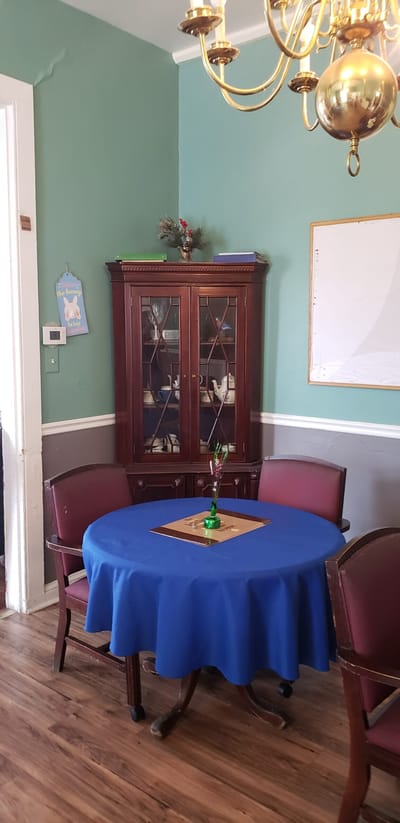
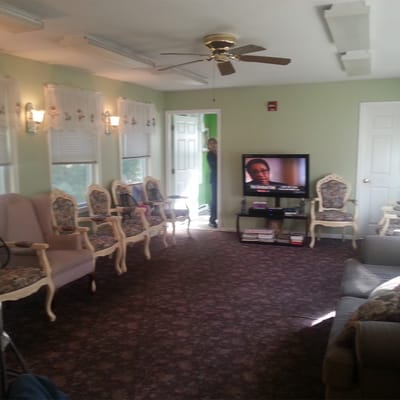
Inviting Living Room
Air Conditioning
Cable Television In Common Areas
Nutritious Home-Cooked Meals And Snacks
Hair Care Amenities
Personal Laundry
Housekeeping
Daily Assistance With Bathing
Dressing
Grooming
Arranged Transportation
Personalized Health Care Management
Activities Offered Daily
ActivitiesActivities offered daily, which include exercise and arts and crafts.
Specific ProgramsPhysical Accommodations, Enhanced Personal Services, Socially-Engaging & Supporting Activities
Religious ServicesYes
Operating HoursMonday — Friday 9am – 5pm, Saturday — By Appointment Only, Sunday — By Appointment Only
Food DescriptionThree nutritious home-cooked meals and snacks provided daily.
Demographics
Resident demographic information for this facility.
Gender
- Female 40%
- Male 60%
Age Distribution
- 85-94 53.3%
- 75-84 20%
- 65-74 13.3%
- 95+ 13.3%
Ethnicity
- White 80%
- African American 20%
What does this home offer?
Housing Options: Private Rooms / Semi-Private Rooms
Building Type: 3-story
Transportation Services
Fitness and Recreation
Places of interest near LifeSpring Assisted Living
![]() 2.8 miles from city center
2.8 miles from city center
![]() Estimated distance in miles from Catonsville's city center to LifeSpring Assisted Living's address, calculated via Google Maps.
— 5.17 miles to nearest hospital (Ascension Saint Agnes Hospital)
Estimated distance in miles from Catonsville's city center to LifeSpring Assisted Living's address, calculated via Google Maps.
— 5.17 miles to nearest hospital (Ascension Saint Agnes Hospital)
Calculate Travel Distance to LifeSpring Assisted Living
Add your location
Financial Assistance for
Memory Care in Maryland
LifeSpring Assisted Living is located in Catonsville, Maryland.
Here are the financial assistance programs available to residents in Maryland.
Compare Memory Care around Catonsville
The information below is reported by the Maryland Department of Health, Office of Health Care Quality.
Filter by care type
| Brightview Rolling Hills |
MC Memory Care Secured, specialized care for people living with Alzheimer's or dementia. Staff trained in cognitive impairment, with higher staff-to-resident ratios and an environment designed to reduce confusion and wandering risk.
AL Assisted Living A licensed, long-term care setting for seniors or individuals with disabilities who need help with daily activities — like bathing, dressing, and medication management — but not 24-hour skilled nursing. Offers housing, meals, and around-the-clock support while aiming to maximize resident independence. | Catonsville (College Hills) | 81
Facility
81
MD AVG
44
Rank
#178 / 697 | Yes |
19
Facility
19
MD AVG
43
Rank
#746 / 985 | Private Rooms / Semi-Private Rooms | 8
Facility
8
MD AVG
21
Rank
#162 / 208 | - |
16% Male Residents — State Benchmarked 16% of residents are male, compared to the Maryland average of 31%. This facility caters to a majority female resident pool (84% female), consistent with the broader assisted living trend where women significantly outnumber men. |
84% Female Residents — State Benchmarked 84% of residents are female, compared to the Maryland average of 69%. Women comprise the large majority, consistent with national assisted living demographics where women live longer and enter care facilities at higher rates. |
95% White Residents — State Benchmarked 95% of residents are reported as White, compared to the Maryland average of 81%. A higher White share than is typical for assisted living in Maryland in this dataset — compare with peer facilities for local context. |
3% African American Residents — State Benchmarked 3% of residents are reported as African American or Black, compared to the Maryland average of 13%. A lower African American share than is typical in Maryland; local markets still vary widely. |
2% Other Ethnicity Residents — State Benchmarked 2% of residents fall into categories other than White or African American (combined), compared to the Maryland average of 6%. This column aggregates Hispanic, Asian, multiracial, and any other labeled groups that are not classified as White or African American. Reported subgroups in this total: Asian (2%). | - |
8% Residents Age 75–84 — State Benchmarked 8% of residents are 75–84, compared to the Maryland average of 31%. Below the state norm — the resident mix may skew either younger or older than this typical middle bracket. |
83% Residents Age 85–94 — State Benchmarked 83% of residents are 85–94, compared to the Maryland average of 44%. A high concentration of very elderly residents signals a higher-acuity facility with experience caring for advanced age-related needs. |
10% Residents Age 95+ — State Benchmarked 10% of residents are 95 or older, compared to the Maryland average of 16%. Most residents here have not yet reached the oldest-old bracket, suggesting a younger overall community. |
| LifeSpring Assisted Living |
MC Memory Care Secured, specialized care for people living with Alzheimer's or dementia. Staff trained in cognitive impairment, with higher staff-to-resident ratios and an environment designed to reduce confusion and wandering risk.
AL Assisted Living A licensed, long-term care setting for seniors or individuals with disabilities who need help with daily activities — like bathing, dressing, and medication management — but not 24-hour skilled nursing. Offers housing, meals, and around-the-clock support while aiming to maximize resident independence.
RC Respite Care Short-term temporary care — days to weeks — to give family caregivers a break. Full care provided during the stay. Often used after hospitalization or to trial a facility before a permanent placement decision. | Catonsville | 15
Facility
15
MD AVG
44
Rank
#277 / 697 | No |
21
Facility
21
MD AVG
43
Rank
#731 / 985 | Private Rooms / Semi-Private Rooms | 27
Facility
27
MD AVG
21
Rank
#61 / 208 | - |
60% Male Residents — State Benchmarked 60% of residents are male, compared to the Maryland average of 31%. An unusually high male share for assisted living, where most facilities skew heavily female. |
40% Female Residents — State Benchmarked 40% of residents are female, compared to the Maryland average of 69%. An unusually low female share — most assisted living facilities have 65–75% female residents. |
80% White Residents — State Benchmarked 80% of residents are reported as White, compared to the Maryland average of 81%. Close to the average for this category among assisted living facilities in Maryland with reported race/ethnicity data. |
20% African American Residents — State Benchmarked 20% of residents are reported as African American or Black, compared to the Maryland average of 13%. In line with the Maryland average for African American residents among facilities reporting this breakdown. |
0% Other Ethnicity Residents — State Benchmarked 0% of residents fall into categories other than White or African American (combined), compared to the Maryland average of 6%. This column aggregates Hispanic, Asian, multiracial, and any other labeled groups that are not classified as White or African American. |
13% Residents Age 65–74 — State Benchmarked 13% of residents are 65–74, compared to the Maryland average of 13%. In line with the statewide profile for this youngest senior bracket in assisted living. |
20% Residents Age 75–84 — State Benchmarked 20% of residents are 75–84, compared to the Maryland average of 31%. Below the state norm — the resident mix may skew either younger or older than this typical middle bracket. |
53% Residents Age 85–94 — State Benchmarked 53% of residents are 85–94, compared to the Maryland average of 44%. A high concentration of very elderly residents signals a higher-acuity facility with experience caring for advanced age-related needs. |
13% Residents Age 95+ — State Benchmarked 13% of residents are 95 or older, compared to the Maryland average of 16%. In line with the statewide profile for the oldest resident bracket. |
| Rolling Meadows |
NH Nursing Home Licensed facility providing 24/7 skilled nursing care for residents with complex, ongoing medical needs. Staffed by RNs, LPNs, and CNAs. Inspected and star-rated annually by CMS. Accepts Medicare (short-term rehab) and Medicaid (long-term care).
AL Assisted Living A licensed, long-term care setting for seniors or individuals with disabilities who need help with daily activities — like bathing, dressing, and medication management — but not 24-hour skilled nursing. Offers housing, meals, and around-the-clock support while aiming to maximize resident independence.
MC Memory Care Secured, specialized care for people living with Alzheimer's or dementia. Staff trained in cognitive impairment, with higher staff-to-resident ratios and an environment designed to reduce confusion and wandering risk. | Catonsville (Colonial Gardens) | 15
Facility
15
MD AVG
44
Rank
#277 / 697 | No |
80
Facility
80
MD AVG
43
Rank
#93 / 985 | Private Rooms / Semi-Private Rooms | 30
Facility
30
MD AVG
21
Rank
#44 / 208 | A+ |
27% Male Residents — State Benchmarked 27% of residents are male, compared to the Maryland average of 31%. This facility caters to a majority female resident pool (73% female), consistent with the broader assisted living trend where women significantly outnumber men. |
73% Female Residents — State Benchmarked 73% of residents are female, compared to the Maryland average of 69%. Women comprise the large majority, consistent with national assisted living demographics where women live longer and enter care facilities at higher rates. |
87% White Residents — State Benchmarked 87% of residents are reported as White, compared to the Maryland average of 81%. Close to the average for this category among assisted living facilities in Maryland with reported race/ethnicity data. |
13% African American Residents — State Benchmarked 13% of residents are reported as African American or Black, compared to the Maryland average of 13%. In line with the Maryland average for African American residents among facilities reporting this breakdown. |
0% Other Ethnicity Residents — State Benchmarked 0% of residents fall into categories other than White or African American (combined), compared to the Maryland average of 6%. This column aggregates Hispanic, Asian, multiracial, and any other labeled groups that are not classified as White or African American. |
47% Residents Age 65–74 — State Benchmarked 47% of residents are 65–74, compared to the Maryland average of 13%. A higher share of younger seniors often signals a more independent, active resident community with lower acuity care needs. |
27% Residents Age 75–84 — State Benchmarked 27% of residents are 75–84, compared to the Maryland average of 31%. This is the second most common age bracket in assisted living, representing residents with moderate care needs. |
20% Residents Age 85–94 — State Benchmarked 20% of residents are 85–94, compared to the Maryland average of 44%. The population here skews younger than the statewide norm, which may indicate a more active, lower-acuity community. |
7% Residents Age 95+ — State Benchmarked 7% of residents are 95 or older, compared to the Maryland average of 16%. Most residents here have not yet reached the oldest-old bracket, suggesting a younger overall community. |
| The Waterfalls of Catonsville |
NH Nursing Home Licensed facility providing 24/7 skilled nursing care for residents with complex, ongoing medical needs. Staffed by RNs, LPNs, and CNAs. Inspected and star-rated annually by CMS. Accepts Medicare (short-term rehab) and Medicaid (long-term care).
AL Assisted Living A licensed, long-term care setting for seniors or individuals with disabilities who need help with daily activities — like bathing, dressing, and medication management — but not 24-hour skilled nursing. Offers housing, meals, and around-the-clock support while aiming to maximize resident independence.
MC Memory Care Secured, specialized care for people living with Alzheimer's or dementia. Staff trained in cognitive impairment, with higher staff-to-resident ratios and an environment designed to reduce confusion and wandering risk. | Catonsville (Colonial Gardens) | 4
Facility
4
MD AVG
44
Rank
#601 / 697 | No |
56
Facility
56
MD AVG
43
Rank
#357 / 985 | Private Rooms / Semi-Private Rooms | - | - | - | - | - | - | - | - | - | - | - |
| Paradise Assisted Living and Memory Care |
MC Memory Care Secured, specialized care for people living with Alzheimer's or dementia. Staff trained in cognitive impairment, with higher staff-to-resident ratios and an environment designed to reduce confusion and wandering risk.
AL Assisted Living A licensed, long-term care setting for seniors or individuals with disabilities who need help with daily activities — like bathing, dressing, and medication management — but not 24-hour skilled nursing. Offers housing, meals, and around-the-clock support while aiming to maximize resident independence. | Catonsville (Beechfield) | - | No |
70
Facility
70
MD AVG
43
Rank
#184 / 985 | Private Rooms / Semi-Private Rooms | - | - | - | - | - | - | - | - | - | - | - |
Frequently Asked Questions about LifeSpring Assisted Living
Is LifeSpring Assisted Living in a walkable area?
LifeSpring Assisted Living has a walk score of 21. Car-dependent. Most errands require a car, with limited nearby walkable options.
How many beds does LifeSpring Assisted Living have?
LifeSpring Assisted Living has 15 beds.
Are there photos of LifeSpring Assisted Living?
Yes — there are 19 photos of LifeSpring Assisted Living in the photo gallery on this page.
What is the phone number of LifeSpring Assisted Living?
(443) 673-4358 will put you in contact with the team at LifeSpring Assisted Living.
What county is LifeSpring Assisted Living located in?
LifeSpring Assisted Living is in Baltimore County.
Is LifeSpring Assisted Living Medicare or Medicaid certified?
LifeSpring Assisted Living is not currently listed as a CMS-certified provider of Medicare or Medicaid.
Guides for Better Senior Living
Care Cost Calculator: See Prices in Your Area
Nursing Home Data Explorer
Don’t Wait Too Long: 7 Red Flag Signs Your Parent Needs Assisted Living Now
The True Cost of Assisted Living in 2025 – And How Families Are Paying For It
Understanding Senior Living Costs: Pricing Models, Discounts & Financial Assistance
Contact Us

Published on
Updated on
Feedback
Write a review for LifeSpring Assisted Living
Rate your overall experience with this community
Explore Open Rooms
1
Contact details
2
What type of senior care service are you looking for?
3
What budget do you have in mind for senior care?
4
How soon do you need to find care?
5
Additional details
Thank you for your interest!
Our team will be in touch shortly to help with next steps.
Need Help?
Let us help you or a loved one find the perfect senior home.
