Lighthouse Nursing Care Center
Nursing Home, Hospice Care, Memory Care, Palliative Care, Respite Care & Skilled Nursing · Revere, MA
CMS overall rating Info CMS (the Centers for Medicare & Medicaid Services) is the federal agency that rates nursing home quality. Its Overall Rating runs from 1 to 5 stars, combining health inspections, staffing, and quality measures, with inspections weighted most heavily.

Lighthouse Nursing Care Center

Nursing Home, Hospice Care, Memory Care, Palliative Care, Respite Care & Skilled Nursing · Revere, MA
CMS overall rating Info CMS (the Centers for Medicare & Medicaid Services) is the federal agency that rates nursing home quality. Its Overall Rating runs from 1 to 5 stars, combining health inspections, staffing, and quality measures, with inspections weighted most heavily.
Calculator: See prices in your area
Lighthouse Nursing Care Center accepts Medicare, Medicaid, and private pay.

Overview of Lighthouse Nursing Care Center

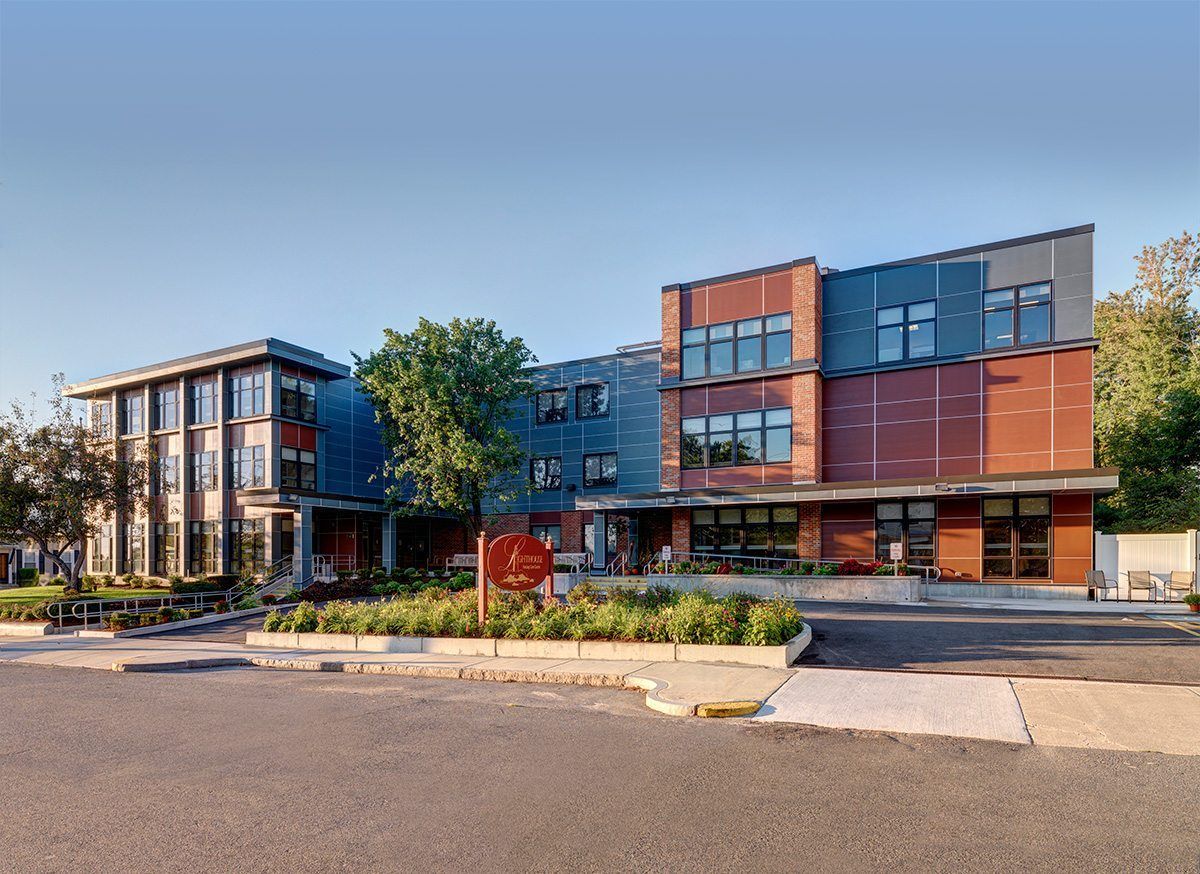
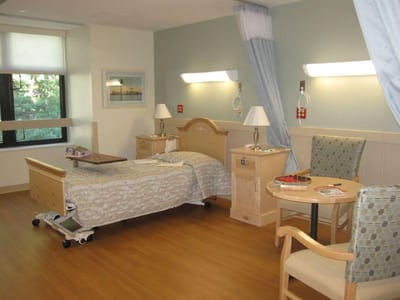
Set in the neighborhood of Revere, MA, Lighthouse Nursing Care Center is an exceptional senior care provider that offers skilled nursing, transitional care, and rehabilitation services. The community strives to help recovering residents return to their homes as soon as possible through its excellent medical and therapy services provided by a dependable team of care professionals. Residents’ accommodations are tailored to foster a home-like environment while allowing for convenient delivery of care and navigation.

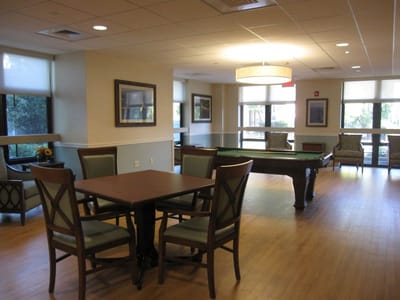
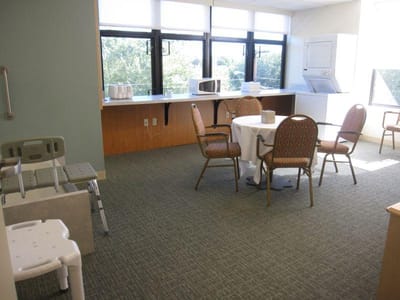
Apart from its exceptional services, the community also prioritizes the ambiance of their campus and makes sure residents also enjoy opportunities for socialization and enjoyment. Hence, residents are offered a variety of fun and engaging activities and thoughtful amenities. Gourmet dining, airy lounges, beautifully-maintained grounds, and salon services are also offered to enhance residents’ comfort and convenience.

Quality ratings

Measured by Centers for Medicare & Medicaid Services (CMS)

Overall rating Info The Overall CMS Rating combines results from health inspections, staffing levels and quality measures. Health inspections carry the most weight. Staffing and quality scores can increase or decrease the final rating based on performance compared to state and national standards.
▲ 3.5% Above MA avg. ▲ 3.5% Above MA avg.MA average: 2.9Click the badge to see the full State ranking.Click here to see the full State ranking.
Health Inspection Info Based on the results of the facility's three most recent standard inspections and any complaint investigations. CMS reviews the number, scope, and severity of deficiencies, with more recent findings weighted more heavily.
▼ 29.7% Below MA avg. ▼ 29.7% Below MA avg.MA average: 2.8Click the badge to see the full State ranking.Click here to see the full State ranking.
Staffing Info Measures average nursing staff hours per resident per day, including Registered Nurses (RNs) and total nursing staff. Ratings are adjusted based on the level of care residents require and are compared to state and national benchmarks.
▼ 33.3% Below MA avg. ▼ 33.3% Below MA avg.MA average: 3.0Click the badge to see the full State ranking.Click here to see the full State ranking.
Quality Measures Info Based on clinical and physical health indicators reported to CMS, such as hospital readmissions, falls, pressure ulcers, and improvements in mobility. These measures reflect how well residents' health needs are being managed.
▲ 57.3% Above MA avg. ▲ 57.3% Above MA avg.MA average: 3.2Click the badge to see the full State ranking.Click here to see the full State ranking.

Staffing hours breakdown

Info Daily nursing hours per resident by staff type, reported to CMS. Higher is generally better — compare this facility to state and national averages to see where staffing stands.

Hours per resident per day — compared to Massachusetts state averages

Total nursing care / resident Info This home is ranked 72nd out of 93 homes in Massachusetts for nurse hours. Total adjusted nursing hours per resident per day, combining RN, LPN, and aide time. CMS adjusts this for case-mix so facilities can be fairly compared.
3h 33m per day
Rank #72 / 93Nurse hours — State benchmarkedThis home is ranked 72nd out of 93 homes in Massachusetts. Shows adjusted nurse hours per resident per day benchmarked to the Massachusetts average, with a ranking across 93 Massachusetts facilities. More hours mean more direct care. The national average is about 3.5 hrs; below 3.0 is a red flag.Rankings are based only on facilities in Massachusetts that report data for that category. Facilities without available data are excluded from the ranking.Click the rank badge to see the full State ranking.Click here to see the full State ranking.
This facility Massachusetts avg (3h 56m per day)
vs Massachusetts avg
-10%

4 of 6 metrics below state avg

Standout metric Registered Nurse (RN) is +52% above state avg
Staff typeHours / Day / Residentvs state avg
Registered Nurse (RN) Info RNs hold the highest nursing license and can assess residents, interpret test results, and direct care plans. More RN hours per day often signals stronger clinical oversight and faster response to health changes. 59m per day ▲ 52% State avg: 39m per day · National avg: 41m per day
LPN / LVN Info Licensed Practical Nurses (LPNs) or Licensed Vocational Nurses (LVNs) deliver routine hands-on care — medication administration, wound dressing, and monitoring vital signs. They work under RN supervision and make up a large share of daily bedside care. 32m per day ▼ 45% State avg: 58m per day · National avg: 52m per day
Nurse Aide Info Certified Nurse Aides (CNAs) provide the most direct day-to-day assistance: bathing, dressing, feeding, and mobility. Nurse aide hours are typically the largest staffing category and directly affect residents' quality of life. 2h 5m per day ▼ 8% State avg: 2h 16m per day · National avg: 2h 21m per day
Weekend Total Nursing Info Combined nursing hours (RN + LPN + Nurse Aide) per resident per day on weekends. Staffing often drops on weekends — this figure reveals whether the facility maintains adequate coverage outside of weekday hours. 3h 14m per day ▼ 6% State avg: 3h 27m per day · National avg: 3h 26m per day
Physical Therapist Info Hours per resident per day provided by licensed Physical Therapists (PTs) or PT Assistants. PT services help residents recover mobility after injury or illness and are especially important for post-acute (short-stay) rehabilitation. 2m per day ▼ 47% State avg: 4m per day · National avg: 4m per day
Weekend RN Info Registered nurse hours specifically on weekends. Facilities sometimes reduce RN presence on Saturdays and Sundays — a low weekend RN figure compared to weekday hours can indicate reduced clinical oversight when most administrative staff are absent. 39m per day ▲ 40% State avg: 28m per day · National avg: 29m per day

Capacity and availability

This home is often near full

Higher occupancy than the Massachusetts average: 82%
Occupancy rate
98% Rank #1 / 96Occupancy rate — State benchmarkedThis home is ranked 1st out of 96 homes in Massachusetts. Shows this facility's occupancy rate versus the Massachusetts average, with its Statewide rank out of 96. Higher occupancy signals strong local demand and financial stability.Rankings are based only on facilities in Massachusetts that report data for that category. Facilities without available data are excluded from the ranking.Click the rank badge to see the full State ranking.Click here to see the full State ranking.
Avg. Length of Stay Info Average number of days residents stay at this facility, based on CMS cost report data. Shorter stays often reflect post-acute or rehab care; longer stays reflect long-term care.
126 days
Bed community size
123-bed community Rank #55 / 280Bed count — State benchmarkedThis home is ranked 55th out of 280 homes in Massachusetts. Shows this facility's certified or reported bed count compared to other Massachusetts facilities. Larger communities may offer more amenities, programs, and on-site services for residents and families.Rankings are based only on facilities in Massachusetts that report data for that category. Facilities without available data are excluded from the ranking.Click the rank badge to see the full State ranking.Click here to see the full State ranking.
A larger shared setting that may offer more common spaces and organized community services.
Walk Score
Walk Score: 68 / 100 Rank #181 / 499Walk Score — State benchmarkedThis home is ranked 181st out of 499 homes in Massachusetts. Shows how walkable this facility's neighborhood is compared to the average Walk Score across Massachusetts facilities. Higher scores benefit residents, families, and staff.Rankings are based only on facilities in Massachusetts that report data for that category. Facilities without available data are excluded from the ranking.Click the rank badge to see the full State ranking.Click here to see the full State ranking.
Moderately walkable. Some errands can be accomplished on foot, with a mix of nearby amenities.

Contact Lighthouse Nursing Care Center

Staffing Data

Reporting period: October 1 – December 31, 2025 (Q4 2025). Source: CMS Payroll-Based Journal report.

Total staff 141
Employees 116
Contractors 25
Staff to resident ratio 1.19 : 1
28% fewer staff per resident than Massachusetts average
Massachusetts average ratio: 1.66 : 1 Massachusetts average ratio: 1.66 : 1See full Massachusetts ranking
Avg staff/day 61
Average shift 7.8 hours
0% compared with Massachusetts average
Massachusetts average: 7.9 hours Massachusetts average shift: 7.9 hoursSee full Massachusetts ranking
Total staff hours (quarter) 43,972

Nursing staff breakdown

Q4 2025 · Oct 1 – Dec 31 More info This data comes from the CMS Payroll-Based Journal report covering October 1 – December 31, 2025.
Registered Nurse

Manages medical care and health needs.

RN Staff Info 24 total: 19 full-time employees and 5 contractors. 24
Average shift length Info Average shift length. Calculated as total hours divided by days worked and average staff per day. 9.1 hours
Licensed Practical Nurse

Assists with medical care and medications.

LPN Staff Info 15 total: 14 full-time employees and 1 contractor. 15
Average shift length Info Average shift length. Calculated as total hours divided by days worked and average staff per day. 7.9 hours
Certified Nursing Assistant

Helps with daily care and mobility.

CNA Staff Info All 60 CNA Staff are full-time employees. No contractors work on this role. 60
Average shift length Info Average shift length. Calculated as total hours divided by days worked and average staff per day. 7.6 hours

Contractor staffing

Q4 2025 · Oct 1 – Dec 31 More info This data comes from the CMS Payroll-Based Journal report covering October 1 – December 31, 2025.

Total hours from contractors

5.3%

2,330 contractor hours this quarter

Physical Therapy Assistant: 6 Registered Nurse: 5 Qualified Social Worker: 4 Respiratory Therapy Technician: 4 Speech Language Pathologist: 3 Physical Therapy Aide: 2 Licensed Practical Nurse: 1

Staff by category

Q4 2025 · Oct 1 – Dec 31 More info This data comes from the CMS Payroll-Based Journal report covering October 1 – December 31, 2025.
Certified Nursing Assistant6006022,33692100%7.6
Registered Nurse195247,36592100%9.1
Licensed Practical Nurse141155,14692100%7.9
Clinical Nurse Specialist7072,8757986%8.3
Other Dietary Services Staff9091,25792100%6.3
Mental Health Service Worker2028046672%7.7
Physical Therapy Assistant0666837683%6.2
RN Director of Nursing1015296065%8.8
Physical Therapy Aide0225125661%7.9
Administrator1014966267%8
Dietitian1014725964%8
Speech Language Pathologist0334685964%7.8
Nurse Practitioner1013924953%8
Respiratory Therapy Technician0443806368%5.3
Qualified Social Worker0441424145%3.4
Dental Services Staff1011161617%7.2
60 Certified Nursing Assistant
% of Days 100%
24 Registered Nurse
% of Days 100%
15 Licensed Practical Nurse
% of Days 100%
7 Clinical Nurse Specialist
% of Days 86%
9 Other Dietary Services Staff
% of Days 100%
2 Mental Health Service Worker
% of Days 72%
6 Physical Therapy Assistant
% of Days 83%
1 RN Director of Nursing
% of Days 65%
2 Physical Therapy Aide
% of Days 61%
1 Administrator
% of Days 67%
1 Dietitian
% of Days 64%
3 Speech Language Pathologist
% of Days 64%
1 Nurse Practitioner
% of Days 53%
4 Respiratory Therapy Technician
% of Days 68%
4 Qualified Social Worker
% of Days 45%
1 Dental Services Staff
% of Days 17%

Penalties and fines

Federal penalties imposed by CMS for regulatory violations, including civil money penalties (fines) and denials of payment for new Medicare/Medicaid admissions.

Source: CMS Penalties Database (Data as of Jan 2026)

Total fines amount $3K Rank #1 / 94Federal fines — State benchmarkedThis home is ranked 1st out of 94 homes in Massachusetts. Shows this facility's cumulative CMS federal fine dollars versus the Massachusetts average among facilities with fines, and where it ranks among 94 facilities in the pool. Lower total dollars mean a better rank.Rankings are based only on facilities in Massachusetts that report data for that category. Facilities without available data are excluded from the ranking.Click the rank badge to see the full State ranking.Click here to see the full State ranking.
95% lower than Massachusetts average

Massachusetts average: $72K

Number of fines 1
42% fewer fines than Massachusetts average

Massachusetts average: 1.7

Payment Denials Info Serious action where Medicare and/or Medicaid temporarily stops payments for new residents until issues are fixed. 1
1274% more payment denials than Massachusetts average

Massachusetts average: 0.1

Fines amount comparison
This facility $3K
Massachusetts average $72K

No penalties in the past 3 years

No civil money penalties or payment denials were reported in the last 3 years.

Quality of care over time

These measures show how residents usually do over time at this home, based on health outcomes and preventive care.

High-risk clinical events score Info A composite score based on pressure ulcers, falls with injury, weight loss, walking ability decline, and activities of daily living decline. 10.7
In line with Massachusetts average

Massachusetts average: 10.2

Functional decline score Info A composite score based on activities of daily living decline, walking ability decline, and incontinence. 22.2
11% worse than Massachusetts average

Massachusetts average: 20.0

Long-stay resident measures
Average Massachusetts avg: 3.6 Info CMS star rating based on long-stay quality measure performance. 5 stars = significantly above average, 1 star = significantly below average.
Need for Help with Daily Activities Increased Info Percent of long-stay residents whose need for help with daily activities has increased 21.4%
14% worse than Massachusetts average

Massachusetts average: 18.7%

Walking Ability Worsened Info Percent of long-stay residents whose ability to move independently worsened 20.8%
8% worse than Massachusetts average

Massachusetts average: 19.3%

Low Risk Residents with Bowel/Bladder Incontinence Info Percent of low risk long-stay residents who lose control of their bowels or bladder 24.3%
10% worse than Massachusetts average

Massachusetts average: 22.1%

Falls with Major Injury Info Percent of long-stay residents experiencing one or more falls with major injury 4.0%
12% worse than Massachusetts average

Massachusetts average: 3.6%

High Risk Residents with Pressure Ulcers Info Percent of long-stay high risk residents with pressure ulcers 4.6%
In line with Massachusetts average

Massachusetts average: 4.7%

Urinary Tract Infection Info Percent of long-stay residents with a urinary tract infection 1.0%
50% better than Massachusetts average

Massachusetts average: 2.1%

Lost Too Much Weight Info Percent of long-stay residents who lose too much weight 2.6%
49% better than Massachusetts average

Massachusetts average: 5.2%

Depressive Symptoms Info Percent of long-stay residents who have depressive symptoms 19.2%
79% worse than Massachusetts average

Massachusetts average: 10.7%

Antipsychotic Use Info Percent of long-stay residents who received an antipsychotic medication 12.3%
39% better than Massachusetts average

Massachusetts average: 20.3%

Pneumococcal Vaccine Info Percent of long-stay residents assessed and appropriately given the pneumococcal vaccine 83.6%
9% worse than Massachusetts average

Massachusetts average: 91.9%

Influenza Vaccine Info Percent of long-stay residents assessed and appropriately given the seasonal influenza vaccine 93.5%
In line with Massachusetts average

Massachusetts average: 94.8%

Hospitalizations per 1,000 days Info Number of hospitalizations per 1,000 long-stay resident days. 2.45
32% worse than Massachusetts average

Massachusetts average: 1.86

ED visits per 1,000 days Info Number of outpatient emergency department visits per 1,000 long-stay resident days. 1.27
18% better than Massachusetts average

Massachusetts average: 1.54

Short-stay resident measures
Significantly above average Massachusetts avg: 3.2 Info CMS star rating based on short-stay quality measure performance. 5 stars = much above average, 1 star = much below average.
Pneumococcal Vaccine Info Percent of short-stay residents assessed and appropriately given the pneumococcal vaccine 64.5%
16% worse than Massachusetts average

Massachusetts average: 76.7%

Antipsychotic medication increase Info Percent of short-stay residents who newly received an antipsychotic medication 1.1%
20% better than Massachusetts average

Massachusetts average: 1.3%

Influenza Vaccine Info Percent of short-stay residents assessed and appropriately given the seasonal influenza vaccine 79.2%
In line with Massachusetts average

Massachusetts average: 77.7%

Re-hospitalized after SNF stay Info Percentage of short-stay residents who were re-hospitalized after their nursing home admission. 22.2%
14% better than Massachusetts average

Massachusetts average: 25.8%

Emergency department visits Info Percentage of short-stay residents who had an outpatient emergency department visit. 7.1%
40% better than Massachusetts average

Massachusetts average: 11.8%

Falls with major injury Info Percentage of SNF residents who experience falls with major injury during their stay. 1.6%
101% worse than Massachusetts average

Massachusetts average: 0.8%

Ability to care for self at discharge Info Percentage of residents at or above expected ability to care for themselves at discharge. 41.6%
23% worse than Massachusetts average

Massachusetts average: 53.7%

Successful return to home or community Info Rate of successful return to home or community from a skilled nursing facility. 58.0%
15% better than Massachusetts average

Massachusetts average: 50.6%

Breakdown by payment type

Medicare

49% of new residents, usually for short-term rehab.

Typical stay 24 days

Private pay

50% of new residents, often for short stays.

Typical stay 4 - 5 months

Medicaid

1% of new residents, often for long-term daily care.

Typical stay 13 - 14 years

Facility Characteristics

Source: CMS Long-Term Care Facility Characteristics (Data as of Jan 2026)

Total residents 118
Medicare
12
10.2% of residents
Medicaid
92
78% of residents
Private pay or other
14
11.9% of residents
Programs & Services
Residents Group

Residents meet regularly to discuss policies, care quality, and activities

Family Member Group

Family members meet regularly to discuss policies, care quality, and activities

Active Family Council

Organized group of family members that meets regularly to discuss facility policies, resident care, and activities.

Active Resident Council

Organized group of residents that meets regularly to discuss facility policies, quality of life, and activities.

Finances and operations

Based on CMS SNF Cost Report for fiscal year ending in 12/2023.

For-profit
Operated by a single business entity.
Net patient revenue Info Net patient revenue — what the home actually collects for resident care, after contractual allowances, bad debt and discounts are subtracted from its gross charges (CMS cost report, Worksheet G-3). It covers resident care only; money the home earns from other sources is shown separately as "Other income."
$14.9M
Net patient income Info Net patient income: net patient revenue minus the home's total operating expenses. A positive figure means it earns more from resident care than it spends to deliver it; a negative figure means the opposite. It excludes non-operating "other income."
-$1.8M
For-profit Operated by a single business entity.
Net patient revenue Info Net patient revenue — what the home actually collects for resident care, after contractual allowances, bad debt and discounts are subtracted from its gross charges (CMS cost report, Worksheet G-3). It covers resident care only; money the home earns from other sources is shown separately as "Other income."
$14.9M Rank #39 / 96Revenue — State benchmarkedThis home is ranked 39th out of 96 homes in Massachusetts. Shows this facility's annual revenue compared to the Massachusetts average. Higher revenue generally means more resources for staffing and capital — read alongside Payroll %.Rankings are based only on facilities in Massachusetts that report data for that category. Facilities without available data are excluded from the ranking.Click the rank badge to see the full State ranking.Click here to see the full State ranking.
Net patient income Info Net patient income: net patient revenue minus the home's total operating expenses. A positive figure means it earns more from resident care than it spends to deliver it; a negative figure means the opposite. It excludes non-operating "other income."
-$1.8M
Other income Info Money the home earns outside of resident care — such as investments, grants, rentals and other non-operating sources (CMS cost report, Worksheet G-3). It is tracked separately from net patient revenue: it is not part of that figure, and it is not included in net patient income.
-$453.0K
Payroll costs Info Staff salaries plus wage-related costs — benefits such as payroll taxes, health insurance and retirement — from the home's own accounting records (CMS cost report, Worksheet A). Contract or agency labor is counted separately, under other operating costs. Rank #39 / 96Payroll — State benchmarkedThis home is ranked 39th out of 96 homes in Massachusetts. Shows total annual staff payroll benchmarked to the Massachusetts average. Higher payroll investment relative to peers often signals better staffing and less reliance on cheaper contract labor.Rankings are based only on facilities in Massachusetts that report data for that category. Facilities without available data are excluded from the ranking.Click the rank badge to see the full State ranking.Click here to see the full State ranking.
$9.5M 63.3% of net patient revenue Info Payroll as a share of revenue: staff salaries and wage-related benefits divided by net patient revenue. A higher figure means more of each revenue dollar goes to staff pay. Rank #47 / 96Payroll % — State benchmarkedThis home is ranked 47th out of 96 homes in Massachusetts. Shows payroll as a percentage of revenue versus the Massachusetts average. Well-run Massachusetts facilities typically land around 54–65% — the top third Statewide. Below 25% may signal understaffing or heavy agency use — read with Staffing ratings.Rankings are based only on facilities in Massachusetts that report data for that category. Facilities without available data are excluded from the ranking.Click the rank badge to see the full State ranking.Click here to see the full State ranking.
Other operating costs Info Everything it costs to run the home apart from payroll — food, utilities, supplies, maintenance, contract labor and administration. Calculated as total operating expense minus payroll (staff salaries and wage-related benefits).
$7.2M
Total costs Info The home's total operating expense for the year — all the costs of running it, salaries included (CMS cost report, Worksheet G-3).
$16.7M

What does this home offer?

Housing options icon

Housing Options: Private / Semi-Private Rooms

Building type icon
Building type icon

Building Type: 3-story

Who this home usually serves

TYPE OF STAY

Mix of rehab and long-term care

This home supports both short-term rehab and long-term care, with residents staying for a wide range of durations.

Most new residents arrive under private pay (50% of admissions), and a typical private pay stay runs around 4 - 5 months.

Admissions
338 total

Coverage residents most often arrive under.

Medicare 49%
Private pay 50%
Medicaid 1%
Discharges
349 total

Coverage residents most often leave under.

Medicare 34%
Private pay 58%
Medicaid 8%

Places of interest near Lighthouse Nursing Care Center

Address 0.7 miles from city center Info Estimated distance in miles from Revere's city center to Lighthouse Nursing Care Center's address, calculated via Google Maps.

Calculate Travel Distance to Lighthouse Nursing Care Center

Add your location

Address

Compare Nursing Homes around Malden

The information below is reported by the Massachusetts Executive Office of Elder Affairs and Department of Public Health.

2 facilities compared · CMS & MA Dept. of Health data

Lighthouse Nursing Care Center
NH
HOS
MC
PC
RC
SNF
Revere (Proctor Avenue)
123
Facility 123
MA AVG 94
Rank #55 / 280
98.0%
Facility 98.0%
MA AVG 82%
Rank #1 / 96
+20%
3.55
Facility 3.55
MA AVG 3.93
Rank #72 / 93
+33%-10%
$0
Facility $0
MA AVG $76.6k
Rank #1 / 94
51
Facility 51
MA AVG 32.7
Rank #84 / 93
17.0
Facility 17.0
MA AVG 7.2
Rank #93 / 93
-117-
68
Facility 68
MA AVG 53
Rank #181 / 499
Richard Henry
$14.9MFiscal year ending 12/2023
Facility $14.9MFiscal year ending 12/2023
MA AVG $17.4M
Rank #39 / 96
$9.5MFiscal year ending 12/2023
Facility $9.5MFiscal year ending 12/2023
MA AVG $6.5M
Rank #39 / 96
63.3%Fiscal year ending 12/2023
Facility 63.3%Fiscal year ending 12/2023
MA AVG 43.6%
Rank #47 / 96
225297
The Rehabilitation & Nursing Center at Everett
NH
HOS
PC
SNF
Everett
120
Facility 120
MA AVG 94
Rank #63 / 280
77.3%
Facility 77.3%
MA AVG 82%
Rank #63 / 96
-6%
3.61
Facility 3.61
MA AVG 3.93
Rank #68 / 93
-36%-8%
$12.4k
Facility $12.4k
MA AVG $76.6k
Rank #65 / 94
42
Facility 42
MA AVG 32.7
Rank #72 / 93
8.4
Facility 8.4
MA AVG 7.2
Rank #67 / 93
288-
66
Facility 66
MA AVG 53
Rank #193 / 499
Scott Brewer
$11.6MFiscal year ending 12/2023
Facility $11.6MFiscal year ending 12/2023
MA AVG $17.4M
Rank #51 / 96
$4.4MFiscal year ending 12/2023
Facility $4.4MFiscal year ending 12/2023
MA AVG $6.5M
Rank #66 / 96
37.9%Fiscal year ending 12/2023
Facility 37.9%Fiscal year ending 12/2023
MA AVG 43.6%
Rank #85 / 96
225349

Financial Assistance for
Nursing Home in Massachusetts

Lighthouse Nursing Care Center is located in Revere, Massachusetts.
Here are the financial assistance programs available to residents in Massachusetts.

Get Financial aid guidance

Home Care Program

MassHealth Home Care

Age 60+
General Massachusetts resident, at risk of nursing home placement.
Income Limits (2025) ~$1,500/month individual, varies by region
Asset Limits $2,000 individual, excludes home, car
MA

Coordinated through Aging Services Access Points (ASAPs); high demand in urban areas.

Benefits
In-home care (3-5 hours/day) Homemaker services Respite care (up to 14 days/year) Adult day care (~$75/day)

Frail Elder Waiver

Massachusetts Medicaid FE Waiver

Age 65+
General Massachusetts resident, Medicaid-eligible, nursing home-level care need.
Income Limits (2025) ~$2,829/month 300% FBR, individual
Asset Limits $2,000 (individual), $3,000 (couple).
MA

Requires clinical eligibility determination.

Benefits
Personal care (5-7 hours/day) Respite care (240 hours/year) Adult day care (~$75/day) Home health services

Senior Care Options (SCO)

Massachusetts Senior Care Options

Age 65+
General Massachusetts resident, eligible for MassHealth (Medicare optional), nursing home-level care need.
Income Limits (2025) ~$2,829/month (300% FBR, individual); QIT allowed.
Asset Limits $2,000 (individual), $3,000 (couple) (excludes home up to $713,000, car).
MA

Not available in Dukes/Nantucket Counties; multiple SCO providers (e.g., CCA, Tufts).

Benefits
Personal care (5-7 hours/day) Medical care Respite (240 hours/year) Adult

Medicare Savings Program (MSP)

Massachusetts Medicare Savings Program (MassHealth Buy-In)

Age 65+ or disabled
General Massachusetts resident, Medicare Part A/B.
Income Limits (2025) ~$2,510/month (QMB), ~$3,380/month (SLMB), ~$3,598/month (QI)—individual.
Asset Limits $9,430 (individual), $14,130 (couple).
MA

Three tiers; no waitlist; includes Extra Help for Part D.

Benefits
Covers Part B premiums ($174.70/month) Deductibles ($240/year) Copays (~20%)

National Family Caregiver Support Program (NFCSP) Respite

Massachusetts NFCSP Respite Care

Age
General Caregivers of 60+ needing care or 55+ caregivers of others; Massachusetts resident; functional needs (2+ ADLs).
Income Limits (2025) Prioritizes ~$24,980/year (individual); no strict cap.
Asset Limits Not assessed; need-based.
MA

27 ASAPs; prioritizes low-income, rural caregivers.

Benefits
Respite (4-6 hours/week or 5 days/year) Adult day care ($60/day) Caregiver training Supplies (~$500/year)

Prescription Advantage

Massachusetts Prescription Advantage

Age 65+ or disabled
General Massachusetts resident, enrolled in Medicare Part D (or ineligible for Medicare).
Income Limits (2025) No strict limit; copays vary by income ~$24,980-$75,000/year individual
Asset Limits Not assessed.
MA

Supplements Medicare Part D; no enrollment fee for low-income.

Benefits
Covers prescription copays ($5-$40/drug) Fills coverage gaps Catastrophic cost protection ($4,000+ covered)

VA Aid and Attendance (A&A) and Housebound Benefits

Massachusetts VA Aid and Attendance/Housebound

Age 65+ or disabled veteran/spouse
General Massachusetts resident, wartime service, need for ADL help (A&A) or homebound.
Income Limits (2025) Net income < ~$1,984/month (veteran with dependent, A&A); pension offsets income.
Asset Limits ~$155,356 net worth limit
MA

High veteran demand statewide.

Benefits
Cash (~$1,433-$2,642/month veteran, ~$951-$1,318 spouse) for care costs (e.g., in-home, assisted living)

Frequently Asked Questions about Lighthouse Nursing Care Center

What neighborhood is Lighthouse Nursing Care Center in?

Lighthouse Nursing Care Center is in the Proctor Avenue neighborhood.

Is Lighthouse Nursing Care Center in a walkable area?

Lighthouse Nursing Care Center has a walk score of 68. Moderately walkable. Some errands can be accomplished on foot, with a mix of nearby amenities.

What is the occupancy rate at Lighthouse Nursing Care Center?

Lighthouse Nursing Care Center's occupancy is 98.0%.

Does Lighthouse Nursing Care Center operate as a for-profit or non-profit?

Lighthouse Nursing Care Center is registered as a for-profit.

Are there photos of Lighthouse Nursing Care Center?

Yes — there are 4 photos of Lighthouse Nursing Care Center in the photo gallery on this page.

What is the address of Lighthouse Nursing Care Center?

Lighthouse Nursing Care Center is located at 204 Proctor Ave, Revere, MA 02151.

What is the phone number of Lighthouse Nursing Care Center?

(781) 286-3100 will put you in contact with the team at Lighthouse Nursing Care Center.

Guides for Better Senior Living

Care Cost Calculator: See Prices in Your Area

Nursing Home Data Explorer

Don’t Wait Too Long: 7 Red Flag Signs Your Parent Needs Assisted Living Now

The True Cost of Assisted Living in 2025 – And How Families Are Paying For It

Understanding Senior Living Costs: Pricing Models, Discounts & Financial Assistance