Explore Open Rooms

1 Contact details
2 What type of senior care service are you looking for?
3 What budget do you have in mind for senior care?
4 How soon do you need to find care?
5 Additional details

Thank you for your interest!

Our team will be in touch shortly to help with next steps.

Nursing Home in Stockton

CMS overall rating Info The Overall CMS Rating combines results from health inspections, staffing levels and quality measures. Health inspections carry the most weight. Staffing and quality scores can increase or decrease the final rating based on performance compared to state and national standards.

Lincoln Square

1032 N Lincoln St, Stockton, CA 95203 View map
Overview of Lincoln Square

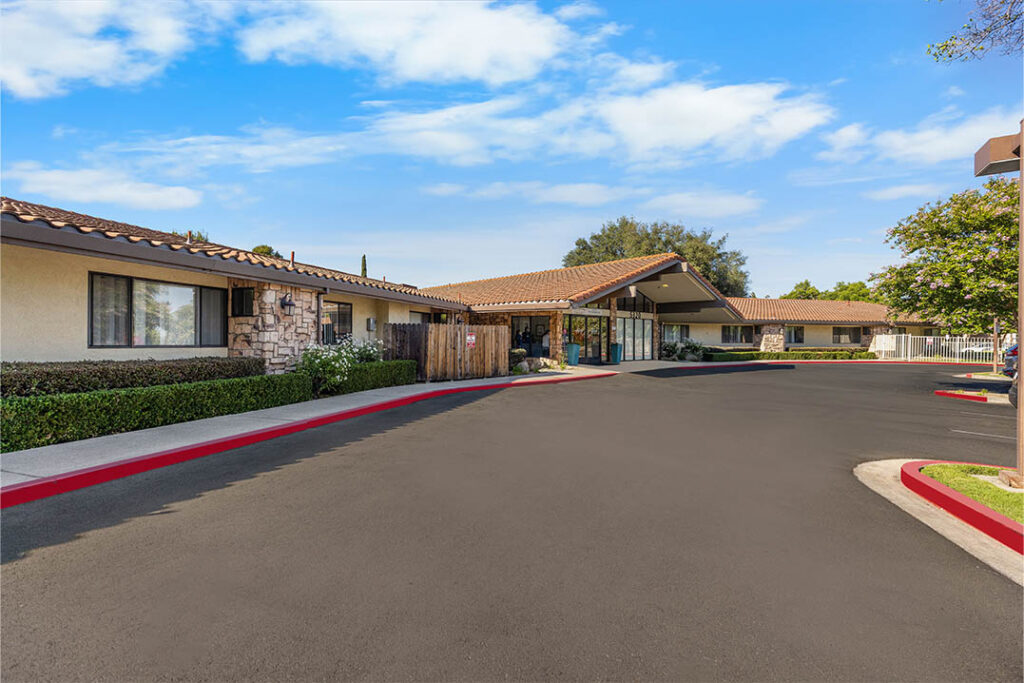
Lincoln Square, seated in Stockton, CA, is a skilled nursing facility that offers a comprehensive range of services designed to cater to various healthcare needs. With a focus on rehabilitation and long-term/end-of-life care, Lincoln Square provides a nurturing environment where residents receive top-notch medical attention and support. The facility’s dedicated team of professionals delivers personalized nursing services, ensuring residents’ well-being through expert medication management and assistance with Activities of Daily Living (ADLs).

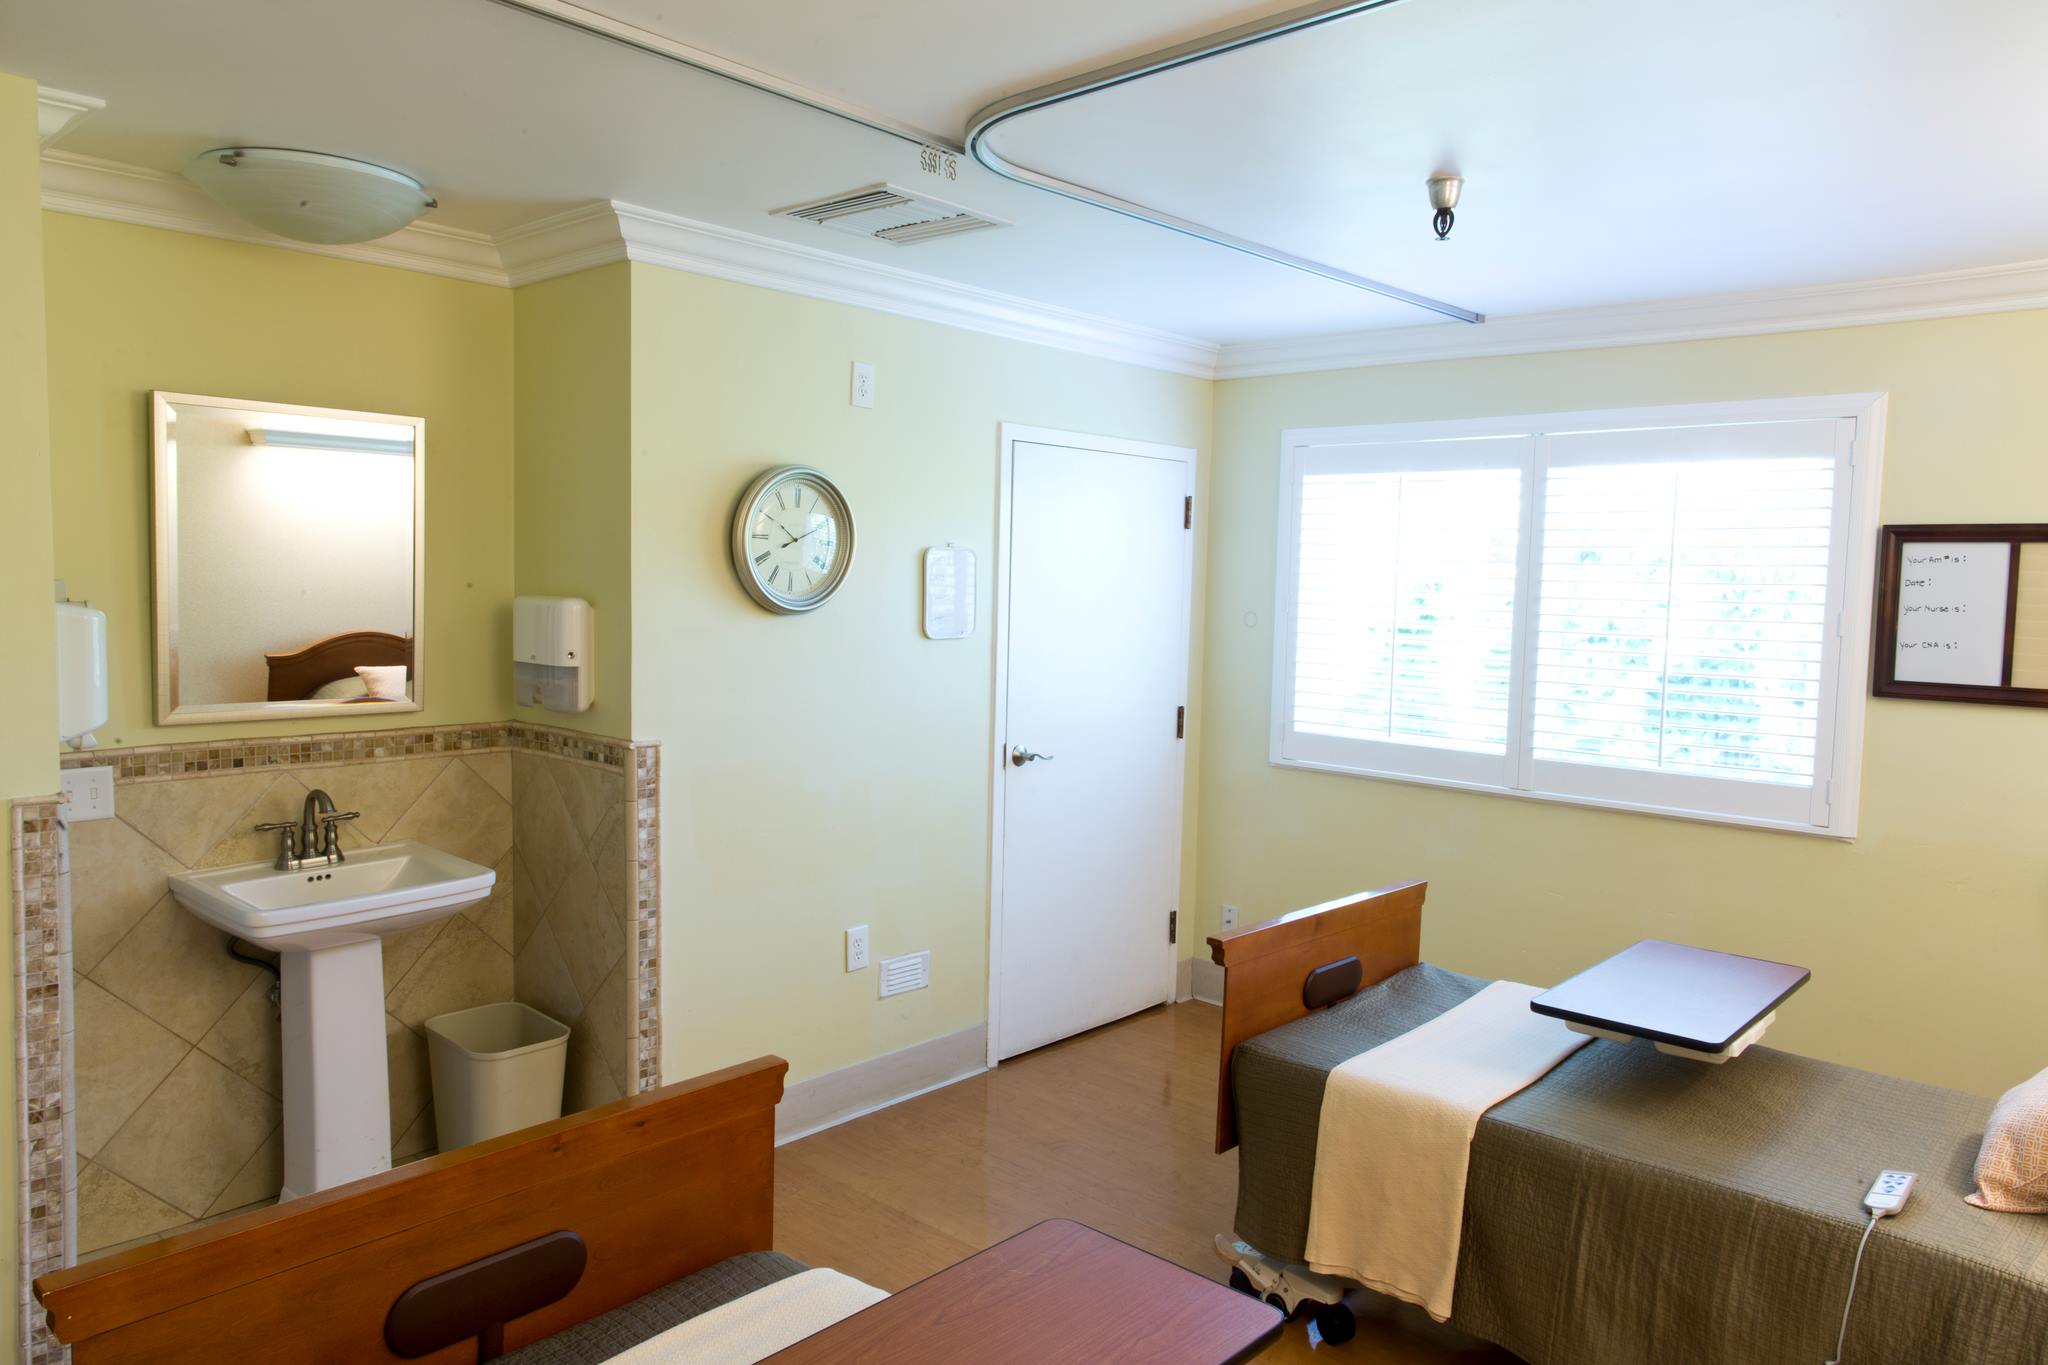
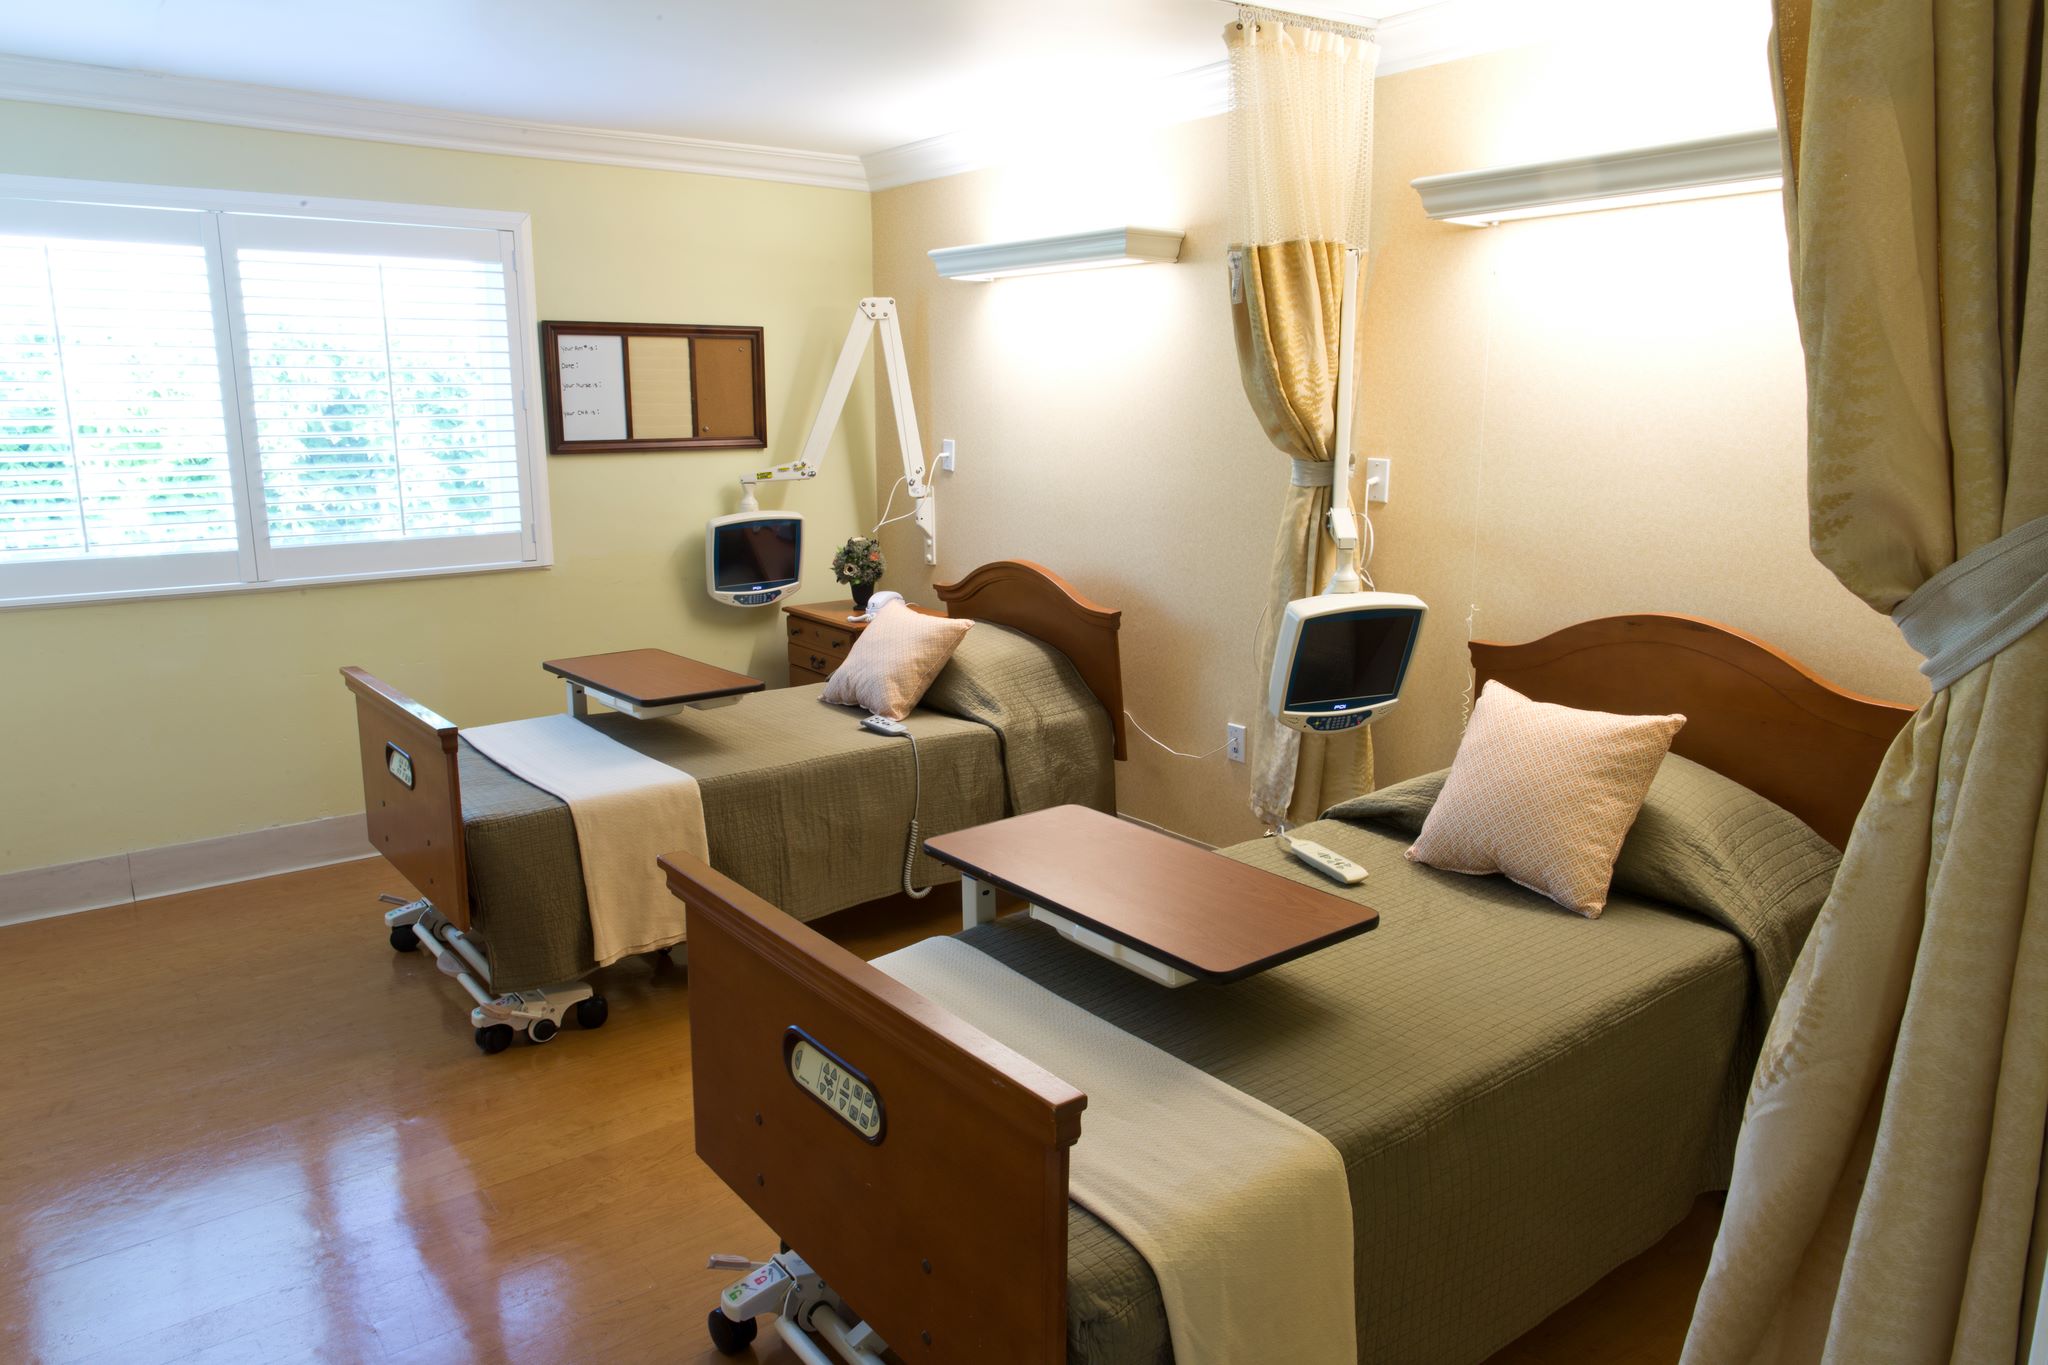
At Lincoln Square, residents benefit from specialized dementia care, tailored to meet the unique needs of individuals with memory impairments. The facility boasts 24-hour supervision and a responsive 24-hour call system, always ensuring the residents’ safety. With 12–16-hour nursing services, residents receive continuous medical care, further enhancing their peace of mind. Lincoln Square prioritizes residents’ comfort with essential housekeeping services, maintaining a clean and hygienic living environment. Additionally, the facility offers a diverse range of culinary experiences, including diabetes diets and accommodation for special dietary restrictions. Residents indulge in restaurant-style dining, relishing carefully prepared meals served with care and attention, enriching their overall dining experience and quality of life.

Quality ratings

Measured by Centers for Medicare & Medicaid Services (CMS)

Overall rating Info The Overall CMS Rating combines results from health inspections, staffing levels and quality measures. Health inspections carry the most weight. Staffing and quality scores can increase or decrease the final rating based on performance compared to state and national standards.
3/5
California average: 3.1/5
Health Inspection Info Based on the results of the facility's three most recent standard inspections and any complaint investigations. CMS reviews the number, scope, and severity of deficiencies, with more recent findings weighted more heavily.
2/5
California average: 2.8/5
Staffing Info Measures average nursing staff hours per resident per day, including Registered Nurses (RNs) and total nursing staff. Ratings are adjusted based on the level of care residents require and are compared to state and national benchmarks.
3/5
California average: 3.1/5
Quality Measures Info Based on clinical and physical health indicators reported to CMS, such as hospital readmissions, falls, pressure ulcers, and improvements in mobility. These measures reflect how well residents' health needs are being managed.
5/5
California average: 4.1/5

Nursing care per resident

Info This shows how many total hours of nursing staff time are available per resident each day. Higher numbers usually mean more staff support.
3h 40m per day

This home provides 13% less nursing time per resident than the California average.

California average: 4h 13m per day

Staffing hours breakdown

Info Hours of care per resident per day, broken down by staff type. Data from CMS Medicare.
Staff type Facility State avg National avg
Registered Nurse (RN) Info Registered nurse hours per resident per day. 29m per day 39m per day 41m per day
Nurse Aide Info Nurse aide hours per resident per day. 2h 18m per day 2h 39m per day 2h 21m per day
Total Nursing (Weekend) Info Total number of nurse staff hours per resident per day on weekends. 3h 43m per day 4h 5m per day 3h 26m per day
Physical Therapist Info Physical therapist staff hours per resident per day. 12m per day 5m per day 4m per day
RN (Weekend) Info Registered nurse hours per resident per day on weekends. 22m per day 30m per day 29m per day

Capacity and availability

Smaller home

May offer a more intimate, personalized care environment.

Total beds 68

This home usually has limited availability

Occupancy is moderate, suggesting balanced demand.

Similar demand to the California average
Occupancy rate 87.2%
Residents per day (avg) 59
Occupancy rate
87.2%
Residents per day (avg)
59

Who this home usually serves

TYPE OF STAY

Mostly short-term rehab stays

Most residents typically stay for a few weeks or months before returning home or moving on.

Might be optimal for
Short stays Recovery Medicare-covered care

Breakdown by payment type

Medicare

42% of new residents, usually for short-term rehab.

Typical stay 1 - 2 months

Private pay

40% of new residents, often for short stays.

Typical stay 1 months

Medicaid

18% of new residents, often for long-term daily care.

Typical stay 4 - 5 months

Finances and operations

Privately-owned community
Operated by a business corporation.
Home revenue
$15.9M
Profit
$1.4M
Privately-owned community Operated by a business corporation.
Home revenue
$15,862,537.00
Profit
$1,435,386.00
Payroll costs Info The portion of the home's budget spent on staff, including nurses, caregivers, and other employees who support care and operations.
$5.6M
35.1% of revenue
Other operating costs Info All remaining costs needed to run the home, such as food, utilities, building maintenance, supplies and administrative expenses.
$8.9M
Total costs $14.4M
Walk Score
Walk Score: 80 / 100
Very walkable. Most errands can be accomplished on foot, and many essentials are within a short walk.

About this community

Amenities & Lifestyle

Public Safety Officers
Clean Team
Seasonal Beautification
Community Events

Programs & Activities

Specific Programs
Public Safety, Area Maintenance, Streetscape and Beautification, Marketing and Promotion
Operating Hours
Monday-Sunday: 8am-8pm

Types of Care at Lincoln Square

Skilled Nursing Hospice Care
Contact Lincoln Square

Health Inspection History

Inspections
Total health inspections 8

California average 12.5


Last Health inspection on May 2025

Total health citations 55

California average 50.2

Citations per inspection
6.88

California average 4.65


Health citations are formal notices following inspections when they fail to comply with safety and care standards.

45 of 55 citations resulted from standard inspections; 9 of 55 resulted from complaint investigations; and 1 of 55 came from combined inspections (standard and complaint).

Breakdown of citation severity (last 3 years)
Critical Health citations More info 0
100% better than California average

California average: 0.4


Serious Health citations More info 0
100% better than California average

California average: 1

0 critical citations More info California average: 0.4

0 serious citations More info California average: 1

55 moderate citations More info California average: 47.2

0 minor citations More info California average: 1.5
Citations history (last 3 years)
Quality of Care moderate citation Info Issues related to how well residents receive appropriate treatment and support for their medical and daily care needs. May 27, 2025
Corrected

Infection Control moderate citation Info Issues related to preventing and controlling infections, including hygiene practices and safety protocols. Dec 18, 2024
Corrected

Infection Control moderate citation Info Issues related to preventing and controlling infections, including hygiene practices and safety protocols. Dec 18, 2024
Corrected

Infection Control moderate citation Info Issues related to preventing and controlling infections, including hygiene practices and safety protocols. Dec 18, 2024
Corrected

Compare Nursing Homes around Stockton The information below is reported by the California Department of Social Services and Department of Public Health.

5 facilities compared · CMS & CA Dept. of Health data · Updated Apr 2026

Filter by care type
Riverwood Health Care Center
MC

Memory Care Secured, specialized care for people living with Alzheimer's or dementia. Staff trained in cognitive impairment, with higher staff-to-resident ratios and an environment designed to reduce confusion and wandering risk.

NH

Nursing Home Licensed facility providing 24/7 skilled nursing care for residents with complex, ongoing medical needs. Staffed by RNs, LPNs, and CNAs. Inspected and star-rated annually by CMS. Accepts Medicare (short-term rehab) and Medicaid (long-term care).

RC

Respite Care Short-term temporary care — days to weeks — to give family caregivers a break. Full care provided during the stay. Often used after hospitalization or to trial a facility before a permanent placement decision.

Stockton (Valley Oak)
99
90.5%
+7%
4.23
-2%
0%
13
31
3.9
1
89
A+
63
Gittleman, Martin
$15.6M
$6.6M
42.1%
555496
-
Riverwood Healthcare Center
NH

Nursing Home Licensed facility providing 24/7 skilled nursing care for residents with complex, ongoing medical needs. Staffed by RNs, LPNs, and CNAs. Inspected and star-rated annually by CMS. Accepts Medicare (short-term rehab) and Medicaid (long-term care).

Stockton
-
90.5%
+7%
4.23
-2%
0%
13
31
3.9
1
89
-
-
Gittleman, Martin
$15.6M
$6.6M
42.1%
555496
Private / Semi-Private Rooms
Creekside Center
NH

Nursing Home Licensed facility providing 24/7 skilled nursing care for residents with complex, ongoing medical needs. Staffed by RNs, LPNs, and CNAs. Inspected and star-rated annually by CMS. Accepts Medicare (short-term rehab) and Medicaid (long-term care).

Stockton (Stonewood)
75
95.0%
+12%
3.99
-35%
-5%
0
41
2.4
0
72
-
65
-
$13.7M
$4.6M
33.7%
555387
-
Lincoln Square
HC

Home Care Professional care delivered in the person's own home — from companionship and errands to skilled nursing and therapy. Allows seniors to age in place. Medicare covers skilled home health when medically necessary.

NH

Nursing Home Licensed facility providing 24/7 skilled nursing care for residents with complex, ongoing medical needs. Staffed by RNs, LPNs, and CNAs. Inspected and star-rated annually by CMS. Accepts Medicare (short-term rehab) and Medicaid (long-term care).

Stockton (Civic Center)
68
87.2%
+3%
3.66
-4%
-13%
0
55
6.9
0
59
-
80
Ellis-Sherinian, Taylor
$15.8M
$5.6M
35.2%
555186
-
Lincoln Square Post-Acute Care
-
NH

Nursing Home Licensed facility providing 24/7 skilled nursing care for residents with complex, ongoing medical needs. Staffed by RNs, LPNs, and CNAs. Inspected and star-rated annually by CMS. Accepts Medicare (short-term rehab) and Medicaid (long-term care).

Stockton
-
-
-
-
-
-
-
-
-
0
0
0.0
0
-
-
-
-
-
-
-
-
-

Places of interest near Lincoln Square

Address 0.8 miles from city center — 0.04 miles to nearest hospital (Marcus W. Hudock, PA)
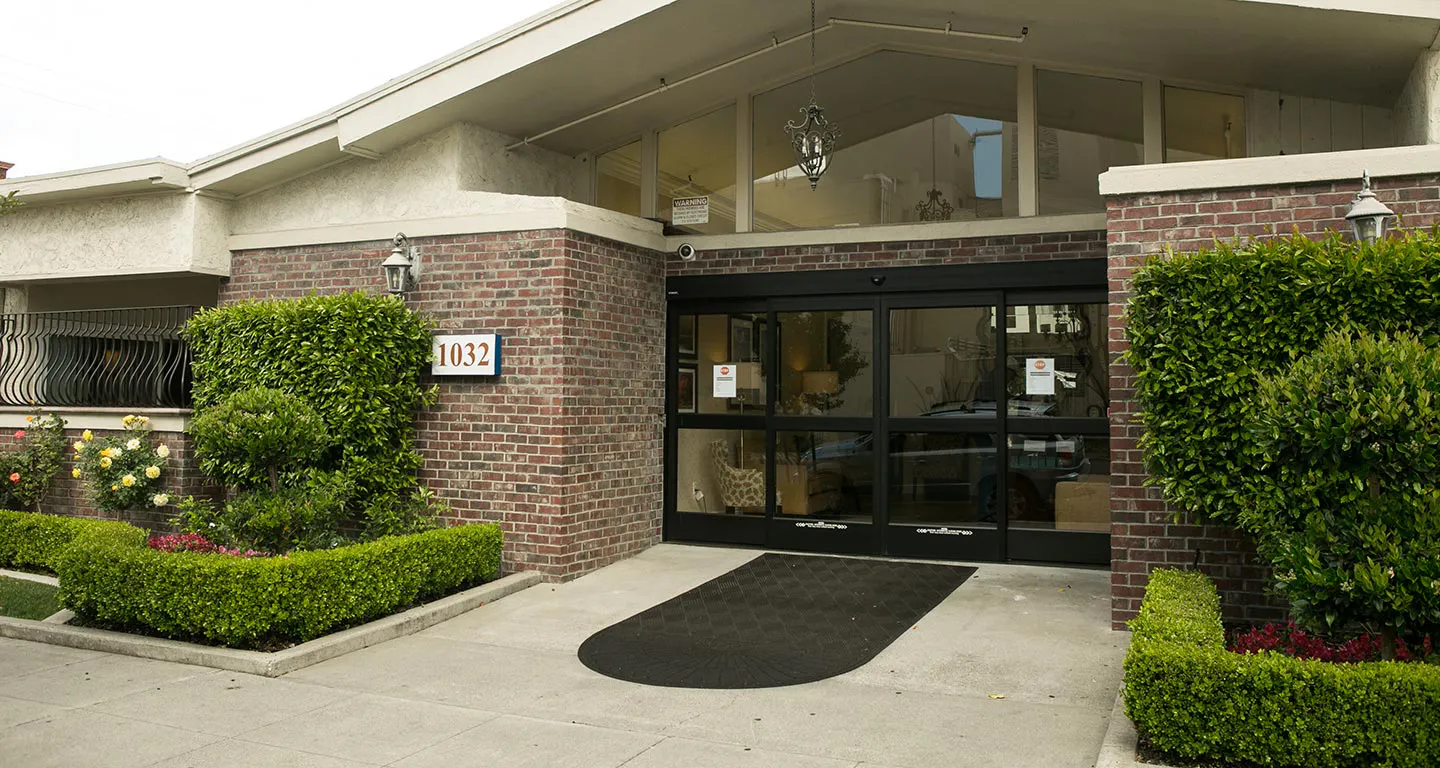
Address 1032 N Lincoln St, Stockton, CA 95203

Calculate Travel Distance to Lincoln Square

Add your location

Address

Staffing Data (Q2 2025)

This data corresponds to Q2 2025 and is based on CMS Payroll-Based Journal.

Total staff 73
Employees 73
Contractors 0
Staff to resident ratio 1.22:1
1216567% better than California average

California average ratio: 0.00:1

Avg staff/day 40
Average shift 7.5 hours
0% compared with California average

California average: 7.7 hours

Total staff hours (quarter) 27,211
Nursing staff breakdown
Registered Nurse

Manages medical care and health needs.

Total count 6
Average shift length Info Average shift length. Calculated as total hours divided by days worked and average staff per day. 7.3 hours

No contractors work on this role.

Licensed Practical Nurse

Assists with medical care and medications.

Total count 18
Average shift length Info Average shift length. Calculated as total hours divided by days worked and average staff per day. 7.4 hours

No contractors work on this role.

Certified Nursing Assistant

Helps with daily care and mobility.

Total count 24
Average shift length Info Average shift length. Calculated as total hours divided by days worked and average staff per day. 8 hours

No contractors work on this role.

Contractor staffing

Total hours from contractors

0%

0 contractor hours this quarter

No contractor roles were reported this quarter.

Staff by category
Certified Nursing Assistant2402412,26891100%8
Licensed Practical Nurse180186,44791100%7.4
Registered Nurse6061,4539099%7.3
RN Director of Nursing3031,3177785%7.7
Respiratory Therapy Technician4041,1247582%6.8
Occupational Therapy Aide4049818998%6.5
Dental Services Staff2029666571%7.9
Speech Language Pathologist4045745965%6.1
Clinical Nurse Specialist2025526369%8.3
Administrator1015206571%8
Nurse Practitioner1015206571%8
Therapeutic Recreation Specialist1013003943%7.7
Qualified Social Worker3031915763%2.7
24 Certified Nursing Assistant
% of Days 100%
18 Licensed Practical Nurse
% of Days 100%
6 Registered Nurse
% of Days 99%
3 RN Director of Nursing
% of Days 85%
4 Respiratory Therapy Technician
% of Days 82%
4 Occupational Therapy Aide
% of Days 98%
2 Dental Services Staff
% of Days 71%
4 Speech Language Pathologist
% of Days 65%
2 Clinical Nurse Specialist
% of Days 69%
1 Administrator
% of Days 71%
1 Nurse Practitioner
% of Days 71%
1 Therapeutic Recreation Specialist
% of Days 43%
3 Qualified Social Worker
% of Days 63%

Facility Characteristics

Source: CMS Long-Term Care Facility Characteristics (Data as of Jan 2026)

Total census
60 residents
Residents by payment source
Medicare
15 residents (25%)
Medicaid
33 residents (55%)
Private pay or other
12 residents (20%)
Programs & Services
Residents' Group

Residents meet regularly to discuss policies, care quality, and activities

Active Resident Council

Organized group of residents that meets regularly to discuss facility policies, quality of life, and activities.

Quality of care over time

These measures show how residents usually do over time at this home, based on health outcomes and preventive care.

High-risk clinical events score Info A composite score based on pressure ulcers, falls with injury, weight loss, walking ability decline, and activities of daily living decline. 5.6
15% better than California average

California average: 6.6

Functional decline score Info A composite score based on activities of daily living decline, walking ability decline, and incontinence. 6.4
44% better than California average

California average: 11.3

Long-stay resident measures
Significantly above average California avg: 4.3 Info CMS star rating based on long-stay quality measure performance. 5 stars = significantly above average, 1 star = significantly below average.
Need for Help with Daily Activities Increased Info Percent of long-stay residents whose need for help with daily activities has increased 6.2%
44% better than California average

California average: 11.1%

Walking Ability Worsened Info Percent of long-stay residents whose ability to move independently worsened 4.3%
64% better than California average

California average: 12.0%

Low Risk Residents with Bowel/Bladder Incontinence Info Percent of low risk long-stay residents who lose control of their bowels or bladder 8.7%
23% better than California average

California average: 11.3%

Falls with Major Injury Info Percent of long-stay residents experiencing one or more falls with major injury 7.0%
320% worse than California average

California average: 1.7%

High Risk Residents with Pressure Ulcers Info Percent of long-stay high risk residents with pressure ulcers 1.5%
70% better than California average

California average: 5.0%

Urinary Tract Infection Info Percent of long-stay residents with a urinary tract infection 0.0%
100% better than California average

California average: 1.2%

Lost Too Much Weight Info Percent of long-stay residents who lose too much weight 9.2%
118% worse than California average

California average: 4.2%

Depressive Symptoms Info Percent of long-stay residents who have depressive symptoms 0.0%
100% better than California average

California average: 6.7%

Antipsychotic Use Info Percent of long-stay residents who received an antipsychotic medication 0.0%
100% better than California average

California average: 10.1%

Pneumococcal Vaccine Info Percent of long-stay residents assessed and appropriately given the pneumococcal vaccine 100.0%
In line with California average

California average: 98.5%

Influenza Vaccine Info Percent of long-stay residents assessed and appropriately given the seasonal influenza vaccine 100.0%
In line with California average

California average: 98.2%

Hospitalizations per 1,000 days Info Number of hospitalizations per 1,000 long-stay resident days. 2.61
16% worse than California average

California average: 2.25

ED visits per 1,000 days Info Number of outpatient emergency department visits per 1,000 long-stay resident days. 1.70
7% worse than California average

California average: 1.59

Short-stay resident measures
Significantly above average California avg: 3.5 Info CMS star rating based on short-stay quality measure performance. 5 stars = much above average, 1 star = much below average.
Pneumococcal Vaccine Info Percent of short-stay residents assessed and appropriately given the pneumococcal vaccine 100.0%
6% better than California average

California average: 94.0%

Antipsychotic medication increase Info Percent of short-stay residents who newly received an antipsychotic medication 0.6%
60% better than California average

California average: 1.5%

Influenza Vaccine Info Percent of short-stay residents assessed and appropriately given the seasonal influenza vaccine 100.0%
7% better than California average

California average: 93.2%

Re-hospitalized after SNF stay Info Percentage of short-stay residents who were re-hospitalized after their nursing home admission. 20.9%
10% better than California average

California average: 23.2%

Emergency department visits Info Percentage of short-stay residents who had an outpatient emergency department visit. 11.7%
In line with California average

California average: 11.2%

Falls with major injury Info Percentage of SNF residents who experience falls with major injury during their stay. 1.1%
43% worse than California average

California average: 0.8%

Ability to care for self at discharge Info Percentage of residents at or above expected ability to care for themselves at discharge. 74.4%
38% better than California average

California average: 53.7%

Successful return to home or community Info Rate of successful return to home or community from a skilled nursing facility. 66.7%
32% better than California average

California average: 50.6%

Guides for Better Senior Living

Care Cost Calculator: See Prices in Your Area

Nursing Home Data Explorer

Don’t Wait Too Long: 7 Red Flag Signs Your Parent Needs Assisted Living Now

The True Cost of Assisted Living in 2025 – And How Families Are Paying For It

Understanding Senior Living Costs: Pricing Models, Discounts & Financial Assistance

Financial Aid for California Seniors

Get financial aid guidance

Multipurpose Senior Services Program

MSSP (Medi-Cal Waiver)

Age 65+, California resident, Medi-Cal eligible, nursing home risk.

~$2,829/month (300% FBR, individual).

$2,000 (individual), $3,000 (couple).

County-managed; waitlists possible.

In-Home Supportive Services (IHSS)

California IHSS

Age 65+, California resident, Medicaid-eligible or low-income.

~$1,732/month (individual, Medi-Cal threshold).

$2,000 (individual).

Can hire family as caregivers.

Multipurpose Senior Services Program (MSSP)

CA MSSP

Age 65+, California resident, Medi-Cal-eligible, nursing home-eligible but community-capable.

~$2,829/month (300% FBR, individual).

$2,000 (individual).

Available in 38 counties; waitlists common.

Property Tax Postponement Program (PTP)

CA PTP

Age 62+, California resident, own and live in home, 40% equity.

~$51,500/year (household, adjusted annually).

Equity-based; no strict asset cap.

Deferred taxes accrue interest (5% as of 2024); repaid upon sale/death.

Assisted Living Waiver (ALW)

CA ALW

Age 65+ or disabled, California resident, Medi-Cal-eligible, nursing home-eligible.

~$2,829/month (300% FBR, individual).

$2,000 (individual).

Available in 15 counties (e.g., LA, Sacramento); waitlists common.

California CARES Program

CA CARES

Caregivers of California residents 60+ needing help with 3+ daily activities; no caregiver age limit.

No strict limit; cost-sharing above ~$2,500/month threshold.

Not applicable; need-based.

High demand in urban areas; complements IHSS respite.

Low-Income Home Energy Assistance Program (LIHEAP)

CA LIHEAP

Age 60+ priority, California resident, low-income, utility/heating need.

~$2,510/month (200% of poverty level, individual).

Not applicable; income-focused.

High demand in inland/coastal extremes; weatherization capped at $5,000/home.

Tour Icon
Planning a tour? Check our touring checklist.
Chat Icon
Thinking of living here? We can help you speak to a current resident