Lone Star Rehabilitation and Wellness Center
Nursing Home · Stephenville, TX
CMS overall rating Info The Overall CMS Rating is scored from 1 to 5 stars and combines results from health inspections, staffing levels, and quality measures. Health inspections carry the most weight. Staffing and quality scores can increase or decrease the final rating based on performance compared to state and national standards.

Lone Star Rehabilitation and Wellness Center

Nursing Home · Stephenville, TX
CMS overall rating Info The Overall CMS Rating is scored from 1 to 5 stars and combines results from health inspections, staffing levels, and quality measures. Health inspections carry the most weight. Staffing and quality scores can increase or decrease the final rating based on performance compared to state and national standards.
Calculator: See prices in your area
Lone Star Rehabilitation and Wellness Center accepts Medicare, Medicaid, and private pay.

Overview of Lone Star Rehabilitation and Wellness Center

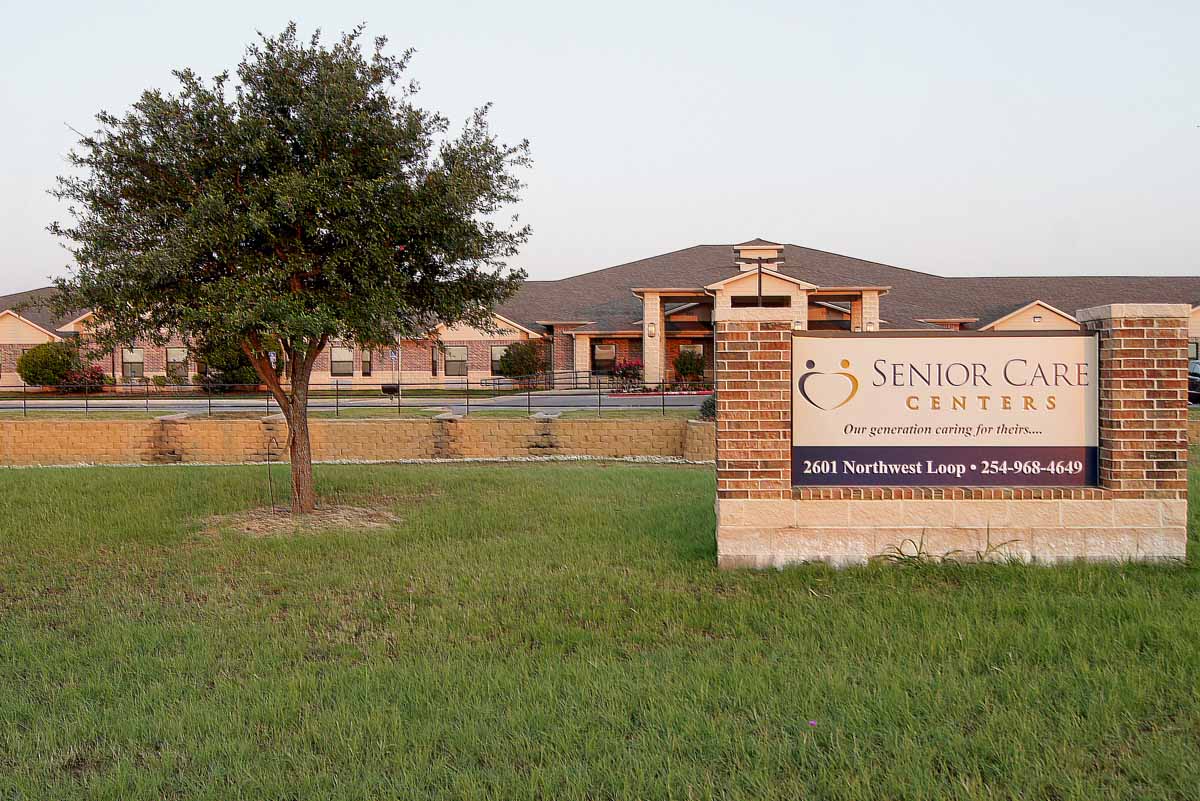
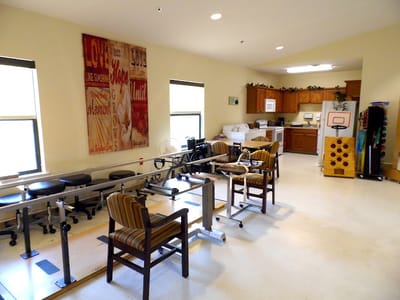
Discover a comfortable recovery environment at Lone Star Rehabilitation and Wellness Center, a respected senior care provider in Stephenville, TX, offering skilled nursing, rehabilitation, and long-term care. The community features a team of reliable caregivers who work seamlessly together to provide residents with personalized care services that best aligns with their care preferences and goals. Residents here enjoy access to an array of therapy services, including physical, occupational, respiratory, and speech rehabilitation to make sure they have the right tools to regain or preserve their strength and functionality.

Dedicated to helping residents return home safely as quickly as possible and regain, the community features a team of physicians, nurses, social workers, and therapists who work together to provide every service residents need. With its excellent commitment to quality care and services, the community makes sure they only hire the most competent and compassionate care experts who identify with their mission of delivering nothing but the best in care.

(254) 968-4649

Quality ratings

Measured by Centers for Medicare & Medicaid Services (CMS)

Overall rating Info The Overall CMS Rating combines results from health inspections, staffing levels and quality measures. Health inspections carry the most weight. Staffing and quality scores can increase or decrease the final rating based on performance compared to state and national standards.
▲ 43.1% Above TX avg. ▲ 43.1% Above TX avg.Click the badge to see the full State ranking.Click here to see the full State ranking.
Health Inspection Info Based on the results of the facility's three most recent standard inspections and any complaint investigations. CMS reviews the number, scope, and severity of deficiencies, with more recent findings weighted more heavily.
▲ 44.7% Above TX avg. ▲ 44.7% Above TX avg.Click the badge to see the full State ranking.Click here to see the full State ranking.
Staffing Info Measures average nursing staff hours per resident per day, including Registered Nurses (RNs) and total nursing staff. Ratings are adjusted based on the level of care residents require and are compared to state and national benchmarks.
▲ 41.4% Above TX avg. ▲ 41.4% Above TX avg.Click the badge to see the full State ranking.Click here to see the full State ranking.
Quality Measures Info Based on clinical and physical health indicators reported to CMS, such as hospital readmissions, falls, pressure ulcers, and improvements in mobility. These measures reflect how well residents' health needs are being managed.
▼ 20.1% Below TX avg. ▼ 20.1% Below TX avg.Click the badge to see the full State ranking.Click here to see the full State ranking.

Staffing hours breakdown

Info Daily nursing hours per resident by staff type, reported to CMS. Higher is generally better — compare this facility to state and national averages to see where staffing stands.

Hours per resident per day — compared to Texas state averages

Total nursing care / resident Info This home is ranked 167th out of 289 homes in Texas. Total adjusted nursing hours per resident per day, combining RN, LPN, and aide time. CMS adjusts this for case-mix so facilities can be fairly compared.
3h 21m per day
Rank #167 / 289Nurse hours — State benchmarkedThis home is ranked 167th out of 289 homes in Texas. Shows adjusted nurse hours per resident per day benchmarked to the Texas average, with a ranking across 289 Texas SNFs. More hours mean more direct care. The national average is about 3.5 hrs; below 3.0 is a red flag.Click the rank badge to see the full State ranking.Click here to see the full State ranking.
This facility Texas avg (3h 38m per day)
vs Texas avg
-8%

3 of 6 metrics below state avg

Standout metric Registered Nurse (RN) is +46% above state avg
Staff typeHours / Day / Residentvs state avg
Registered Nurse (RN) Info RNs hold the highest nursing license and can assess residents, interpret test results, and direct care plans. More RN hours per day often signals stronger clinical oversight and faster response to health changes. 38m per day ▲ 46% State avg: 26m per day · National avg: 41m per day
LPN / LVN Info Licensed Practical Nurses (LPNs) or Licensed Vocational Nurses (LVNs) deliver routine hands-on care — medication administration, wound dressing, and monitoring vital signs. They work under RN supervision and make up a large share of daily bedside care. 52m per day ▼ 9% State avg: 57m per day · National avg: 52m per day
Nurse Aide Info Certified Nurse Aides (CNAs) provide the most direct day-to-day assistance: bathing, dressing, feeding, and mobility. Nurse aide hours are typically the largest staffing category and directly affect residents' quality of life. 1h 35m per day ▼ 21% State avg: 2h 1m per day · National avg: 2h 21m per day
Total Nursing (Weekend) Info Combined nursing hours (RN + LPN + Nurse Aide) per resident per day on weekends. Staffing often drops on weekends — this figure reveals whether the facility maintains adequate coverage outside of weekday hours. 2h 43m per day ▼ 9% State avg: 2h 59m per day · National avg: 3h 26m per day
Physical Therapist Info Hours per resident per day provided by licensed Physical Therapists (PTs) or PT Assistants. PT services help residents recover mobility after injury or illness and are especially important for post-acute (short-stay) rehabilitation. 4m per day ■ Avg State avg: 4m per day · National avg: 4m per day
RN (Weekend) Info Registered nurse hours specifically on weekends. Facilities sometimes reduce RN presence on Saturdays and Sundays — a low weekend RN figure compared to weekday hours can indicate reduced clinical oversight when most administrative staff are absent. 27m per day ▲ 29% State avg: 21m per day · National avg: 29m per day

Types of Care at Lone Star Rehabilitation and Wellness Center

Nursing Home

Capacity and availability

This home usually has availability

Occupancy lower than 85% suggests more openings may be available.

Higher occupancy than the Texas average: 63.5%
Occupancy rate 67.9% Rank #140 / 297Occupancy rate — State benchmarkedThis home is ranked 140th out of 297 homes in Texas. Shows this facility's occupancy rate versus the Texas average, with its Statewide rank out of 297. Higher occupancy signals strong local demand and financial stability.Click the rank badge to see the full State ranking.Click here to see the full State ranking.
Avg. Length of Stay 105 days
Occupancy rate
67.9% Rank #140 / 297Occupancy rate — State benchmarkedThis home is ranked 140th out of 297 homes in Texas. Shows this facility's occupancy rate versus the Texas average, with its Statewide rank out of 297. Higher occupancy signals strong local demand and financial stability.Click the rank badge to see the full State ranking.Click here to see the full State ranking.
Avg. Length of Stay
105 days
Walk Score
Walk Score: 16 / 100 Rank #264 / 300Walk Score — State benchmarkedThis home is ranked 264th out of 300 homes in Texas. Shows how walkable this facility's neighborhood is compared to the average Walk Score across Texas SNFs. Higher scores benefit residents, families, and staff.Click the rank badge to see the full State ranking.Click here to see the full State ranking.
Car-dependent. Most errands require a car, with limited nearby walkable options.

About this community

Therapy & Rehabilitation

1 service
Rehabilitation Services

Contact Lone Star Rehabilitation and Wellness Center

Staffing Data

Reporting period: October 1 – December 31, 2025 (Q4 2025). Source: CMS Payroll-Based Journal report.

Total staff 97
Employees 79
Contractors 18
Staff to resident ratio 0.95:1
37% worse than Texas average
Texas average ratio: 1.51:1 Texas average ratio: 1.51:1See full Texas ranking
Avg staff/day 37
Average shift 8 hours
0% compared with Texas average
Texas average: 8.1 hours Texas average shift: 8.1 hoursSee full Texas ranking
Total staff hours (quarter) 27,106

Nursing staff breakdown

Q4 2025 · Oct 1 – Dec 31 More info This data comes from the CMS Payroll-Based Journal report covering October 1 – December 31, 2025.
Registered Nurse

Manages medical care and health needs.

Total count 15
Average shift length Info Average shift length. Calculated as total hours divided by days worked and average staff per day. 8.4 hours

No contractors work on this role.

Licensed Practical Nurse

Assists with medical care and medications.

Total count 22
Average shift length Info Average shift length. Calculated as total hours divided by days worked and average staff per day. 8.4 hours

No contractors work on this role.

Certified Nursing Assistant

Helps with daily care and mobility.

Total count 35
Average shift length Info Average shift length. Calculated as total hours divided by days worked and average staff per day. 8.5 hours

No contractors work on this role.

Contractor staffing

Q4 2025 · Oct 1 – Dec 31 More info This data comes from the CMS Payroll-Based Journal report covering October 1 – December 31, 2025.

Total hours from contractors

10.4%

2,830 contractor hours this quarter

Physical Therapy Aide: 4 Qualified Social Worker: 3 Speech Language Pathologist: 3 Physical Therapy Assistant: 3 Respiratory Therapy Technician: 3 Medical Director: 1 Occupational Therapy Aide: 1

Staff by category

Q4 2025 · Oct 1 – Dec 31 More info This data comes from the CMS Payroll-Based Journal report covering October 1 – December 31, 2025.
Certified Nursing Assistant3503510,13392100%8.5
Licensed Practical Nurse220226,93192100%8.4
Registered Nurse150154,47992100%8.4
Medication Aide/Technician2028518289%10
Physical Therapy Aide0448057076%6
Physical Therapy Assistant0336166571%5.9
Respiratory Therapy Technician0336157784%5.2
Dietitian1014906166%8
Speech Language Pathologist0334845762%8.5
Nurse Practitioner1014586166%7.5
Mental Health Service Worker1014506065%7.5
Administrator1014435964%7.5
Qualified Social Worker0331825964%2
Occupational Therapy Aide011981314%7.5
Other Dietary Services Staff1014355%8.6
Medical Director011301213%2.5
35 Certified Nursing Assistant
% of Days 100%
22 Licensed Practical Nurse
% of Days 100%
15 Registered Nurse
% of Days 100%
2 Medication Aide/Technician
% of Days 89%
4 Physical Therapy Aide
% of Days 76%
3 Physical Therapy Assistant
% of Days 71%
3 Respiratory Therapy Technician
% of Days 84%
1 Dietitian
% of Days 66%
3 Speech Language Pathologist
% of Days 62%
1 Nurse Practitioner
% of Days 66%
1 Mental Health Service Worker
% of Days 65%
1 Administrator
% of Days 64%
3 Qualified Social Worker
% of Days 64%
1 Occupational Therapy Aide
% of Days 14%
1 Other Dietary Services Staff
% of Days 5%
1 Medical Director
% of Days 13%

Penalties and fines

Federal penalties imposed by CMS for regulatory violations, including civil money penalties (fines) and denials of payment for new Medicare/Medicaid admissions.

Source: CMS Penalties Database

No penalties in the past 3 years

No civil money penalties or payment denials were reported in the last 3 years.

Quality of care over time

These measures show how residents usually do over time at this home, based on health outcomes and preventive care.

High-risk clinical events score Info A composite score based on pressure ulcers, falls with injury, weight loss, walking ability decline, and activities of daily living decline. 5.9
32% better than Texas average

Texas average: 8.6

Functional decline score Info A composite score based on activities of daily living decline, walking ability decline, and incontinence. 9.7
39% better than Texas average

Texas average: 16.0

Long-stay resident measures
Significantly above average Texas avg: 4.1 Info CMS star rating based on long-stay quality measure performance. 5 stars = significantly above average, 1 star = significantly below average.
Need for Help with Daily Activities Increased Info Percent of long-stay residents whose need for help with daily activities has increased 9.9%
39% better than Texas average

Texas average: 16.2%

Walking Ability Worsened Info Percent of long-stay residents whose ability to move independently worsened 9.0%
44% better than Texas average

Texas average: 16.2%

Low Risk Residents with Bowel/Bladder Incontinence Info Percent of low risk long-stay residents who lose control of their bowels or bladder 10.3%
34% better than Texas average

Texas average: 15.7%

Falls with Major Injury Info Percent of long-stay residents experiencing one or more falls with major injury 4.9%
52% worse than Texas average

Texas average: 3.2%

High Risk Residents with Pressure Ulcers Info Percent of long-stay high risk residents with pressure ulcers 3.1%
30% better than Texas average

Texas average: 4.4%

Urinary Tract Infection Info Percent of long-stay residents with a urinary tract infection 0.0%
100% better than Texas average

Texas average: 0.8%

Lost Too Much Weight Info Percent of long-stay residents who lose too much weight 2.4%
31% better than Texas average

Texas average: 3.5%

Depressive Symptoms Info Percent of long-stay residents who have depressive symptoms 5.6%
97% worse than Texas average

Texas average: 2.9%

Antipsychotic Use Info Percent of long-stay residents who received an antipsychotic medication 10.4%
31% worse than Texas average

Texas average: 7.9%

Pneumococcal Vaccine Info Percent of long-stay residents assessed and appropriately given the pneumococcal vaccine 98.3%
In line with Texas average

Texas average: 97.3%

Influenza Vaccine Info Percent of long-stay residents assessed and appropriately given the seasonal influenza vaccine 97.5%
In line with Texas average

Texas average: 97.9%

Hospitalizations per 1,000 days Info Number of hospitalizations per 1,000 long-stay resident days. 1.36
36% better than Texas average

Texas average: 2.13

ED visits per 1,000 days Info Number of outpatient emergency department visits per 1,000 long-stay resident days. 1.85
11% better than Texas average

Texas average: 2.07

Short-stay resident measures
Below average Texas avg: 3.1 Info CMS star rating based on short-stay quality measure performance. 5 stars = much above average, 1 star = much below average.
Pneumococcal Vaccine Info Percent of short-stay residents assessed and appropriately given the pneumococcal vaccine 92.3%
In line with Texas average

Texas average: 90.4%

Antipsychotic medication increase Info Percent of short-stay residents who newly received an antipsychotic medication 1.7%
17% worse than Texas average

Texas average: 1.4%

Influenza Vaccine Info Percent of short-stay residents assessed and appropriately given the seasonal influenza vaccine 88.5%
In line with Texas average

Texas average: 88.0%

Re-hospitalized after SNF stay Info Percentage of short-stay residents who were re-hospitalized after their nursing home admission. 31.8%
23% worse than Texas average

Texas average: 25.9%

Emergency department visits Info Percentage of short-stay residents who had an outpatient emergency department visit. 25.0%
108% worse than Texas average

Texas average: 12.0%

Falls with major injury Info Percentage of SNF residents who experience falls with major injury during their stay. 2.5%
222% worse than Texas average

Texas average: 0.8%

Ability to care for self at discharge Info Percentage of residents at or above expected ability to care for themselves at discharge. 62.0%
15% better than Texas average

Texas average: 53.7%

Successful return to home or community Info Rate of successful return to home or community from a skilled nursing facility. 56.9%
13% better than Texas average

Texas average: 50.6%

Breakdown by payment type

Medicare

35% of new residents, usually for short-term rehab.

Typical stay 28 days

Private pay

54% of new residents, often for short stays.

Typical stay 1 - 2 months

Medicaid

11% of new residents, often for long-term daily care.

Typical stay 1 years

Facility Characteristics

Source: CMS Long-Term Care Facility Characteristics (Data as of Jan 2026)

Total residents 102
Medicare
12
11.8% of residents
Medicaid
39
38.2% of residents
Private pay or other
51
50% of residents
Programs & Services
Residents Group

Residents meet regularly to discuss policies, care quality, and activities

Nurse Aide Training

State-approved Nurse Aide Training and Competency Evaluation Program on-site

Active Resident Council

Organized group of residents that meets regularly to discuss facility policies, quality of life, and activities.

Finances and operations

Governmental community
Operated by state authorities.
Home revenue
$10.7M
Operating deficit
-$344.8K
Governmental community Operated by state authorities.
Home revenue
$10.7M Rank #153 / 297Revenue — State benchmarkedThis home is ranked 153rd out of 297 homes in Texas. Shows this facility's annual revenue compared to the Texas SNF average. Higher revenue generally means more resources for staffing and capital — read alongside Payroll %.Click the rank badge to see the full State ranking.Click here to see the full State ranking.
Operating deficit
-$344.8K
Payroll costs Info The portion of the home's budget spent on staff, including nurses, caregivers, and other employees who support care and operations. Rank #209 / 297Payroll — State benchmarkedThis home is ranked 209th out of 297 homes in Texas. Shows total annual staff payroll benchmarked to the Texas average. Higher payroll investment relative to peers often signals better staffing and less reliance on cheaper contract labor.Click the rank badge to see the full State ranking.Click here to see the full State ranking.
$4.2M
39% of revenue Rank #237 / 297Payroll % — State benchmarkedThis home is ranked 237th out of 297 homes in Texas. Shows payroll as a percentage of revenue versus the Texas average. Well-run Texas SNFs typically land around 51–63% — the top third Statewide. Below 25% may signal understaffing or heavy agency use — read with Staffing ratings.Click the rank badge to see the full State ranking.Click here to see the full State ranking.
Other operating costs Info All remaining costs needed to run the home, such as food, utilities, building maintenance, supplies and administrative expenses.
$6.9M
Total costs $11.1M

What does this home offer?

Building type icon
Building type icon

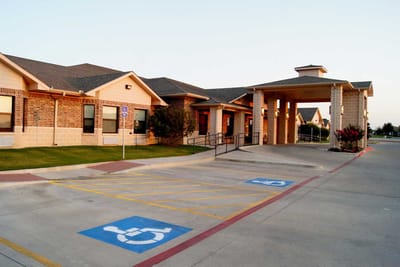
Building Type: Single-story

Who this home usually serves

TYPE OF STAY

Mix of rehab and long-term care

This home supports both short-term rehab and long-term care, with residents staying for a wide range of durations.

Places of interest near Lone Star Rehabilitation and Wellness Center

Address 3.2 miles from city center Info Estimated distance in miles from Stephenville's city center to Lone Star Rehabilitation and Wellness Center's address, calculated via Google Maps.

Calculate Travel Distance to Lone Star Rehabilitation and Wellness Center

Add your location

Address

Financial Assistance for
Nursing Home in Texas

Lone Star Rehabilitation and Wellness Center is located in Stephenville, Texas.
Here are the financial assistance programs available to residents in Texas.

Get Financial aid guidance

Community Care for the Aged and Disabled (CCAD)

TX Medicaid CCAD

Age 65+ or disabled
General Texas resident, Medicaid-eligible, care need (not always nursing home level).
Income Limits (2025) ~$2,829/month 300% FBR, individual
Asset Limits $2,000 (individual), $3,000 (couple).
TX

Large state; rural access challenges.

Benefits
Personal care (5-7 hours/day) Respite (240 hours/year) Adult day care (~$60/day) Home aides

Texas Community Care Services

TX CCS

Age 60+
General Texas resident, at risk of decline.
Income Limits ~$2,000/month individual, varies
Asset Limits $5,000 individual
TX

Limited funding; high demand in urban areas.

Benefits
In-home care (3-5 hours/week) Respite (up to 10 days/year) Transportation (~5 trips/month)

Area Agency on Aging (AAA) Services

Texas AAA Services

Age 60+
General TX resident; no income/asset limits.
Income Limits (2025) None; donations encouraged.
Asset Limits Not assessed.
TX

28 AAAs; includes Meals on Wheels in some areas.

Benefits
Meals (~$5-$7/meal) Transportation Homemaker services (~4 hours/week) Respite (~5 days/year) Legal aid

Medicare Savings Program (MSP)

Texas Medicare Savings Program

Age 65+ or disabled
General TX resident, Medicare Part A/B.
Income Limits (2025) ~$2,510/month (QMB), ~$3,380/month (SLMB), ~$3,598/month (QI)—individual.
Asset Limits $9,430 (individual), $14,130 (couple).
TX

Includes Extra Help for Part D; no waitlist.

Benefits
Covers Part B premiums ($174.70/month) Deductibles ($240/year) Copays (~20%)

Family Caregiver Support Program (FCSP)

Texas Family Caregiver Support Program

Age
General Caregivers of 60+ needing care or 55+ caregivers of others; TX resident; 2+ ADLs.
Income Limits (2025) No strict cap; prioritizes low-income ~$24,980/year
Asset Limits Not assessed.
TX

High rural demand; includes grandparent caregivers.

Benefits
Respite (4-6 hours/week or 5 days/year) Adult day care ($60/day) Training Supplies (~$500/year)

VA Aid and Attendance (A&A) and Housebound Benefits

Texas VA Aid and Attendance/Housebound

Age 65+ or disabled veteran/spouse
General TX resident, wartime service, ADL help (A&A) or homebound.
Income Limits (2025) Net income < ~$1,984/month (veteran with dependent, A&A); pension offsets income.
Asset Limits ~$155,356 net worth
TX

High veteran population; supports rural/urban needs.

Benefits
Cash (~$1,433-$2,642/month veteran, ~$951-$1,318 spouse) for care costs

Property Tax Exemption for Seniors

Texas Senior Property Tax Exemption

Age 65+
General TX resident, homeowner (homestead).
Income Limits (2025) None; tax-based eligibility.
Asset Limits Not assessed.
TX

$25,000+ exemption; optional freeze in some counties; saves ~$500-$1,000/year.

Benefits
Tax exemption or freeze (~$500-$1,000/year savings)

Senior Farmers’ Market Nutrition Program (SFMNP)

Texas SFMNP

Age 60+
General TX resident, low-income.
Income Limits (2025) ~$2,322/month 185% FPL
Asset Limits Not assessed.
TX

Vouchers (~$50/season); serves ~20,000 via 28 AAAs.

Benefits
Vouchers (~$50/season) for produce at farmers’ markets

Compare Nursing Home around Stephenville

The information below is reported by the Texas Health and Human Services Commission.

2 facilities compared · CMS & TX Dept. of Health data

Filter by care type
Lone Star Rehabilitation and Wellness Center
NH

Nursing Home Licensed facility providing 24/7 skilled nursing care for residents with complex, ongoing medical needs. Staffed by RNs, LPNs, and CNAs. Inspected and star-rated annually by CMS. Accepts Medicare (short-term rehab) and Medicaid (long-term care).

AL

Assisted Living A licensed, long-term care setting for seniors or individuals with disabilities who need help with daily activities — like bathing, dressing, and medication management — but not 24-hour skilled nursing. Offers housing, meals, and around-the-clock support while aiming to maximize resident independence.

IL

Independent Living Lifestyle-focused communities for older adults offering dining, activities, and transportation with minimal personal care. Best for active, independent seniors who want community without medical support.

MC

Memory Care Secured, specialized care for people living with Alzheimer's or dementia. Staff trained in cognitive impairment, with higher staff-to-resident ratios and an environment designed to reduce confusion and wandering risk.

Stephenville122 67.9% +7%3.35 +107%-8%$0133.3-85 16 Hmg Park Manor Of Stephenville, LLC$10.7M$4.2M39%455906
Mulberry Manor
NH

Nursing Home Licensed facility providing 24/7 skilled nursing care for residents with complex, ongoing medical needs. Staffed by RNs, LPNs, and CNAs. Inspected and star-rated annually by CMS. Accepts Medicare (short-term rehab) and Medicaid (long-term care).

AL

Assisted Living A licensed, long-term care setting for seniors or individuals with disabilities who need help with daily activities — like bathing, dressing, and medication management — but not 24-hour skilled nursing. Offers housing, meals, and around-the-clock support while aiming to maximize resident independence.

IL

Independent Living Lifestyle-focused communities for older adults offering dining, activities, and transportation with minimal personal care. Best for active, independent seniors who want community without medical support.

MC

Memory Care Secured, specialized care for people living with Alzheimer's or dementia. Staff trained in cognitive impairment, with higher staff-to-resident ratios and an environment designed to reduce confusion and wandering risk.

Stephenville102 73.7% +16%3.86 -45%+6%$204.6k304.3266 37 Stephenville Nursing Operations, LLC$8.2M$2.7M33%455744

Frequently Asked Questions about Lone Star Rehabilitation and Wellness Center

Is Lone Star Rehabilitation and Wellness Center in a walkable area?

Lone Star Rehabilitation and Wellness Center has a walk score of 16. Car-dependent. Most errands require a car, with limited nearby walkable options.

Are there photos of Lone Star Rehabilitation and Wellness Center?

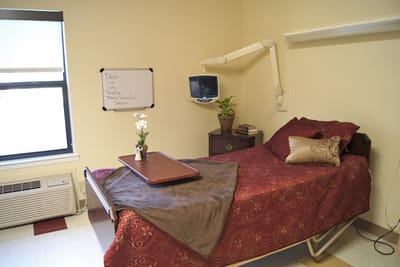
Yes — there are 5 photos of Lone Star Rehabilitation and Wellness Center in the photo gallery on this page.

What is the address of Lone Star Rehabilitation and Wellness Center?

Lone Star Rehabilitation and Wellness Center is located at 2601 Northwest Loop, Stephenville, TX 76401, United States.

What is the phone number of Lone Star Rehabilitation and Wellness Center?

(254) 968-4649 will put you in contact with the team at Lone Star Rehabilitation and Wellness Center.

Is Lone Star Rehabilitation and Wellness Center Medicare or Medicaid certified?

Yes — Lone Star Rehabilitation and Wellness Center is a CMS-certified provider of Medicare and Medicaid.

Guides for Better Senior Living

Care Cost Calculator: See Prices in Your Area

Nursing Home Data Explorer

Don’t Wait Too Long: 7 Red Flag Signs Your Parent Needs Assisted Living Now

The True Cost of Assisted Living in 2025 – And How Families Are Paying For It

Understanding Senior Living Costs: Pricing Models, Discounts & Financial Assistance

Explore Open Rooms
1 Contact details
2 What type of senior care service are you looking for?
3 What budget do you have in mind for senior care?
4 How soon do you need to find care?
5 Additional details

Thank you for your interest!

Our team will be in touch shortly to help with next steps.