Explore Open Rooms

1 Contact details
2 What type of senior care service are you looking for?
3 What budget do you have in mind for senior care?
4 How soon do you need to find care?
5 Additional details

Thank you for your interest!

Our team will be in touch shortly to help with next steps.

Nursing Home

Lutheran Home Of Southbury Inc

Nursing Home

Lutheran Home Of Southbury Inc

990 Main St N, Southbury, CT 06488 View map
Overview of Lutheran Home of Southbury INC

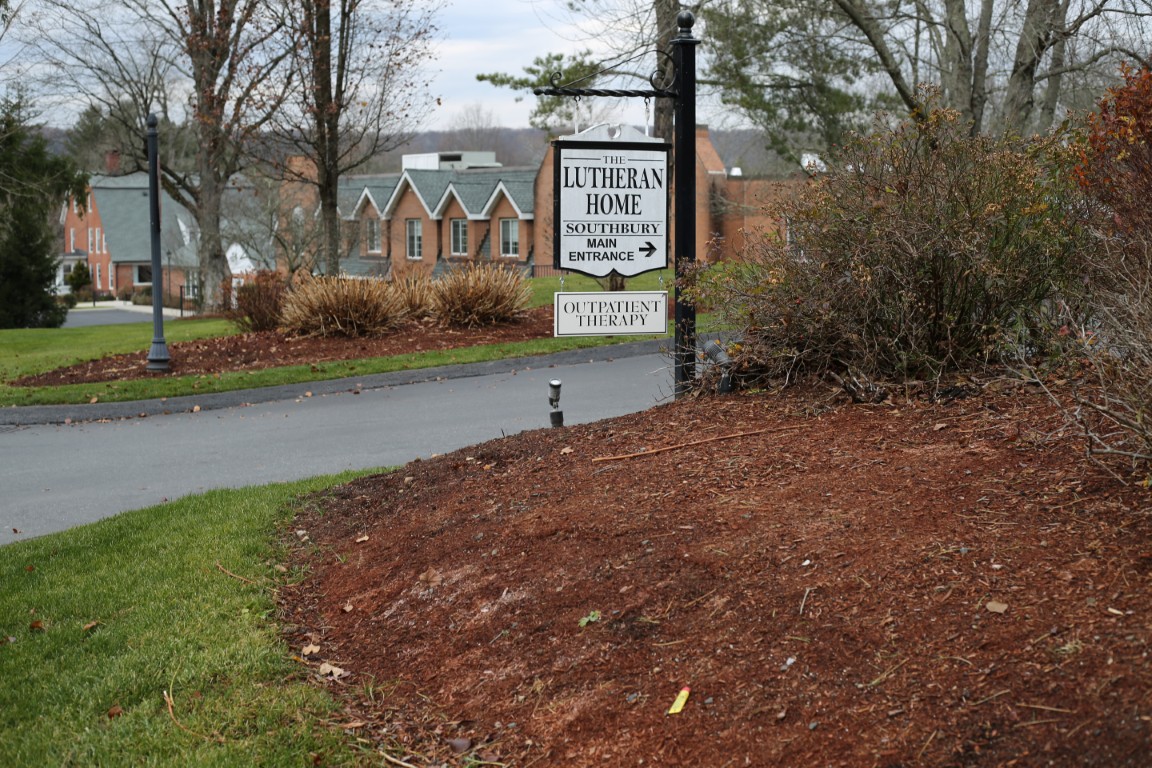
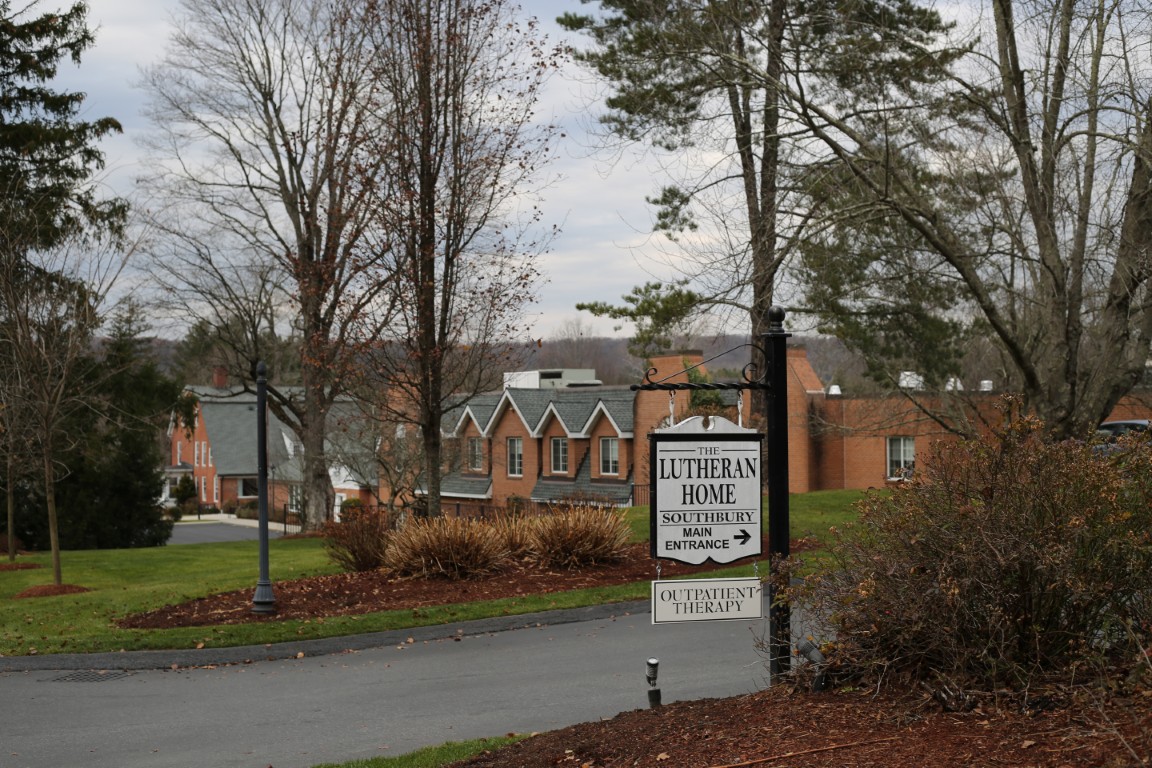
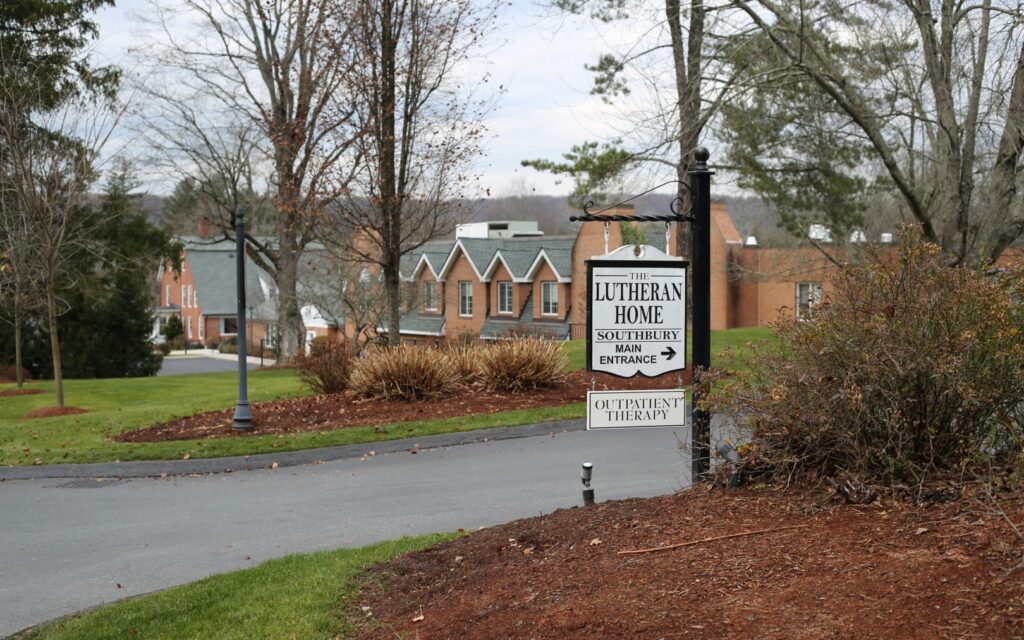
Lutheran Home of Southbury Inc. is a trusted nursing home in Southbury, CT, that offers rehabilitation and skilled nursing. The community promotes a nurturing and welcoming environment, ensuring older adults can feel at ease during their stay. 24-hour care, therapy services, and nutritious meals are among the exceptional services provided to improve residents’ living experiences. With its wellness-centered approach, the community doubles its efforts to meet residents’ healthcare needs to help them recover and return to their routines with ease.

Here, residents have more opportunities to try new interests and maintain social connections, through a variety of activities and exercise programs. Cozy living spaces and state-of-the-art rehabilitation amenities are also provided to ensure residents’ healing and relaxation. Surrounded by lush trees and local amenities, the community guarantees a laid-back retirement. This nursing home is one of the finest options for senior living in Connecticut, as it has a wide range of care options and dedicated services.

(203) 264-9135

Quality ratings

Measured by Centers for Medicare & Medicaid Services (CMS)

Overall rating Info The Overall CMS Rating combines results from health inspections, staffing levels and quality measures. Health inspections carry the most weight. Staffing and quality scores can increase or decrease the final rating based on performance compared to state and national standards.
4/5
Connecticut average: 3.4/5
Health Inspection Info Based on the results of the facility's three most recent standard inspections and any complaint investigations. CMS reviews the number, scope, and severity of deficiencies, with more recent findings weighted more heavily.
4/5
Connecticut average: 3.1/5
Staffing Info Measures average nursing staff hours per resident per day, including Registered Nurses (RNs) and total nursing staff. Ratings are adjusted based on the level of care residents require and are compared to state and national benchmarks.
4/5
Connecticut average: 3.4/5
Quality Measures Info Based on clinical and physical health indicators reported to CMS, such as hospital readmissions, falls, pressure ulcers, and improvements in mobility. These measures reflect how well residents' health needs are being managed.
4/5
Connecticut average: 3.6/5

Nursing care per resident

Info This shows how many total hours of nursing staff time are available per resident each day. Higher numbers usually mean more staff support.
4h 48m per day

This home provides 18% more nursing time per resident than the Connecticut average.

Connecticut average: 4h 4m per day

Staffing hours breakdown

Info Hours of care per resident per day, broken down by staff type. Data from CMS Medicare.
Staff type Facility State avg National avg
Registered Nurse (RN) Info Registered nurse hours per resident per day. 42m per day 42m per day 41m per day
Nurse Aide Info Nurse aide hours per resident per day. 2h 29m per day 2h 17m per day 2h 21m per day
Total Nursing (Weekend) Info Total number of nurse staff hours per resident per day on weekends. 3h 31m per day 3h 25m per day 3h 26m per day
Physical Therapist Info Physical therapist staff hours per resident per day. 6m per day 5m per day 4m per day
RN (Weekend) Info Registered nurse hours per resident per day on weekends. 14m per day 28m per day 29m per day

Capacity and availability

Medium-capacity home

Offers a balance of services and community atmosphere.

Total beds 134

This home usually has limited availability

Occupancy is moderate, suggesting balanced demand.

Similar demand to the Connecticut average
Occupancy rate 88.8%
Residents per day (avg) 110
Occupancy rate
88.8%
Residents per day (avg)
110

Who this home usually serves

TYPE OF STAY

Mostly short-term rehab stays

Most residents typically stay for a few weeks or months before returning home or moving on.

Might be optimal for
Short stays Recovery Medicare-covered care

Breakdown by payment type

Medicare

55% of new residents, usually for short-term rehab.

Typical stay 1 - 2 months

Private pay

43% of new residents, often for short stays.

Typical stay 4 - 5 months

Medicaid

2% of new residents, often for long-term daily care.

Typical stay 14 - 15 years

Finances and operations

Voluntary non-profit community
Home revenue
$23.0M
Operating deficit
-$1.2M
Voluntary non-profit community
Home revenue
$23,001,785.00
Operating deficit
$-1,151,088.00
Payroll costs Info The portion of the home's budget spent on staff, including nurses, caregivers, and other employees who support care and operations.
$9.2M
39.8% of revenue
Other operating costs Info All remaining costs needed to run the home, such as food, utilities, building maintenance, supplies and administrative expenses.
$15.0M
Total costs $24.2M
Years in operation
18 years in operation
A longer operating history, which may indicate experience navigating regulations and delivering ongoing care.
Walk Score
Walk Score: 3 / 100
Car-dependent. Most errands require a car, with limited nearby walkable options.

Services

Dementia Care
Hospice
Recreation
Rehabilitation Therapy
Respite Care

About this community

Occupancy

Occupancy rate
99%
In line with Connecticut average
Occupied beds
119 / 120
Average residents 102 per day

License details

Facility type
Residential Care Facility
Status Active
Issuance January 7, 2008
Expiration June 30, 2026

Additional licensing details

License number: 1360RC

Staffing

Key information about the people who lead and staff this community.

Languages Spoken

Albanian Arabic Filipino Greek Haitian Lebanese Polish Portuguese Spanish Ukrainian

Staff Composition (State Data)

Admin
3 FTE
Registered Nurse
14 FTE
Licensed Practical Nurse
19 FTE
Nursing Assistant
54 FTE
Recreation
5 FTE
Social Services
2 FTE
Food Service Supervisor
1 FTE
Physical Therapy
3 FTE
Occupational Therapy
3 FTE
Speech Therapy
1 FTE
Dietary
11 FTE
Other Staff
10 FTE

Additional Policies & Features

Religious Affiliation: Lutheran
Religious Services: Catholic, Chaplain Service, Lutheran

What does this home offer?

Building type icon
Building type icon

Building Type: Single-story

Dining services icon

Dining Services

Social and recreational activities icon

Social and Recreational Activities

On-site medical care and health services icon

On-site Medical Care and Health Services

Types of Care at Lutheran Home Of Southbury Inc

Nursing Home
Contact Lutheran Home Of Southbury Inc

Inspection History

In Connecticut, the Department of Public Health, Facility Licensing and Investigations Section conducts mandatory inspections and unannounced surveys to monitor the quality of care in long-term facilities.

11 visits/inspections

1 visits/inspections triggered by complaints

9 routine inspections

Breakdown by inspection type
  • 1 licensing inspection
  • 1 complaint investigation
  • 7 plans of correction
  • 2 statements of deficiencies

Results

8 with issues

1 without issues

Connecticut average: 13 visits/inspections

Latest inspection

Date:August 21, 2025

Inspection history

01-31-2024 Inspection Report
02-05-2025 Inspection Report
02-05-2025 Plan of Correction
03-05-2024 Inspection Report
04-08-2020 Plan of Correction
07-06-2021 Inspection Report
08-11-2021 Plan of Correction
08-11-2021 Statement of Deficiencies
08-21-2025 Inspection Report
09-22-2021 Plan of Correction
10-11-2023 Plan of Correction
11-03-2020 Plan of Correction
11-09-2021 Inspection Report
12-03-2024 Inspection Report
12-16-2024 Inspection Report

35 deficiencies

Deficiencies indicate regulatory issues. A higher number implies the facility had several areas requiring improvement.

Inspection Report Summary for Lutheran Home Of Southbury Inc

The most recent inspection on August 21, 2025, found the facility in compliance with all regulations and no new deficiencies were identified. Earlier inspections showed a mixed record with deficiencies related primarily to infection control, medication management, resident care, and food service safety. Complaint investigations from 2019 and 2025 resulted in substantiated deficiencies involving nursing assessments, medication errors, and food service practices, while most other complaints were unsubstantiated. Enforcement actions such as fines or license suspensions were not listed in the available reports. The facility appears to have improved over time, correcting prior deficiencies and maintaining compliance in the latest review.

Health Inspection History

Inspections
Total health inspections 4

Connecticut average 5.7


Last Health inspection on Sep 2024

Total health citations 20

Connecticut average 32

Citations per inspection
5

Connecticut average 5.82


Health citations are formal notices following inspections when they fail to comply with safety and care standards.

17 of 20 citations resulted from standard inspections; and 3 of 20 resulted from complaint investigations.

Breakdown of citation severity (last 3 years)
Critical Health citations More info 0
100% better than Connecticut average

Connecticut average: 0.3


Serious Health citations More info 0
100% better than Connecticut average

Connecticut average: 0.7

0 critical citations More info Connecticut average: 0.3

0 serious citations More info Connecticut average: 0.7

18 moderate citations More info Connecticut average: 28.8

2 minor citations More info Connecticut average: 2.3
Citations history (last 3 years)
Abuse/Neglect moderate citation Info Issues related to protecting resident's from harm, including abuse, neglect, or mistreatment. Sep 23, 2024
Corrected

Care Planning moderate citation Info Issues related to creating and updating personalized care plans for residents based on their needs and conditions. Sep 23, 2024
Corrected

Resident Rights moderate citation Info Issues related to resident's rights, including dignity, privacy, and the ability to make decisions about their care. Sep 23, 2024
Corrected

Abuse/Neglect moderate citation Info Issues related to protecting resident's from harm, including abuse, neglect, or mistreatment. Aug 29, 2023
Corrected

Compare Nursing Homes around Connecticut The information below is reported by the Connecticut Department of Public Health, Facility Licensing and Investigations Section.

4 facilities compared · CMS & CT Dept. of Health data · Updated Mar 2026

River Glen Health Care Center
NH

Nursing Home Licensed facility providing 24/7 skilled nursing care for residents with complex, ongoing medical needs. Staffed by RNs, LPNs, and CNAs. Inspected and star-rated annually by CMS. Accepts Medicare (short-term rehab) and Medicaid (long-term care).

Southbury
120
88.9%
+6%
3.60
-40%
-9%
0
19
1
110
35
Thci Company, Llc
$28,8M
$9,0M
31.1%
75241
Private / Semi-Private Rooms
Regency House Of Wallingford I
NH

Nursing Home Licensed facility providing 24/7 skilled nursing care for residents with complex, ongoing medical needs. Staffed by RNs, LPNs, and CNAs. Inspected and star-rated annually by CMS. Accepts Medicare (short-term rehab) and Medicaid (long-term care).

Wallingford (Wallingford Center)
130
96.3%
+15%
3.47
-11%
-13%
0
13
0
125
39
Barry Bokow 2012 Family Trust
$29,1M
$7,9M
27%
75261
Private / Semi-Private Rooms
Lutheran Home Of Southbury Inc
NH

Nursing Home Licensed facility providing 24/7 skilled nursing care for residents with complex, ongoing medical needs. Staffed by RNs, LPNs, and CNAs. Inspected and star-rated annually by CMS. Accepts Medicare (short-term rehab) and Medicaid (long-term care).

Southbury
134
93.5%
+11%
4.81
+41%
+21%
0
20
0
110
3
Ascentria Care Alliance Inc
$22,7M
$9,2M
40.3%
75371
1 Bed
Laurel Ridge Health Care Center
NH

Nursing Home Licensed facility providing 24/7 skilled nursing care for residents with complex, ongoing medical needs. Staffed by RNs, LPNs, and CNAs. Inspected and star-rated annually by CMS. Accepts Medicare (short-term rehab) and Medicaid (long-term care).

Ridgefield (Route 7 Gateway)
-
85.1%
+1%
3.80
-
-4%
0
0
0
111
-
David Reis Family Trust No. 3
$28,2M
$8,6M
30.7%
75395
-

Places of interest near Lutheran Home Of Southbury Inc

Address 1.8 miles from city center

Address 990 Main St N, Southbury, CT 06488

Calculate Travel Distance to Lutheran Home Of Southbury Inc

Add your location

Address

Staffing Data (Q2 2025)

This data corresponds to Q2 2025 and is based on CMS Payroll-Based Journal.

Total staff 265
Employees 163
Contractors 102
Staff to resident ratio 2.41:1
28% better than Connecticut average

Connecticut average ratio: 1.88:1

Avg staff/day 77
Average shift 7.6 hours
0% compared with Connecticut average

Connecticut average: 7.5 hours

Total staff hours (quarter) 53,328
Nursing staff breakdown
Registered Nurse

Manages medical care and health needs.

Total count 41
Average shift length Info Average shift length. Calculated as total hours divided by days worked and average staff per day. 7.6 hours

This role is partially covered by contractors.

Licensed Practical Nurse

Assists with medical care and medications.

Total count 69
Average shift length Info Average shift length. Calculated as total hours divided by days worked and average staff per day. 8.1 hours

This role is partially covered by contractors.

Certified Nursing Assistant

Helps with daily care and mobility.

Total count 100
Average shift length Info Average shift length. Calculated as total hours divided by days worked and average staff per day. 7.7 hours

This role is partially covered by contractors.

Contractor staffing

Total hours from contractors

4.1%

2,172 contractor hours this quarter

Licensed Practical Nurse: 36 Registered Nurse: 32 Certified Nursing Assistant: 29 Clinical Nurse Specialist: 3 Respiratory Therapy Technician: 1 Occupational Therapy Aide: 1
Staff by category
Certified Nursing Assistant712910026,47091100%7.7
Licensed Practical Nurse33366910,36191100%8.1
Registered Nurse932413,88091100%7.6
Clinical Nurse Specialist93123,5377785%8.1
Other Dietary Services Staff8081,89991100%6.7
Respiratory Therapy Technician7181,3897785%6.4
Physical Therapy Assistant4049257987%6.5
Mental Health Service Worker3038516470%8
Physical Therapy Aide4048196571%6.3
Speech Language Pathologist4047587481%6
Qualified Social Worker5055136976%4.8
Administrator2025045965%8
Nurse Practitioner1014966268%8
Dietitian1014806066%8
Occupational Therapy Aide0112172629%8.3
Therapeutic Recreation Specialist1011904752%4
RN Director of Nursing1013855%7.5
100 Certified Nursing Assistant
% of Days 100%
69 Licensed Practical Nurse
% of Days 100%
41 Registered Nurse
% of Days 100%
12 Clinical Nurse Specialist
% of Days 85%
8 Other Dietary Services Staff
% of Days 100%
8 Respiratory Therapy Technician
% of Days 85%
4 Physical Therapy Assistant
% of Days 87%
3 Mental Health Service Worker
% of Days 70%
4 Physical Therapy Aide
% of Days 71%
4 Speech Language Pathologist
% of Days 81%
5 Qualified Social Worker
% of Days 76%
2 Administrator
% of Days 65%
1 Nurse Practitioner
% of Days 68%
1 Dietitian
% of Days 66%
1 Occupational Therapy Aide
% of Days 29%
1 Therapeutic Recreation Specialist
% of Days 52%
1 RN Director of Nursing
% of Days 5%

Facility Characteristics

Source: CMS Long-Term Care Facility Characteristics (Data as of Jan 2026)

Total census
110 residents
Residents by payment source
Medicare
8 residents (7.3%)
Medicaid
9 residents (8.2%)
Private pay or other
93 residents (84.5%)
Programs & Services
Residents' Group

Residents meet regularly to discuss policies, care quality, and activities

Active Resident Council

Organized group of residents that meets regularly to discuss facility policies, quality of life, and activities.

Quality of care over time

These measures show how residents usually do over time at this home, based on health outcomes and preventive care.

High-risk clinical events score Info A composite score based on pressure ulcers, falls with injury, weight loss, walking ability decline, and activities of daily living decline. 13.1
26% worse than Connecticut average

Connecticut average: 10.4

Functional decline score Info A composite score based on activities of daily living decline, walking ability decline, and incontinence. 27.2
29% worse than Connecticut average

Connecticut average: 21.1

Long-stay resident measures
Average Connecticut avg: 3.2 Info CMS star rating based on long-stay quality measure performance. 5 stars = significantly above average, 1 star = significantly below average.
Need for Help with Daily Activities Increased Info Percent of long-stay residents whose need for help with daily activities has increased 32.6%
73% worse than Connecticut average

Connecticut average: 18.9%

Walking Ability Worsened Info Percent of long-stay residents whose ability to move independently worsened 19.8%
In line with Connecticut average

Connecticut average: 19.2%

Low Risk Residents with Bowel/Bladder Incontinence Info Percent of low risk long-stay residents who lose control of their bowels or bladder 29.3%
18% worse than Connecticut average

Connecticut average: 24.9%

Falls with Major Injury Info Percent of long-stay residents experiencing one or more falls with major injury 2.2%
36% better than Connecticut average

Connecticut average: 3.5%

High Risk Residents with Pressure Ulcers Info Percent of long-stay high risk residents with pressure ulcers 4.8%
5% worse than Connecticut average

Connecticut average: 4.6%

Urinary Tract Infection Info Percent of long-stay residents with a urinary tract infection 1.4%
16% better than Connecticut average

Connecticut average: 1.7%

Lost Too Much Weight Info Percent of long-stay residents who lose too much weight 6.3%
In line with Connecticut average

Connecticut average: 6.3%

Depressive Symptoms Info Percent of long-stay residents who have depressive symptoms 0.0%
100% better than Connecticut average

Connecticut average: 15.2%

Antipsychotic Use Info Percent of long-stay residents who received an antipsychotic medication 19.6%
14% worse than Connecticut average

Connecticut average: 17.2%

Pneumococcal Vaccine Info Percent of long-stay residents assessed and appropriately given the pneumococcal vaccine 97.0%
11% better than Connecticut average

Connecticut average: 87.5%

Influenza Vaccine Info Percent of long-stay residents assessed and appropriately given the seasonal influenza vaccine 93.6%
In line with Connecticut average

Connecticut average: 93.5%

Hospitalizations per 1,000 days Info Number of hospitalizations per 1,000 long-stay resident days. 1.76
16% better than Connecticut average

Connecticut average: 2.10

ED visits per 1,000 days Info Number of outpatient emergency department visits per 1,000 long-stay resident days. 1.29
16% better than Connecticut average

Connecticut average: 1.53

Short-stay resident measures
Significantly above average Connecticut avg: 3.3 Info CMS star rating based on short-stay quality measure performance. 5 stars = much above average, 1 star = much below average.
Pneumococcal Vaccine Info Percent of short-stay residents assessed and appropriately given the pneumococcal vaccine 82.2%
17% better than Connecticut average

Connecticut average: 70.1%

Antipsychotic medication increase Info Percent of short-stay residents who newly received an antipsychotic medication 0.6%
61% better than Connecticut average

Connecticut average: 1.5%

Influenza Vaccine Info Percent of short-stay residents assessed and appropriately given the seasonal influenza vaccine 88.0%
26% better than Connecticut average

Connecticut average: 69.8%

Re-hospitalized after SNF stay Info Percentage of short-stay residents who were re-hospitalized after their nursing home admission. 27.2%
9% worse than Connecticut average

Connecticut average: 25.0%

Emergency department visits Info Percentage of short-stay residents who had an outpatient emergency department visit. 9.7%
13% better than Connecticut average

Connecticut average: 11.1%

Falls with major injury Info Percentage of SNF residents who experience falls with major injury during their stay. 0.5%
35% better than Connecticut average

Connecticut average: 0.8%

Ability to care for self at discharge Info Percentage of residents at or above expected ability to care for themselves at discharge. 61.8%
15% better than Connecticut average

Connecticut average: 53.7%

Successful return to home or community Info Rate of successful return to home or community from a skilled nursing facility. 62.6%
24% better than Connecticut average

Connecticut average: 50.6%

Guides for Better Senior Living

Care Cost Calculator: See Prices in Your Area

Nursing Home Data Explorer

Don’t Wait Too Long: 7 Red Flag Signs Your Parent Needs Assisted Living Now

The True Cost of Assisted Living in 2025 – And How Families Are Paying For It

Understanding Senior Living Costs: Pricing Models, Discounts & Financial Assistance

Financial Aid for Connecticut Seniors

Get financial aid guidance

Connecticut Home Care Program for Elders

CHCPE

Age 65+, Connecticut resident, at risk of nursing home placement.

State-funded: ~$1,600/month; Medicaid: ~$2,829/month (300% FBR).

$1,600 (state), $2,000 (Medicaid, individual).

Two tiers (state and Medicaid); waitlists possible.

Statewide Respite Care Program

CT Respite Care

Caregiver of senior with dementia, Connecticut resident.

~$2,500/month (individual, varies).

$40,000 (individual).

Limited to dementia caregivers; capped funding.

Congregate Housing Services Program (CHSP)

Connecticut Congregate Housing Services Program

Age 62+, Connecticut resident, frail but not needing 24/7 care, resides in CHSP-eligible housing.

~$41,000/year (individual, adjusted annually).

Not specified; focus is income-based.

Limited to 14 state-subsidized sites; participants pay 10% of service costs.

Medicare Savings Program (MSP)

Connecticut Medicare Savings Program

Age 65+ or disabled, Connecticut resident, enrolled in Medicare Part A/B.

~$2,510/month (individual, QMB); ~$3,380/month (SLMB); ~$3,598/month (ALMB)—adjusted annually.

None since 2023 policy change.

Three tiers (Qualified Medicare Beneficiary, Specified Low-Income, Additional Low-Income); no asset test.

Senior Community Service Employment Program (SCSEP)

Connecticut SCSEP (federally funded, state-administered)

Age 55+, unemployed, low-income, Connecticut resident.

~$1,983/month (125% FPL, individual).

Not specified; income-focused.

Priority for veterans, rural residents; limited slots (~500/year).