Explore Open Rooms

1 Contact details
2 What type of senior care service are you looking for?
3 What budget do you have in mind for senior care?
4 How soon do you need to find care?
5 Additional details

Thank you for your interest!

Our team will be in touch shortly to help with next steps.

Nursing Home

Maefair Health Care Center

Nursing Home

Maefair Health Care Center

21 Maefair Ct, Trumbull, CT 06611 View map
Overview of Maefair Health Care Center

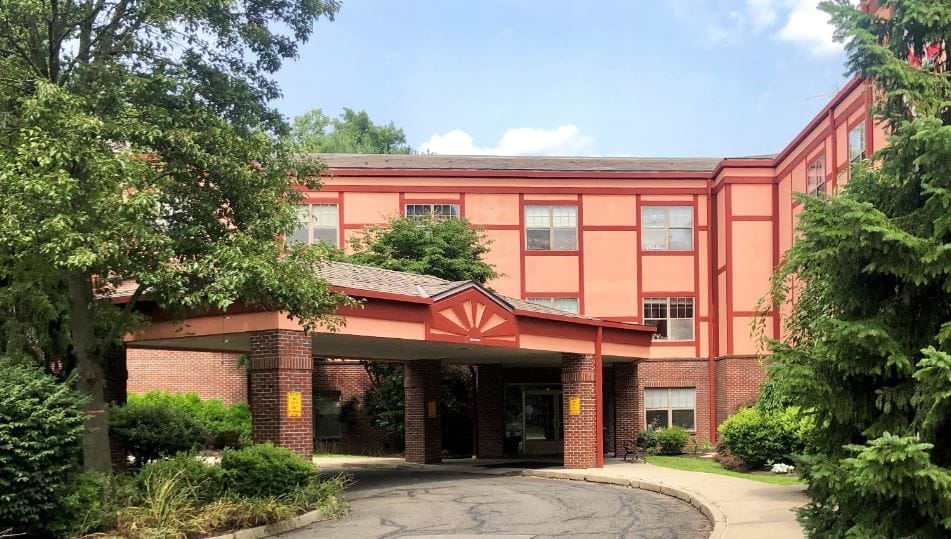
Ensconced in the picturesque town of Trumbull, Connecticut, Maefair Health Care Center stands as a beacon of professional care and compassion for seniors. Their team of dedicated professionals delivers expert skilled nursing care, post-hospital recovery, and assisted senior living, ensuring that residents receive the highest level of attention and support. Moreover, they understand that preserving dignity and respect is paramount, treating each individual with the utmost care and consideration. Maefair also offers hospice care and home health services, ensuring that residents receive the necessary support for their ever-changing needs.
Designed with both comfort and privacy in mind, Maefair features a range of inviting accommodations, including private and semi-private rooms, as well as cozy lounges where residents can relax and unwind. But it’s the breathtaking outdoor landscape that truly captivates, providing a serene backdrop for residents to embrace the beauty of nature and indulge in social opportunities.

Managed by Rita Pitter

Administrator

27 years in healthcare administration

Rita Pitter is the Administrator at Maefair Center for Health and Rehabilitation, leading efforts to ensure resident services support quality of life and service excellence. She has 27 years of experience in healthcare administration, holds a Masters in Healthcare Administration from Quinipiac University, and is certified in Therapeutic Recreation.

Quality ratings

Measured by Centers for Medicare & Medicaid Services (CMS)

Overall rating Info The Overall CMS Rating combines results from health inspections, staffing levels and quality measures. Health inspections carry the most weight. Staffing and quality scores can increase or decrease the final rating based on performance compared to state and national standards.
3/5
Connecticut average: 3.0/5
Health Inspection Info Based on the results of the facility's three most recent standard inspections and any complaint investigations. CMS reviews the number, scope, and severity of deficiencies, with more recent findings weighted more heavily.
4/5
Connecticut average: 2.8/5
Staffing Info Measures average nursing staff hours per resident per day, including Registered Nurses (RNs) and total nursing staff. Ratings are adjusted based on the level of care residents require and are compared to state and national benchmarks.
1/5
Connecticut average: 3.2/5
Quality Measures Info Based on clinical and physical health indicators reported to CMS, such as hospital readmissions, falls, pressure ulcers, and improvements in mobility. These measures reflect how well residents' health needs are being managed.
3/5
Connecticut average: 3.5/5

Nursing care per resident

Info This shows how many total hours of nursing staff time are available per resident each day. Higher numbers usually mean more staff support.
3h 26m per day

This home provides 14% less nursing time per resident than the Connecticut average.

Connecticut average: 3h 58m per day

Staffing hours breakdown

Info Hours of care per resident per day, broken down by staff type. Data from CMS Medicare.
Staff type Facility State avg National avg
Registered Nurse (RN) Info Registered nurse hours per resident per day. 34m per day 42m per day 41m per day
Nurse Aide Info Nurse aide hours per resident per day. 2h 0m per day 2h 17m per day 2h 21m per day
Total Nursing (Weekend) Info Total number of nurse staff hours per resident per day on weekends. 3h 0m per day 3h 25m per day 3h 26m per day
Physical Therapist Info Physical therapist staff hours per resident per day. 2m per day 5m per day 4m per day
RN (Weekend) Info Registered nurse hours per resident per day on weekends. 15m per day 28m per day 29m per day

Capacity and availability

Medium-capacity home

Offers a balance of services and community atmosphere.

Total beds 134

This home usually has limited availability

Occupancy is moderate, suggesting balanced demand.

Similar demand to the Connecticut average
Occupancy rate 90.3%
Residents per day (avg) 123
Occupancy rate
90.3%
Residents per day (avg)
123

Who this home usually serves

TYPE OF STAY

Mostly short-term rehab stays

Most residents typically stay for a few weeks or months before returning home or moving on.

Might be optimal for
Short stays Recovery Medicare-covered care

Breakdown by payment type

Medicare

88% of new residents, usually for short-term rehab.

Typical stay 19 days

Private pay

3% of new residents, often for short stays.

Typical stay 3 years

Medicaid

10% of new residents, often for long-term daily care.

Typical stay 7 years

Finances and operations

Privately-owned community
Operated by a business corporation.
Home revenue
$32.4M
Operating loss
-$731.4K
Privately-owned community Operated by a business corporation.
Home revenue
$32,385,210.00
Operating loss
$-731,359.00
Payroll costs Info The portion of the home's budget spent on staff, including nurses, caregivers, and other employees who support care and operations.
$9.0M
27.7% of revenue
Other operating costs Info All remaining costs needed to run the home, such as food, utilities, building maintenance, supplies and administrative expenses.
$24.2M
Total costs $33.1M
Walk Score
Walk Score: 25 / 100
Somewhat walkable. A few nearby services may be reachable on foot, but most trips require transportation.

About this community

Care Services

Accepts Medicaid
Accepts Medicare
Nursing Services
Rehabilitation Services
Skilled Nursing
Licensed Nurses/CNAs
24-Hour Staffing
Short-Term Rehab

Programs & Activities

Specific Programs
Short-Term Care Services, Advanced Capabilities and Programs, Long-Term Care Services, Physical Therapy, Speech Therapy, Occupational Therapy, Heart Failure and Cardiac Recovery, Pulmonary Disease Management, Neurology and Stroke Rehabilitation, Orthopedic Injuries and Post-Surgical Care, Diabetes Management, Wound Care, Amputee Rehabilitation, IV Therapies, Telehealth
Operating Hours
8am – 8pm, or by appointment, with options for virtual visits

Types of Care at Maefair Health Care Center

Assisted Living Nursing Home Home Care Hospice Care
Contact Maefair Health Care Center

Health Inspection History

Inspections
Total health inspections 4

Connecticut average 5.7


Last Health inspection on Apr 2025

Total health citations 28

Connecticut average 32

Citations per inspection
7

Connecticut average 5.82


Health citations are formal notices following inspections when they fail to comply with safety and care standards.

23 of 28 citations resulted from standard inspections; and 5 of 28 resulted from complaint investigations.

Breakdown of citation severity (last 3 years)
Critical Health citations More info 0
100% better than Connecticut average

Connecticut average: 0.3


Serious Health citations More info 0
100% better than Connecticut average

Connecticut average: 0.7

0 critical citations More info Connecticut average: 0.3

0 serious citations More info Connecticut average: 0.7

27 moderate citations More info Connecticut average: 28.8

1 minor citation More info Connecticut average: 2.3
Citations history (last 3 years)
Abuse/Neglect moderate citation Info Issues related to protecting resident's from harm, including abuse, neglect, or mistreatment. Apr 30, 2025
Corrected

Pharmacy moderate citation Info Issues related to medication management, including how drugs are stored, administered, and monitored. Apr 30, 2025
Corrected

Quality of Care moderate citation Info Issues related to how well residents receive appropriate treatment and support for their medical and daily care needs. Apr 30, 2025
Corrected

Quality of Care moderate citation Info Issues related to how well residents receive appropriate treatment and support for their medical and daily care needs. Apr 30, 2025
Corrected

Compare Nursing Homes around Bridgeport The information below is reported by the Connecticut Department of Public Health, Facility Licensing and Investigations Section.

5 facilities compared · CMS & CT Dept. of Health data · Updated Mar 2026

Ludlowe Center for Health and Rehabilitation
NH

Nursing Home Licensed facility providing 24/7 skilled nursing care for residents with complex, ongoing medical needs. Staffed by RNs, LPNs, and CNAs. Inspected and star-rated annually by CMS. Accepts Medicare (short-term rehab) and Medicaid (long-term care).

Fairfield
144
95.7%
+14%
3.25
+70%
-18%
1
21
3
134
33
Page, Patricia
$33,8M
$10,1M
30%
75330
Cambridge Health and Rehabilitation Center
NH

Nursing Home Licensed facility providing 24/7 skilled nursing care for residents with complex, ongoing medical needs. Staffed by RNs, LPNs, and CNAs. Inspected and star-rated annually by CMS. Accepts Medicare (short-term rehab) and Medicaid (long-term care).

Fairfield
160
91.9%
+9%
3.25
+62%
-18%
0
29
0
146
23
Oagmah Partnership Lp
$37,9M
$9,7M
25.6%
75323
Maefair Health Care Center
AL

Assisted Living A licensed, long-term care setting for seniors or individuals with disabilities who need help with daily activities — like bathing, dressing, and medication management — but not 24-hour skilled nursing. Offers housing, meals, and around-the-clock support while aiming to maximize resident independence.

HC

Home Care Professional care delivered in the person's own home — from companionship and errands to skilled nursing and therapy. Allows seniors to age in place. Medicare covers skilled home health when medically necessary.

HC

Home Care Professional care delivered in the person's own home — from companionship and errands to skilled nursing and therapy. Allows seniors to age in place. Medicare covers skilled home health when medically necessary.

NH

Nursing Home Licensed facility providing 24/7 skilled nursing care for residents with complex, ongoing medical needs. Staffed by RNs, LPNs, and CNAs. Inspected and star-rated annually by CMS. Accepts Medicare (short-term rehab) and Medicaid (long-term care).

Trumbull (Trumbull Center)
134
90.3%
+8%
3.44
+19%
-14%
2
28
0
123
25
Golec, Terri
$32,1M
$9,0M
27.9%
75404
Hewitt Health & Rehabilitation Center
MC

Memory Care Secured, specialized care for people living with Alzheimer's or dementia. Staff trained in cognitive impairment, with higher staff-to-resident ratios and an environment designed to reduce confusion and wandering risk.

NH

Nursing Home Licensed facility providing 24/7 skilled nursing care for residents with complex, ongoing medical needs. Staffed by RNs, LPNs, and CNAs. Inspected and star-rated annually by CMS. Accepts Medicare (short-term rehab) and Medicaid (long-term care).

Shelton
120
78.8%
-6%
3.68
-29%
-7%
2
61
1
114
74
-
$13,2M
$5,5M
41.8%
75047
Northbridge Health Care Center
AL

Assisted Living A licensed, long-term care setting for seniors or individuals with disabilities who need help with daily activities — like bathing, dressing, and medication management — but not 24-hour skilled nursing. Offers housing, meals, and around-the-clock support while aiming to maximize resident independence.

HC

Home Care Professional care delivered in the person's own home — from companionship and errands to skilled nursing and therapy. Allows seniors to age in place. Medicare covers skilled home health when medically necessary.

HC

Home Care Professional care delivered in the person's own home — from companionship and errands to skilled nursing and therapy. Allows seniors to age in place. Medicare covers skilled home health when medically necessary.

NH

Nursing Home Licensed facility providing 24/7 skilled nursing care for residents with complex, ongoing medical needs. Staffed by RNs, LPNs, and CNAs. Inspected and star-rated annually by CMS. Accepts Medicare (short-term rehab) and Medicaid (long-term care).

Bridgeport (Brooklawn/St. Vincent)
145
88.0%
+5%
3.85
-95%
-3%
1
32
2
126
75
Roman, Erica
$32,4M
$9,3M
28.6%
75413

Places of interest near Maefair Health Care Center

Address 6 miles from city center — 3.6 miles to nearest hospital (Bridgeport Hospital)

Address 21 Maefair Ct, Trumbull, CT 06611

Calculate Travel Distance to Maefair Health Care Center

Add your location

Address

Staffing Data (Q2 2025)

This data corresponds to Q2 2025 and is based on CMS Payroll-Based Journal.

Total staff 160
Employees 126
Contractors 34
Staff to resident ratio 1.32:1
30% worse than Connecticut average

Connecticut average ratio: 1.88:1

Avg staff/day 69
Average shift 7.4 hours
0% compared with Connecticut average

Connecticut average: 7.5 hours

Total staff hours (quarter) 46,218
Nursing staff breakdown
Registered Nurse

Manages medical care and health needs.

Total count 21
Average shift length Info Average shift length. Calculated as total hours divided by days worked and average staff per day. 7.6 hours

This role is partially covered by contractors.

Licensed Practical Nurse

Assists with medical care and medications.

Total count 30
Average shift length Info Average shift length. Calculated as total hours divided by days worked and average staff per day. 7.6 hours

This role is partially covered by contractors.

Certified Nursing Assistant

Helps with daily care and mobility.

Total count 76
Average shift length Info Average shift length. Calculated as total hours divided by days worked and average staff per day. 7.5 hours

This role is partially covered by contractors.

Contractor staffing

Total hours from contractors

7.6%

3,518 contractor hours this quarter

Certified Nursing Assistant: 10 Registered Nurse: 7 Occupational Therapy Assistant: 5 Respiratory Therapy Technician: 3 Physical Therapy Assistant: 2 Speech Language Pathologist: 2 Physical Therapy Aide: 1 Qualified Social Worker: 1 Licensed Practical Nurse: 1 Medical Director: 1 Other Physician: 1
Staff by category
Certified Nursing Assistant 66 10 76 24,246 91 100% 7.5
Licensed Practical Nurse 29 1 30 9,982 91 100% 7.6
Registered Nurse 14 7 21 4,480 91 100% 7.6
Other Dietary Services Staff 7 0 7 1,484 90 99% 6.7
Clinical Nurse Specialist 3 0 3 1,136 63 69% 8
Dental Services Staff 3 0 3 1,080 62 68% 7.1
Physical Therapy Assistant 0 2 2 530 61 67% 7.8
Speech Language Pathologist 0 2 2 512 65 71% 7.7
Other Social Services Staff 1 0 1 496 62 68% 8
Administrator 1 0 1 480 60 66% 8
Nurse Practitioner 1 0 1 448 56 62% 8
Respiratory Therapy Technician 0 3 3 433 61 67% 5.4
Physical Therapy Aide 0 1 1 374 53 58% 7
Qualified Social Worker 0 1 1 354 65 71% 5.4
Medical Director 0 1 1 82 41 45% 2
Occupational Therapy Assistant 0 5 5 56 29 32% 1.6
Occupational Therapy Aide 1 0 1 29 6 7% 4.8
Other Physician 0 1 1 17 10 11% 1.7
76 Certified Nursing Assistant
% of Days 100%
30 Licensed Practical Nurse
% of Days 100%
21 Registered Nurse
% of Days 100%
7 Other Dietary Services Staff
% of Days 99%
3 Clinical Nurse Specialist
% of Days 69%
3 Dental Services Staff
% of Days 68%
2 Physical Therapy Assistant
% of Days 67%
2 Speech Language Pathologist
% of Days 71%
1 Other Social Services Staff
% of Days 68%
1 Administrator
% of Days 66%
1 Nurse Practitioner
% of Days 62%
3 Respiratory Therapy Technician
% of Days 67%
1 Physical Therapy Aide
% of Days 58%
1 Qualified Social Worker
% of Days 71%
1 Medical Director
% of Days 45%
5 Occupational Therapy Assistant
% of Days 32%
1 Occupational Therapy Aide
% of Days 7%
1 Other Physician
% of Days 11%

Facility Characteristics

Source: CMS Long-Term Care Facility Characteristics (Data as of Jan 2026)

Total census
121 residents
Residents by payment source
Medicare
13 residents (10.7%)
Medicaid
105 residents (86.8%)
Private pay or other
3 residents (2.5%)
Programs & Services
Residents' Group

Residents meet regularly to discuss policies, care quality, and activities

Family Member Group

Family members meet regularly to discuss policies, care quality, and activities

Active Family Council

Organized group of family members that meets regularly to discuss facility policies, resident care, and activities.

Active Resident Council

Organized group of residents that meets regularly to discuss facility policies, quality of life, and activities.

Quality of care over time

These measures show how residents usually do over time at this home, based on health outcomes and preventive care.

High-risk clinical events score Info A composite score based on pressure ulcers, falls with injury, weight loss, walking ability decline, and activities of daily living decline. 10.9
In line with Connecticut average

Connecticut average: 10.4

Functional decline score Info A composite score based on activities of daily living decline, walking ability decline, and incontinence. 21.6
In line with Connecticut average

Connecticut average: 21.1

Long-stay resident measures
Below average Connecticut avg: 3.2 Info CMS star rating based on long-stay quality measure performance. 5 stars = significantly above average, 1 star = significantly below average.
Need for Help with Daily Activities Increased Info Percent of long-stay residents whose need for help with daily activities has increased 18.5%
In line with Connecticut average

Connecticut average: 18.9%

Walking Ability Worsened Info Percent of long-stay residents whose ability to move independently worsened 18.2%
5% better than Connecticut average

Connecticut average: 19.2%

Low Risk Residents with Bowel/Bladder Incontinence Info Percent of low risk long-stay residents who lose control of their bowels or bladder 28.2%
13% worse than Connecticut average

Connecticut average: 24.9%

Falls with Major Injury Info Percent of long-stay residents experiencing one or more falls with major injury 2.2%
38% better than Connecticut average

Connecticut average: 3.5%

High Risk Residents with Pressure Ulcers Info Percent of long-stay high risk residents with pressure ulcers 4.8%
6% worse than Connecticut average

Connecticut average: 4.6%

Urinary Tract Infection Info Percent of long-stay residents with a urinary tract infection 2.0%
17% worse than Connecticut average

Connecticut average: 1.7%

Lost Too Much Weight Info Percent of long-stay residents who lose too much weight 10.6%
68% worse than Connecticut average

Connecticut average: 6.3%

Depressive Symptoms Info Percent of long-stay residents who have depressive symptoms 8.4%
44% better than Connecticut average

Connecticut average: 15.2%

Antipsychotic Use Info Percent of long-stay residents who received an antipsychotic medication 22.7%
32% worse than Connecticut average

Connecticut average: 17.2%

Pneumococcal Vaccine Info Percent of long-stay residents assessed and appropriately given the pneumococcal vaccine 71.8%
18% worse than Connecticut average

Connecticut average: 87.5%

Influenza Vaccine Info Percent of long-stay residents assessed and appropriately given the seasonal influenza vaccine 94.3%
In line with Connecticut average

Connecticut average: 93.5%

Hospitalizations per 1,000 days Info Number of hospitalizations per 1,000 long-stay resident days. 3.77
80% worse than Connecticut average

Connecticut average: 2.10

ED visits per 1,000 days Info Number of outpatient emergency department visits per 1,000 long-stay resident days. 2.12
39% worse than Connecticut average

Connecticut average: 1.53

Short-stay resident measures
Above average Connecticut avg: 3.3 Info CMS star rating based on short-stay quality measure performance. 5 stars = much above average, 1 star = much below average.
Pneumococcal Vaccine Info Percent of short-stay residents assessed and appropriately given the pneumococcal vaccine 39.3%
44% worse than Connecticut average

Connecticut average: 70.1%

Antipsychotic medication increase Info Percent of short-stay residents who newly received an antipsychotic medication 0.8%
49% better than Connecticut average

Connecticut average: 1.5%

Influenza Vaccine Info Percent of short-stay residents assessed and appropriately given the seasonal influenza vaccine 54.4%
22% worse than Connecticut average

Connecticut average: 69.8%

Re-hospitalized after SNF stay Info Percentage of short-stay residents who were re-hospitalized after their nursing home admission. 22.7%
9% better than Connecticut average

Connecticut average: 25.0%

Emergency department visits Info Percentage of short-stay residents who had an outpatient emergency department visit. 7.7%
31% better than Connecticut average

Connecticut average: 11.1%

Falls with major injury Info Percentage of SNF residents who experience falls with major injury during their stay. 0.0%
100% better than Connecticut average

Connecticut average: 0.8%

Ability to care for self at discharge Info Percentage of residents at or above expected ability to care for themselves at discharge. 52.4%
In line with Connecticut average

Connecticut average: 53.7%

Successful return to home or community Info Rate of successful return to home or community from a skilled nursing facility. 48.6%
In line with Connecticut average

Connecticut average: 50.6%

Penalties and fines

Federal penalties imposed by CMS for regulatory violations, including civil money penalties (fines) and denials of payment for new Medicare/Medicaid admissions.

Source: CMS Penalties Database (Data as of Jan 2026)

Total fines amount $25K
42% lower than Connecticut average

Connecticut average: $44K

Number of fines 2
15% more fines than Connecticut average

Connecticut average: 1.7

Payment Denials Info Serious action where Medicare and/or Medicaid temporarily stops payments for new residents until issues are fixed. 0
100% fewer payment denials than Connecticut average

Connecticut average: 0.1

Fines amount comparison
This facility $25K
Connecticut average $44K
Penalty History

Penalties are imposed by CMS for violations of federal nursing home regulations.

Civil Money Penalty Info Fines imposed for noncompliance, which can be assessed per day or per instance of violation. Mar 19, 2025
$17K
Civil Money Penalty Info Fines imposed for noncompliance, which can be assessed per day or per instance of violation. Aug 15, 2024
$8K

Last updated: Jan 2026

Guides for Better Senior Living

Care Cost Calculator: See Prices in Your Area

Nursing Home Data Explorer

Don’t Wait Too Long: 7 Red Flag Signs Your Parent Needs Assisted Living Now

The True Cost of Assisted Living in 2025 – And How Families Are Paying For It

Understanding Senior Living Costs: Pricing Models, Discounts & Financial Assistance

Financial Aid for Connecticut Seniors

Get financial aid guidance

Connecticut Home Care Program for Elders

CHCPE

Age 65+, Connecticut resident, at risk of nursing home placement.

State-funded: ~$1,600/month; Medicaid: ~$2,829/month (300% FBR).

$1,600 (state), $2,000 (Medicaid, individual).

Two tiers (state and Medicaid); waitlists possible.

Statewide Respite Care Program

CT Respite Care

Caregiver of senior with dementia, Connecticut resident.

~$2,500/month (individual, varies).

$40,000 (individual).

Limited to dementia caregivers; capped funding.

Congregate Housing Services Program (CHSP)

Connecticut Congregate Housing Services Program

Age 62+, Connecticut resident, frail but not needing 24/7 care, resides in CHSP-eligible housing.

~$41,000/year (individual, adjusted annually).

Not specified; focus is income-based.

Limited to 14 state-subsidized sites; participants pay 10% of service costs.

Medicare Savings Program (MSP)

Connecticut Medicare Savings Program

Age 65+ or disabled, Connecticut resident, enrolled in Medicare Part A/B.

~$2,510/month (individual, QMB); ~$3,380/month (SLMB); ~$3,598/month (ALMB)—adjusted annually.

None since 2023 policy change.

Three tiers (Qualified Medicare Beneficiary, Specified Low-Income, Additional Low-Income); no asset test.

Senior Community Service Employment Program (SCSEP)

Connecticut SCSEP (federally funded, state-administered)

Age 55+, unemployed, low-income, Connecticut resident.

~$1,983/month (125% FPL, individual).

Not specified; income-focused.

Priority for veterans, rural residents; limited slots (~500/year).

Tour Icon
Planning a tour? Check our touring checklist.
Chat Icon
Thinking of living here? We can help you speak to a current resident