East Hill by Senior Living Hospitality
Nursing Home, Assisted Living, Independent Living & Memory Care · Bridgeport, CT
CMS overall rating Info CMS (the Centers for Medicare & Medicaid Services) is the federal agency that rates nursing home quality. Its Overall Rating runs from 1 to 5 stars, combining health inspections, staffing, and quality measures, with inspections weighted most heavily.

East Hill by Senior Living Hospitality

Nursing Home, Assisted Living, Independent Living & Memory Care · Bridgeport, CT
CMS overall rating Info CMS (the Centers for Medicare & Medicaid Services) is the federal agency that rates nursing home quality. Its Overall Rating runs from 1 to 5 stars, combining health inspections, staffing, and quality measures, with inspections weighted most heavily.
Calculator: See prices in your area
East Hill by Senior Living Hospitality accepts Medicare and private pay.

Overview of East Hill by Senior Living Hospitality

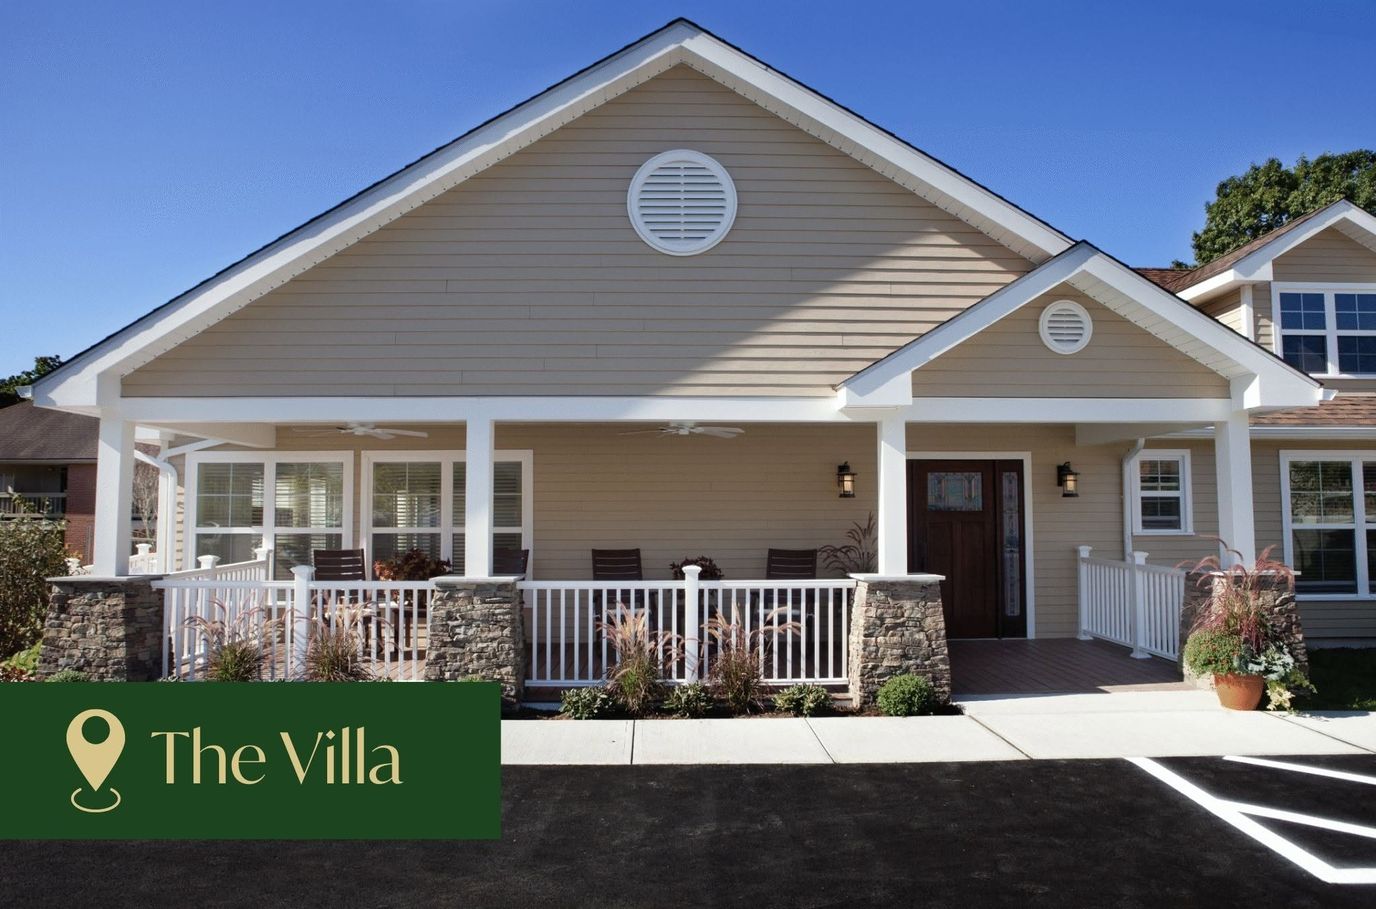
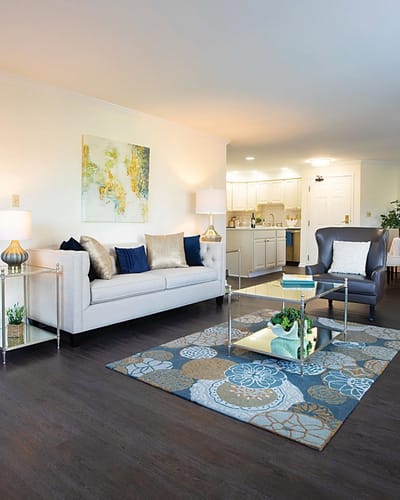
Located in a serene picturesque area in Southbury, East Hill by Senior Living Hospitality offers residential independent living and assisted living services. Residents can expect nothing but elegance and luxury at the cozy senior living home. The spirited retirement home performs nothing less than exceptional service offered by its professional and compassionate staff. The Watermark is a community that proudly raises senior members to thrive in the community.

East Hill by Senior Living Hospitality offers a range of services for its residents such as scheduled local transportation is available upon request; a calendar of activities is given to each resident with a list of classes, outings, and other events coming up.

(203) 262-6868

Quality ratings

Measured by Centers for Medicare & Medicaid Services (CMS)

Overall rating Info The Overall CMS Rating combines results from health inspections, staffing levels and quality measures. Health inspections carry the most weight. Staffing and quality scores can increase or decrease the final rating based on performance compared to state and national standards.
At CT avg. At CT avg.CT average: 3.0Click the badge to see the full State ranking.Click here to see the full State ranking.
Health Inspection Info Based on the results of the facility's three most recent standard inspections and any complaint investigations. CMS reviews the number, scope, and severity of deficiencies, with more recent findings weighted more heavily.
▲ 7.3% Above CT avg. ▲ 7.3% Above CT avg.CT average: 2.8Click the badge to see the full State ranking.Click here to see the full State ranking.
Staffing Info Measures average nursing staff hours per resident per day, including Registered Nurses (RNs) and total nursing staff. Ratings are adjusted based on the level of care residents require and are compared to state and national benchmarks.
▲ 23.3% Above CT avg. ▲ 23.3% Above CT avg.CT average: 3.2Click the badge to see the full State ranking.Click here to see the full State ranking.
Quality Measures Info Based on clinical and physical health indicators reported to CMS, such as hospital readmissions, falls, pressure ulcers, and improvements in mobility. These measures reflect how well residents' health needs are being managed.
▼ 43.2% Below CT avg. ▼ 43.2% Below CT avg.CT average: 3.5Click the badge to see the full State ranking.Click here to see the full State ranking.

Staffing hours breakdown

Info Daily nursing hours per resident by staff type, reported to CMS. Higher is generally better — compare this facility to state and national averages to see where staffing stands.

Hours per resident per day — compared to Connecticut state averages

Total nursing care / resident Info This home is ranked 5th out of 67 homes in Connecticut for nurse hours. Total adjusted nursing hours per resident per day, combining RN, LPN, and aide time. CMS adjusts this for case-mix so facilities can be fairly compared.
5h 38m per day
Rank #5 / 67Nurse hours — State benchmarkedThis home is ranked 5th out of 67 homes in Connecticut. Shows adjusted nurse hours per resident per day benchmarked to the Connecticut average, with a ranking across 67 Connecticut facilities. More hours mean more direct care. The national average is about 3.5 hrs; below 3.0 is a red flag.Ranking totals vary by category as each rank only includes facilities that report data for that metric. Homes missing that data point aren't included in the ranking.Click the rank badge to see the full State ranking.Click here to see the full State ranking.
This facility Connecticut avg (3h 58m per day)
vs Connecticut avg
+42%

0 of 1 metrics below state avg

Standout metric Weekend Total Nursing is +42% above state avg
Staff typeHours / Day / Residentvs state avg
Weekend Total Nursing Info Combined nursing hours (RN + LPN + Nurse Aide) per resident per day on weekends. Staffing often drops on weekends — this figure reveals whether the facility maintains adequate coverage outside of weekday hours. 4h 53m per day ▲ 42% State avg: 3h 26m per day · National avg: 3h 27m per day

Capacity and availability

This home usually has availability

Lower occupancy than the Connecticut average: 84%
Occupancy rate
69.8% Rank #65 / 72Occupancy rate — State benchmarkedThis home is ranked 65th out of 72 homes in Connecticut. Shows this facility's occupancy rate versus the Connecticut average, with its Statewide rank out of 72. Higher occupancy signals strong local demand and financial stability.Ranking totals vary by category as each rank only includes facilities that report data for that metric. Homes missing that data point aren't included in the ranking.Click the rank badge to see the full State ranking.Click here to see the full State ranking.
Avg. Length of Stay
35 days
Bed community size
96-bed community Rank #67 / 123Bed count — State benchmarkedThis home is ranked 67th out of 123 homes in Connecticut. Shows this facility's certified or reported bed count compared to other Connecticut facilities. Larger communities may offer more amenities, programs, and on-site services for residents and families.Ranking totals vary by category as each rank only includes facilities that report data for that metric. Homes missing that data point aren't included in the ranking.Click the rank badge to see the full State ranking.Click here to see the full State ranking.
A larger shared setting that may offer more common spaces and organized community services.
Walk Score
Walk Score: 6 / 100 Rank #254 / 264Walk Score — State benchmarkedThis home is ranked 254th out of 264 homes in Connecticut. Shows how walkable this facility's neighborhood is compared to the average Walk Score across Connecticut facilities. Higher scores benefit residents, families, and staff.Ranking totals vary by category as each rank only includes facilities that report data for that metric. Homes missing that data point aren't included in the ranking.Click the rank badge to see the full State ranking.Click here to see the full State ranking.
Car-dependent. Most errands require a car, with limited nearby walkable options.
BBB Rating
BBB Rating: A+ (Not Accredited)
An independent rating from the Better Business Bureau based on factors such as complaint history, transparency, and business practices.
How BBB ratings work

About this community

License Details

CMS Certification Number75441

Contact East Hill by Senior Living Hospitality

Health Inspection History

Inspections since 2020
Total health inspections 5

Connecticut average 5.7


Last Health inspection on Apr 2025

Total health citations
28 Rank #34 / 69Health citations — State benchmarkedThis home is ranked 34th out of 69 homes in Connecticut. Shows this facility's total health deficiency citations benchmarked to the Connecticut State average, with a ranking across all 69 CT facilities. Lower citation counts earn a better rank.Ranking totals vary by category as each rank only includes facilities that report data for that metric. Homes missing that data point aren't included in the ranking.Click the rank badge to see the full State ranking.Click here to see the full State ranking.

Connecticut average 32

Citations per inspection
5.6 Rank #42 / 69Citations per inspection — State benchmarkedThis home is ranked 42nd out of 69 homes in Connecticut. Shows average deficiency citations per CMS inspection for this facility versus the Connecticut mean across 69 facilities with citation data. Lower is better.Ranking totals vary by category as each rank only includes facilities that report data for that metric. Homes missing that data point aren't included in the ranking.Click the rank badge to see the full State ranking.Click here to see the full State ranking.

Connecticut average 5.82


Health citations are formal notices following inspections when they fail to comply with safety and care standards.

25 of 28 citations resulted from standard inspections; and 3 of 28 resulted from complaint investigations.

Breakdown of citation severity (last 6 years)
Critical health citations
0
100% better than Connecticut average

Connecticut average: 0.3


Serious health citations
0
100% better than Connecticut average

Connecticut average: 0.7

0 critical citations Connecticut average: 0.3

0 serious citations Connecticut average: 0.7

26 moderate citations Connecticut average: 28.8

2 minor citations Connecticut average: 2.3
Citations history (last 6 years)
Quality of Care moderate citation Apr 14, 2025
Corrected

Resident Rights moderate citation Apr 14, 2025
Corrected

Infection Control moderate citation Jan 08, 2025
Corrected

Nursing Services moderate citation Jan 08, 2025
Corrected

Staffing Data

Reporting period: October 1 – December 31, 2025 (Q4 2025). Source: CMS Payroll-Based Journal report.

Total staff 80
Employees 51
Contractors 29
Staff to resident ratio 2.96 : 1
59% more staff per resident than Connecticut average
Connecticut average ratio: 1.86 : 1 Connecticut average ratio: 1.86 : 1See full Connecticut ranking
Avg staff/day 20
Average shift 6.6 hours
12% worse than Connecticut average
Connecticut average: 7.5 hours Connecticut average shift: 7.5 hoursSee full Connecticut ranking
Total staff hours (quarter) 11,094

Nursing staff breakdown

Q4 2025 · Oct 1 – Dec 31 More info This data comes from the CMS Payroll-Based Journal report covering October 1 – December 31, 2025.
Registered Nurse

Manages medical care and health needs.

RN Staff Info 20 total: 13 full-time employees and 7 contractors. 20
Average shift length Info Average shift length. Calculated as total hours divided by days worked and average staff per day. 8 hours
Licensed Practical Nurse

Assists with medical care and medications.

LPN Staff Info 9 total: 7 full-time employees and 2 contractors. 9
Average shift length Info Average shift length. Calculated as total hours divided by days worked and average staff per day. 8.4 hours
Certified Nursing Assistant

Helps with daily care and mobility.

CNA Staff Info All 18 CNA Staff are full-time employees. No contractors work on this role. 18
Average shift length Info Average shift length. Calculated as total hours divided by days worked and average staff per day. 7.5 hours

Contractor staffing

Q4 2025 · Oct 1 – Dec 31 More info This data comes from the CMS Payroll-Based Journal report covering October 1 – December 31, 2025.

Total hours from contractors

11.4%

1,262 contractor hours this quarter

Registered Nurse: 7 Respiratory Therapy Technician: 4 Occupational Therapy Assistant: 4 Qualified Social Worker: 4 Physical Therapy Assistant: 3 Medical Director: 2 Speech Language Pathologist: 2 Licensed Practical Nurse: 2 Physical Therapy Aide: 1

Staff by category

Q4 2025 · Oct 1 – Dec 31 More info This data comes from the CMS Payroll-Based Journal report covering October 1 – December 31, 2025.
Certified Nursing Assistant180184,0877994%7.5
Registered Nurse137201,8867994%8
Licensed Practical Nurse7291,7087893%8.4
Clinical Nurse Specialist3034604655%7.5
Nurse Practitioner1014565768%8
Mental Health Service Worker1014005060%8
Respiratory Therapy Technician0443836780%4.5
Other Social Services Staff1013494554%7.8
Speech Language Pathologist0222556476%2.4
Physical Therapy Aide0112255060%4.5
Other Dietary Services Staff2022152935%7.4
Administrator1012085161%4.1
Occupational Therapy Aide1011452024%7.3
Physical Therapy Assistant0331316476%1.8
Qualified Social Worker0441093440%3
Dietitian3033856%7.6
Medical Director022312125%1.4
Occupational Therapy Assistant04471821%0.4
18 Certified Nursing Assistant
% of Days 94%
20 Registered Nurse
% of Days 94%
9 Licensed Practical Nurse
% of Days 93%
3 Clinical Nurse Specialist
% of Days 55%
1 Nurse Practitioner
% of Days 68%
1 Mental Health Service Worker
% of Days 60%
4 Respiratory Therapy Technician
% of Days 80%
1 Other Social Services Staff
% of Days 54%
2 Speech Language Pathologist
% of Days 76%
1 Physical Therapy Aide
% of Days 60%
2 Other Dietary Services Staff
% of Days 35%
1 Administrator
% of Days 61%
1 Occupational Therapy Aide
% of Days 24%
3 Physical Therapy Assistant
% of Days 76%
4 Qualified Social Worker
% of Days 40%
3 Dietitian
% of Days 6%
2 Medical Director
% of Days 25%
4 Occupational Therapy Assistant
% of Days 21%

Penalties and fines

Includes penalties issued in 2024-2025

Federal penalties imposed by CMS for regulatory violations, including civil money penalties (fines) and denials of payment for new Medicare/Medicaid admissions.

Source: CMS Penalties Database (Data as of Jan 2026)

Total fines amount $25K Rank #1 / 69Federal fines — State benchmarkedThis home is ranked 1st out of 69 homes in Connecticut. Shows this facility's cumulative CMS federal fine dollars versus the Connecticut average among facilities with fines, and where it ranks among 69 facilities in the pool. Lower total dollars mean a better rank.Ranking totals vary by category as each rank only includes facilities that report data for that metric. Homes missing that data point aren't included in the ranking.Click the rank badge to see the full State ranking.Click here to see the full State ranking.
43% lower than Connecticut average

Connecticut average: $44K

Number of fines 1
43% fewer fines than Connecticut average

Connecticut average: 1.7

Payment Denials Info Serious action where Medicare and/or Medicaid temporarily stops payments for new residents until issues are fixed. 1
654% more payment denials than Connecticut average

Connecticut average: 0.1

Fines amount comparison
This facility $25K
Connecticut average $44K
Penalty History

Penalties are imposed by CMS for violations of federal nursing home regulations.

2 penalties in the past 3 years

Multiple penalties were reported in the last 3 years.

Civil Money Penalty Info Fines imposed for noncompliance, which can be assessed per day or per instance of violation. Aug 19, 2025
$25K
Payment Denial Info Serious action where Medicare and/or Medicaid temporarily stops payments for new residents until issues are fixed. Jun 21, 2024
26 days

Last updated: Jan 2026

Quality of care over time

These measures show how residents usually do over time at this home, based on health outcomes and preventive care.

High-risk clinical events score Info A composite score based on pressure ulcers, falls with injury, weight loss, walking ability decline, and activities of daily living decline. 12.8
23% worse than Connecticut average

Connecticut average: 10.4

Functional decline score Info A composite score based on activities of daily living decline, walking ability decline, and incontinence. 35.6
69% worse than Connecticut average

Connecticut average: 21.1

Long-stay resident measures
Need for Help with Daily Activities Increased Info Percent of long-stay residents whose need for help with daily activities has increased 34.6%
83% worse than Connecticut average

Connecticut average: 18.9%

Low Risk Residents with Bowel/Bladder Incontinence Info Percent of low risk long-stay residents who lose control of their bowels or bladder 36.5%
46% worse than Connecticut average

Connecticut average: 24.9%

Falls with Major Injury Info Percent of long-stay residents experiencing one or more falls with major injury 8.3%
141% worse than Connecticut average

Connecticut average: 3.5%

High Risk Residents with Pressure Ulcers Info Percent of long-stay high risk residents with pressure ulcers 8.2%
79% worse than Connecticut average

Connecticut average: 4.6%

Urinary Tract Infection Info Percent of long-stay residents with a urinary tract infection 2.9%
74% worse than Connecticut average

Connecticut average: 1.7%

Lost Too Much Weight Info Percent of long-stay residents who lose too much weight 0.0%
100% better than Connecticut average

Connecticut average: 6.3%

Depressive Symptoms Info Percent of long-stay residents who have depressive symptoms 0.0%
100% better than Connecticut average

Connecticut average: 15.2%

Antipsychotic Use Info Percent of long-stay residents who received an antipsychotic medication 27.8%
62% worse than Connecticut average

Connecticut average: 17.2%

Pneumococcal Vaccine Info Percent of long-stay residents assessed and appropriately given the pneumococcal vaccine 100.0%
14% better than Connecticut average

Connecticut average: 87.5%

Short-stay resident measures
Pneumococcal Vaccine Info Percent of short-stay residents assessed and appropriately given the pneumococcal vaccine 90.2%
29% better than Connecticut average

Connecticut average: 70.1%

Antipsychotic medication increase Info Percent of short-stay residents who newly received an antipsychotic medication 0.0%
100% better than Connecticut average

Connecticut average: 1.5%

Influenza Vaccine Info Percent of short-stay residents assessed and appropriately given the seasonal influenza vaccine 93.4%
34% better than Connecticut average

Connecticut average: 69.8%

Breakdown by payment type

Medicare

53% of new residents, usually for short-term rehab.

Typical stay 23 days

Private pay

47% of new residents, often for short stays.

Typical stay 8 - 9 months

Facility Characteristics

Source: CMS Long-Term Care Facility Characteristics (Data as of Jan 2026)

Total residents 27
Medicare
14
51.9% of residents
Private pay or other
13
48.1% of residents
Programs & Services
Residents Group

Residents meet regularly to discuss policies, care quality, and activities

CCRC

Part of a Continuing Care Retirement Community offering multiple care levels

Active Resident Council

Organized group of residents that meets regularly to discuss facility policies, quality of life, and activities.

Finances and operations

Based on CMS SNF Cost Report for fiscal year ending in 12/2023.

Privately-owned community
Operated by a business corporation.
Net patient revenue Info Net patient revenue — what the home actually collects for resident care, after contractual allowances, bad debt and discounts are subtracted from its gross charges (CMS cost report, Worksheet G-3). It covers resident care only; money the home earns from other sources is shown separately as "Other income."
$15.6M
Net patient income Info Net patient income: net patient revenue minus the home's total operating expenses. A positive figure means it earns more from resident care than it spends to deliver it; a negative figure means the opposite. It excludes non-operating "other income."
-$7.6M
Privately-owned community Operated by a business corporation.
Net patient revenue Info Net patient revenue — what the home actually collects for resident care, after contractual allowances, bad debt and discounts are subtracted from its gross charges (CMS cost report, Worksheet G-3). It covers resident care only; money the home earns from other sources is shown separately as "Other income."
$15.6M Rank #47 / 73Revenue — State benchmarkedThis home is ranked 47th out of 73 homes in Connecticut. Shows this facility's annual revenue compared to the Connecticut average. Higher revenue generally means more resources for staffing and capital — read alongside Payroll %.Ranking totals vary by category as each rank only includes facilities that report data for that metric. Homes missing that data point aren't included in the ranking.Click the rank badge to see the full State ranking.Click here to see the full State ranking.
Net patient income Info Net patient income: net patient revenue minus the home's total operating expenses. A positive figure means it earns more from resident care than it spends to deliver it; a negative figure means the opposite. It excludes non-operating "other income."
-$7.6M
Other income Info Money the home earns outside of resident care — such as investments, grants, rentals and other non-operating sources (CMS cost report, Worksheet G-3). It is tracked separately from net patient revenue: it is not part of that figure, and it is not included in net patient income.
$435.5K
Payroll costs Info Staff salaries plus wage-related costs — benefits such as payroll taxes, health insurance and retirement — from the home's own accounting records (CMS cost report, Worksheet A). Contract or agency labor is counted separately, under other operating costs. Rank #58 / 73Payroll — State benchmarkedThis home is ranked 58th out of 73 homes in Connecticut. Shows total annual staff payroll benchmarked to the Connecticut average. Higher payroll investment relative to peers often signals better staffing and less reliance on cheaper contract labor.Ranking totals vary by category as each rank only includes facilities that report data for that metric. Homes missing that data point aren't included in the ranking.Click the rank badge to see the full State ranking.Click here to see the full State ranking.
$7.3M 46.5% of net patient revenue Info Payroll as a share of revenue: staff salaries and wage-related benefits divided by net patient revenue. A higher figure means more of each revenue dollar goes to staff pay. Rank #44 / 73Payroll % — State benchmarkedThis home is ranked 44th out of 73 homes in Connecticut. Shows payroll as a percentage of revenue versus the Connecticut average. Well-run Connecticut facilities typically land around 51–66% — the top third Statewide. Below 25% may signal understaffing or heavy agency use — read with Staffing ratings.Ranking totals vary by category as each rank only includes facilities that report data for that metric. Homes missing that data point aren't included in the ranking.Click the rank badge to see the full State ranking.Click here to see the full State ranking.
Other operating costs Info Everything it costs to run the home apart from payroll — food, utilities, supplies, maintenance, contract labor and administration. Calculated as total operating expense minus payroll (staff salaries and wage-related benefits).
$16.0M
Total costs Info The home's total operating expense for the year — all the costs of running it, salaries included (CMS cost report, Worksheet G-3).
$23.3M

What does this home offer?

Housing options icon

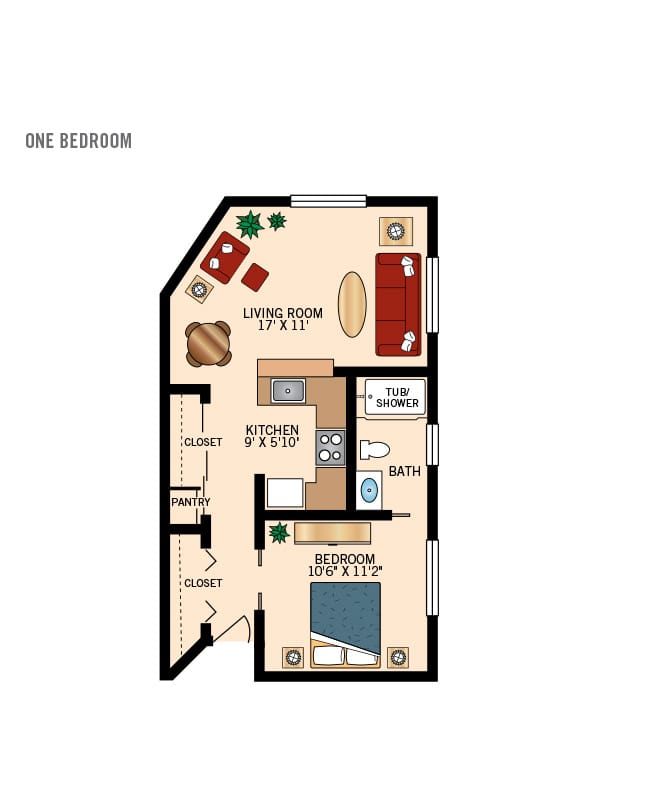
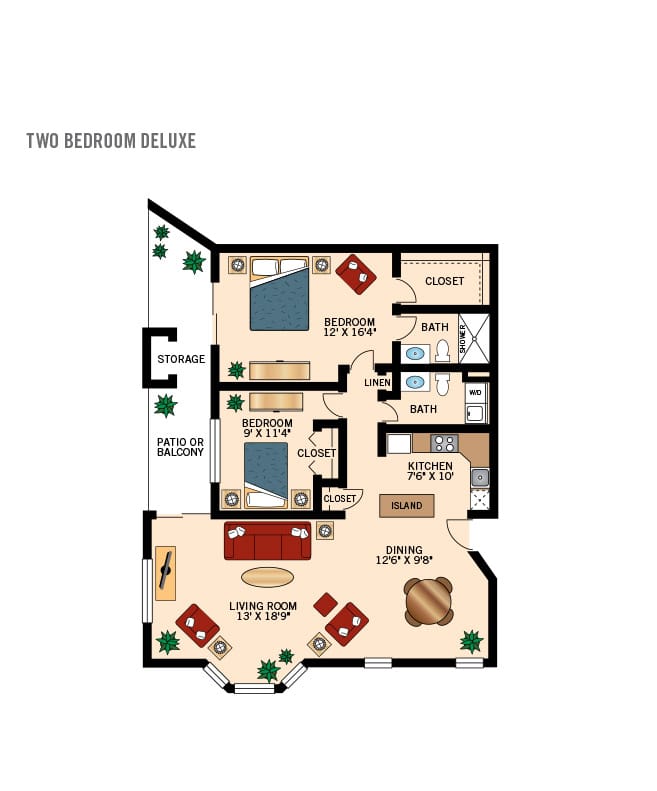
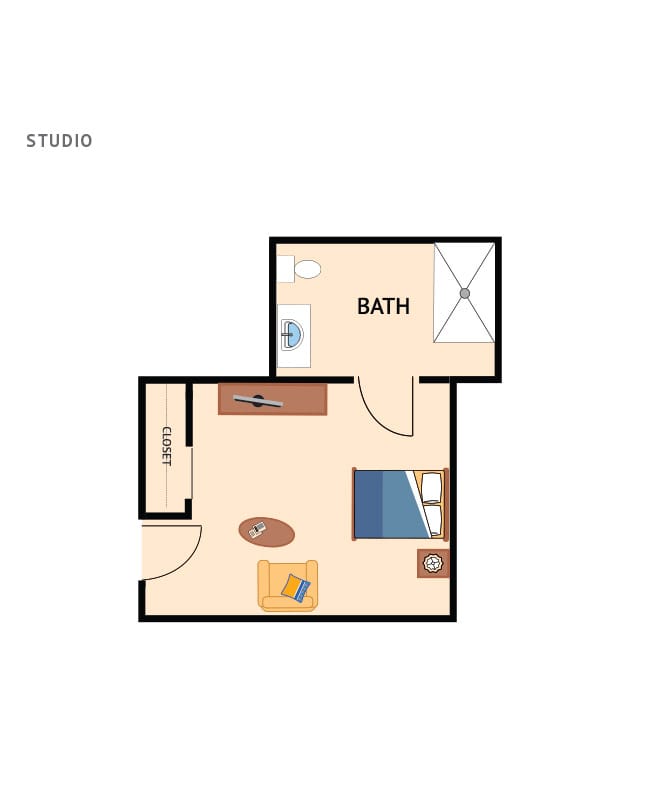
Housing Options: 1 Bed / 2 Bed

Beauty services icon

Beauty Services

Transportation services icon

Transportation Services

Housekeeping icon
Housekeeping icon

Housekeeping Services

Social and recreational activities icon

Social and Recreational Activities

Exercise program icon

Exercise Programs

Swimming pool icon
Swimming pool icon

Swimming Pool

Who this home usually serves

TYPE OF STAY

Mostly short-term rehab stays

Most residents typically stay for a few weeks or months before returning home or moving on.

Most new residents arrive under Medicare (53% of admissions), and a typical Medicare stay runs around 23 days.

Admissions
190 total

Coverage residents most often arrive under.

Medicare 53%
Private pay 47%
Discharges
222 total

Coverage residents most often leave under.

Medicare 49%
Private pay 51%

Living Spaces & Floor Plans for East Hill by Senior Living Hospitality

The Watermark At East Hill Al 1 Br
The Watermark At East Hill Al 2Br
The Watermark At East Hill Il 1Br
The Watermark At East Hill Il 2Br
The Watermark At East Hill Mc Studio

Places of interest near East Hill by Senior Living Hospitality

Address 27.5 miles from city center Info Estimated distance in miles from Southbury's city center to East Hill by Senior Living Hospitality's address, calculated via Google Maps. — 1.28 miles to nearest hospital (Be Balanced Naturopathic)

Calculate Travel Distance to East Hill by Senior Living Hospitality

Add your location

Address

Compare Nursing Home around Bridgeport

The information below is reported by the Connecticut Department of Public Health, Facility Licensing and Investigations Section.

5 facilities compared · CMS & CT Dept. of Health data

3030 Park by Senior Living Hospitality
NH
AL
IL
MC
Bridgeport (Brooklawn/St. Vincent)
23
Facility 23
CT AVG 111
Rank #117 / 123
78.4%
Facility 78.4%
CT AVG 84%
Rank #60 / 72
-7%
5.50
Facility 5.50
CT AVG 3.97
Rank #7 / 67
+39%+38%
$8.0k
Facility $8.0k
CT AVG $43.8k
Rank #37 / 69
15
Facility 15
CT AVG 32.0
Rank #10 / 69
5.0
Facility 5.0
CT AVG 5.8
Rank #28 / 69
120-
45
Facility 45
CT AVG 47
Rank #143 / 264
Ct Watermark Operator LLC
$21.2M
Facility $21.2M
CT AVG $19.0M
Rank #39 / 73
$9.3M
Facility $9.3M
CT AVG $7.2M
Rank #43 / 73
43.7%
Facility 43.7%
CT AVG 42.4%
Rank #46 / 73
75440
East Hill by Senior Living Hospitality
NH
AL
IL
MC
Southbury (Heritage Village)
96
Facility 96
CT AVG 111
Rank #67 / 123
69.8%
Facility 69.8%
CT AVG 84%
Rank #65 / 72
-17%
5.63
Facility 5.63
CT AVG 3.97
Rank #5 / 67
+132%+42%
$0
Facility $0
CT AVG $43.8k
Rank #1 / 69
28
Facility 28
CT AVG 32.0
Rank #34 / 69
5.6
Facility 5.6
CT AVG 5.8
Rank #42 / 69
-24A+
6
Facility 6
CT AVG 47
Rank #254 / 264
Connie Haworth
$15.6M
Facility $15.6M
CT AVG $19.0M
Rank #47 / 73
$7.3M
Facility $7.3M
CT AVG $7.2M
Rank #58 / 73
46.5%
Facility 46.5%
CT AVG 42.4%
Rank #44 / 73
75441
Pomperaug Woods
NH
AL
HC
IL
MC
RC
Southbury (Southbury Historic District No. 1)
37
Facility 37
CT AVG 111
Rank #108 / 123
81.1%
Facility 81.1%
CT AVG 84%
Rank #55 / 72
-3%
5.75
Facility 5.75
CT AVG 3.97
Rank #2 / 67
+26%+45%
$20.9k
Facility $20.9k
CT AVG $43.8k
Rank #54 / 69
14
Facility 14
CT AVG 32.0
Rank #8 / 69
7.0
Facility 7.0
CT AVG 5.8
Rank #54 / 69
128-
34
Facility 34
CT AVG 47
Rank #178 / 264
Dennis Fitzgerald
$12.8M
Facility $12.8M
CT AVG $19.0M
Rank #60 / 73
$6.8M
Facility $6.8M
CT AVG $7.2M
Rank #59 / 73
53.6%
Facility 53.6%
CT AVG 42.4%
Rank #19 / 73
75318
Jewish Senior Services
NH
AL
IL
MC
Bridgeport (North End)
294
Facility 294
CT AVG 111
Rank #3 / 123
97.6%
Facility 97.6%
CT AVG 84%
Rank #3 / 72
+16%
4.72
Facility 4.72
CT AVG 3.97
Rank #16 / 67
-22%+19%
$58.3k
Facility $58.3k
CT AVG $43.8k
Rank #60 / 69
23
Facility 23
CT AVG 32.0
Rank #25 / 69
4.6
Facility 4.6
CT AVG 5.8
Rank #21 / 69
2281-
36
Facility 36
CT AVG 47
Rank #173 / 264
Jewish Home For The Elderly Of Fairfield County Incorporated
$64.1M
Facility $64.1M
CT AVG $19.0M
Rank #1 / 73
$40.8M
Facility $40.8M
CT AVG $7.2M
Rank #1 / 73
63.6%
Facility 63.6%
CT AVG 42.4%
Rank #45 / 73
75353
Northbridge Health Care Center
NH
HC
MC
NC
RC
Bridgeport (Brooklawn/St. Vincent)
145
Facility 145
CT AVG 111
Rank #29 / 123
89.0%
Facility 89.0%
CT AVG 84%
Rank #37 / 72
+6%
3.85
Facility 3.85
CT AVG 3.97
Rank #29 / 67
-94%-3%
$57.3k
Facility $57.3k
CT AVG $43.8k
Rank #59 / 69
32
Facility 32
CT AVG 32.0
Rank #45 / 69
4.6
Facility 4.6
CT AVG 5.8
Rank #21 / 69
2125-
75
Facility 75
CT AVG 47
Rank #46 / 264
Erica Roman
$16.5M
Facility $16.5M
CT AVG $19.0M
Rank #16 / 73
$11.8M
Facility $11.8M
CT AVG $7.2M
Rank #24 / 73
71.3%
Facility 71.3%
CT AVG 42.4%
Rank #68 / 73
75413

Financial Assistance for
Nursing Home in Connecticut

East Hill by Senior Living Hospitality is located in Southbury, Connecticut.
Here are the financial assistance programs available to residents in Connecticut.

Get Financial aid guidance

Connecticut Home Care Program for Elders

CHCPE

Age 65+
General Connecticut resident, at risk of nursing home placement.
Income Limits State-funded: ~$1,600/month; Medicaid: ~$2,829/month 300% FBR
Asset Limits $1,600 (state), $2,000 (Medicaid, individual).
CT

Two tiers (state and Medicaid); waitlists possible.

Benefits
In-home care (4-6 hours/day) Adult day care (~$70/day) Meals Respite (up to 14 days/year)

Statewide Respite Care Program

CT Respite Care

Age
General Caregiver of senior with dementia, Connecticut resident.
Income Limits ~$2,500/month individual, varies
Asset Limits $40,000 individual
CT

Limited to dementia caregivers; capped funding.

Benefits
In-home respite (up to 30 days/year) Adult day care (~$70/day)

Congregate Housing Services Program (CHSP)

Connecticut Congregate Housing Services Program

Age 62+
General Connecticut resident, frail but not needing 24/7 care, resides in CHSP-eligible housing.
Income Limits (2025) ~$41,000/year individual, adjusted annually
Asset Limits Not specified; focus is income-based.
CT

Limited to 14 state-subsidized sites; participants pay 10% of service costs.

Benefits
Personal care (3-5 hours/day) Meals ($5-$7/meal) Housekeeping Transportation (~5 trips/month)

Medicare Savings Program (MSP)

Connecticut Medicare Savings Program

Age 65+ or disabled
General Connecticut resident, enrolled in Medicare Part A/B.
Income Limits (2025) ~$2,510/month (individual, QMB); ~$3,380/month (SLMB); ~$3,598/month (ALMB)—adjusted annually.
Asset Limits None since 2023 policy change.
CT

Three tiers (Qualified Medicare Beneficiary, Specified Low-Income, Additional Low-Income); no asset test.

Benefits
Covers Medicare Part B premiums ($174.70/month) Deductibles ($240/year) Copays (~20% of services)

Frequently Asked Questions about East Hill by Senior Living Hospitality

What neighborhood is East Hill by Senior Living Hospitality in?

East Hill by Senior Living Hospitality is in the Heritage Village neighborhood of Southbury.

Is East Hill by Senior Living Hospitality in a walkable area?

East Hill by Senior Living Hospitality has a walk score of 6. Car-dependent. Most errands require a car, with limited nearby walkable options.

What is the occupancy rate at East Hill by Senior Living Hospitality?

East Hill by Senior Living Hospitality's occupancy is 69.8%.

Are there photos of East Hill by Senior Living Hospitality?

Yes — there are 5 photos of East Hill by Senior Living Hospitality in the photo gallery on this page.

What is the phone number of East Hill by Senior Living Hospitality?

(203) 262-6868 will put you in contact with the team at East Hill by Senior Living Hospitality.

Is East Hill by Senior Living Hospitality Medicare or Medicaid certified?

Yes — East Hill by Senior Living Hospitality is a CMS-certified provider of Medicare and Medicaid.

Guides for Better Senior Living

Care Cost Calculator: See Prices in Your Area

Nursing Home Data Explorer

Don’t Wait Too Long: 7 Red Flag Signs Your Parent Needs Assisted Living Now

The True Cost of Assisted Living in 2025 – And How Families Are Paying For It

Understanding Senior Living Costs: Pricing Models, Discounts & Financial Assistance