Magnolia Village
Nursing Home, Independent Living & Respite Care · Gardendale, AL
CMS overall rating Info CMS (the Centers for Medicare & Medicaid Services) is the federal agency that rates nursing home quality. Its Overall Rating runs from 1 to 5 stars, combining health inspections, staffing, and quality measures, with inspections weighted most heavily.

Magnolia Village

Nursing Home, Independent Living & Respite Care · Gardendale, AL
CMS overall rating Info CMS (the Centers for Medicare & Medicaid Services) is the federal agency that rates nursing home quality. Its Overall Rating runs from 1 to 5 stars, combining health inspections, staffing, and quality measures, with inspections weighted most heavily.
Calculator: See prices in your area
Magnolia Village accepts Medicare, Medicaid, and private pay.

Overview of Magnolia Village

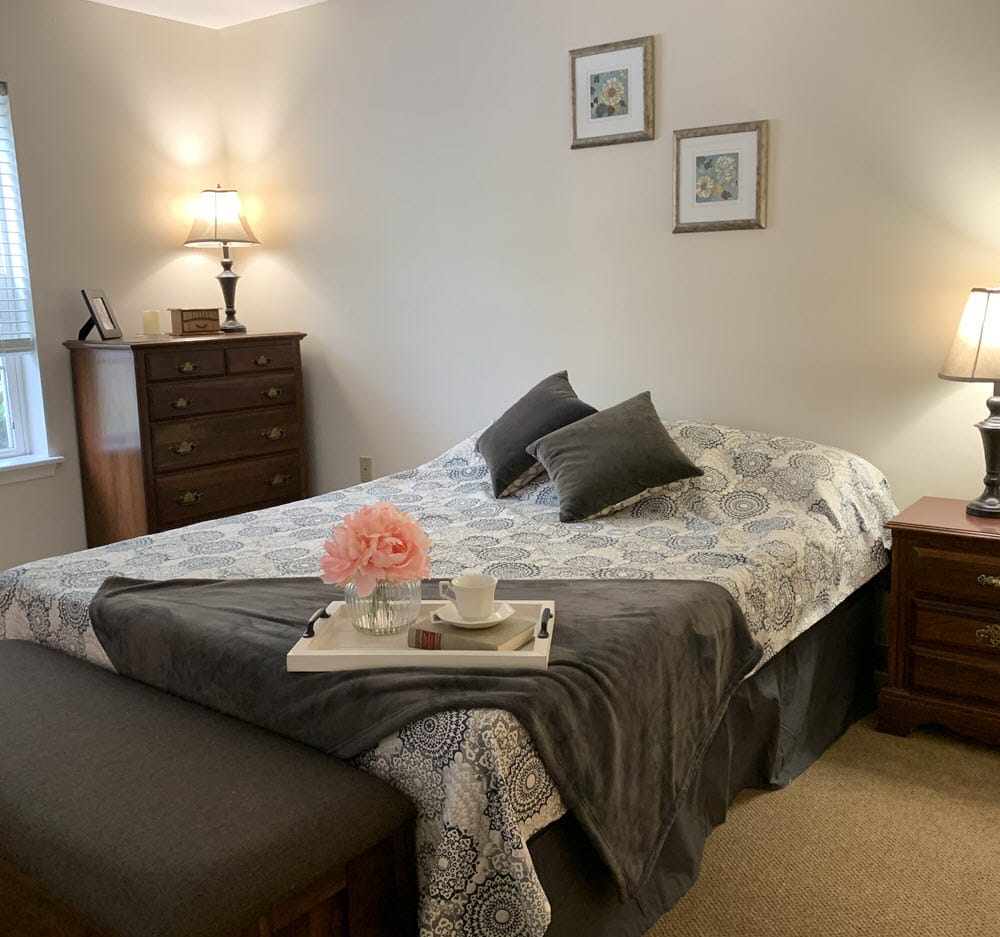
Magnolia Village is a highly regarded independent living community in Gardendale, AL, that offers compassionate services to maintain older adults’ independence in retirement. With its hotel-like amenities, the community strives to enrich older adults’ living experiences while ensuring comfort. Restaurant-style dining, housekeeping services, and beauty and barber services are also provided, so older adults have a maintenance-free living. The community’s amenities and living spaces are designed with residents’ needs and preferences in mind to help them thrive in their later years.

Live music events, cooking workshops, and brain games are just some of the recreational activities that residents can join to connect with friends and spend their days actively. Pet-friendly spaces also allow residents to live with their pets and prevent loneliness. With its ideal setting near leisure sites in the quiet residential area of Gardendale, the community guarantees a lively and stress-free lifestyle. This independent living community is one of the best options for senior living in Alabama, as proven by several awards and recognitions for its exceptional services.

Quality ratings

Measured by Centers for Medicare & Medicaid Services (CMS)

Overall rating Info The Overall CMS Rating combines results from health inspections, staffing levels and quality measures. Health inspections carry the most weight. Staffing and quality scores can increase or decrease the final rating based on performance compared to state and national standards.
Health Inspection Info Based on the results of the facility's three most recent standard inspections and any complaint investigations. CMS reviews the number, scope, and severity of deficiencies, with more recent findings weighted more heavily.
Staffing Info Measures average nursing staff hours per resident per day, including Registered Nurses (RNs) and total nursing staff. Ratings are adjusted based on the level of care residents require and are compared to state and national benchmarks.
Quality Measures Info Based on clinical and physical health indicators reported to CMS, such as hospital readmissions, falls, pressure ulcers, and improvements in mobility. These measures reflect how well residents' health needs are being managed.

Staffing hours breakdown

Info Daily nursing hours per resident by staff type, reported to CMS. Higher is generally better — compare this facility to state and national averages to see where staffing stands.

Hours per resident per day — compared to state averages

Total nursing care / resident Info Total adjusted nursing hours per resident per day, combining RN, LPN, and aide time. CMS adjusts this for case-mix so facilities can be fairly compared.
3h 16m per day
Rank #128 / 136Nurse hours — State benchmarkedThis home is ranked 128th out of 136 homes in Alabama. Shows adjusted nurse hours per resident per day benchmarked to the Alabama average, with a ranking across 136 Alabama facilities. More hours mean more direct care. The national average is about 3.5 hrs; below 3.0 is a red flag.Rankings are based only on facilities in Alabama that report data for that category. Facilities without available data are excluded from the ranking.Click the rank badge to see the full State ranking.Click here to see the full State ranking.
vs avg
Staff typeHours / Day / Residentvs state avg
Registered Nurse (RN) Info RNs hold the highest nursing license and can assess residents, interpret test results, and direct care plans. More RN hours per day often signals stronger clinical oversight and faster response to health changes. 49m per day
LPN / LVN Info Licensed Practical Nurses (LPNs) or Licensed Vocational Nurses (LVNs) deliver routine hands-on care — medication administration, wound dressing, and monitoring vital signs. They work under RN supervision and make up a large share of daily bedside care. 1h 27m per day
Nurse Aide Info Certified Nurse Aides (CNAs) provide the most direct day-to-day assistance: bathing, dressing, feeding, and mobility. Nurse aide hours are typically the largest staffing category and directly affect residents' quality of life. 3h 33m per day
Weekend Total Nursing Info Combined nursing hours (RN + LPN + Nurse Aide) per resident per day on weekends. Staffing often drops on weekends — this figure reveals whether the facility maintains adequate coverage outside of weekday hours. 4h 55m per day
Physical Therapist Info Hours per resident per day provided by licensed Physical Therapists (PTs) or PT Assistants. PT services help residents recover mobility after injury or illness and are especially important for post-acute (short-stay) rehabilitation. 7m per day
Weekend RN Info Registered nurse hours specifically on weekends. Facilities sometimes reduce RN presence on Saturdays and Sundays — a low weekend RN figure compared to weekday hours can indicate reduced clinical oversight when most administrative staff are absent. 23m per day

Capacity and availability

This home usually has limited availability

Similar occupancy to the state average
Occupancy rate
92.5% Rank #21 / 138Occupancy rate — State benchmarkedThis home is ranked 21st out of 138 homes in Alabama. Shows this facility's occupancy rate versus the Alabama average, with its Statewide rank out of 138. Higher occupancy signals strong local demand and financial stability.Rankings are based only on facilities in Alabama that report data for that category. Facilities without available data are excluded from the ranking.Click the rank badge to see the full State ranking.Click here to see the full State ranking.
Avg. Length of Stay
143 days
Bed community size
148-bed community Rank #34 / 245Bed count — State benchmarkedThis home is ranked 34th out of 245 homes in Alabama. Shows this facility's certified or reported bed count compared to other Alabama facilities. Larger communities may offer more amenities, programs, and on-site services for residents and families.Rankings are based only on facilities in Alabama that report data for that category. Facilities without available data are excluded from the ranking.Click the rank badge to see the full State ranking.Click here to see the full State ranking.
A larger shared setting that may offer more common spaces and organized community services.
Walk Score
Walk Score: 1 / 100 Rank #384 / 418Walk Score — State benchmarkedThis home is ranked 384th out of 418 homes in Alabama. Shows how walkable this facility's neighborhood is compared to the average Walk Score across Alabama facilities. Higher scores benefit residents, families, and staff.Rankings are based only on facilities in Alabama that report data for that category. Facilities without available data are excluded from the ranking.Click the rank badge to see the full State ranking.Click here to see the full State ranking.
Car-dependent. Most errands require a car, with limited nearby walkable options.

Therapy & Rehabilitation

2 services
Rehabilitation Services
Respite Care

Staffing & Medical

2 services
Nursing Services
24-Hour Staffing

Additional Policies & Features

Pets Allowed
Linen ServiceYes

Amenities & Lifestyle

Salon
Barber
Dining Room
Restaurant
Wifi
Housekeeping
Laundry
Dining Services
Activities
Wellness Programdrum therapy, exercise classes
Branded ProgramsWe Honor Veterans
Specific ProgramsHealth and Wellness Programs, Seminars

Pricing & Financial Information

Starting Price$2,323 per month

Contact Magnolia Village

Staffing Data

Reporting period: October 1 – December 31, 2025 (Q4 2025). Source: CMS Payroll-Based Journal report.

Total staff 124
Employees 111
Contractors 13
Staff to resident ratio 0.93 : 1
0% compared with State average

State average ratio: 0 : 0

Avg staff/day 40
Average shift 7.5 hours
0% compared with State average

State average: 0 hours

Total staff hours (quarter) 27,664

Nursing staff breakdown

Q4 2025 · Oct 1 – Dec 31 More info This data comes from the CMS Payroll-Based Journal report covering October 1 – December 31, 2025.
Registered Nurse

Manages medical care and health needs.

RN Staff Info 9 total: 7 full-time employees and 2 contractors. 9
Average shift length Info Average shift length. Calculated as total hours divided by days worked and average staff per day. 8.1 hours
Licensed Practical Nurse

Assists with medical care and medications.

LPN Staff Info 20 total: 16 full-time employees and 4 contractors. 20
Average shift length Info Average shift length. Calculated as total hours divided by days worked and average staff per day. 8.6 hours
Certified Nursing Assistant

Helps with daily care and mobility.

CNA Staff Info All 46 CNA Staff are full-time employees. No contractors work on this role. 46
Average shift length Info Average shift length. Calculated as total hours divided by days worked and average staff per day. 7.4 hours

Contractor staffing

Q4 2025 · Oct 1 – Dec 31 More info This data comes from the CMS Payroll-Based Journal report covering October 1 – December 31, 2025.

Total hours from contractors

4.6%

1,267 contractor hours this quarter

Licensed Practical Nurse: 4 Occupational Therapy Aide: 3 Registered Nurse: 2 Medical Director: 2 Occupational Therapy Assistant: 2

Staff by category

Q4 2025 · Oct 1 – Dec 31 More info This data comes from the CMS Payroll-Based Journal report covering October 1 – December 31, 2025.
Certified Nursing Assistant4604612,42492100%7.4
Licensed Practical Nurse164205,62292100%8.6
Registered Nurse7292,16092100%8.1
Medication Aide/Technician5051,3968997%9
Mental Health Service Worker2028996672%7.9
Speech Language Pathologist6068707480%5.2
Clinical Nurse Specialist5056236470%7.9
Administrator4045446470%8
Other Dietary Services Staff1015407582%7.2
Physical Therapy Assistant4045146571%6.9
Respiratory Therapy Technician4044235459%7.3
Nurse Practitioner2024184549%7.7
Other Social Services Staff1013965054%7.9
Qualified Social Worker5053576368%4.8
Occupational Therapy Aide0333094347%7.2
Physical Therapy Aide3031452224%4.7
Occupational Therapy Assistant02222910%2.5
Medical Director022322%1.4
46 Certified Nursing Assistant
% of Days 100%
20 Licensed Practical Nurse
% of Days 100%
9 Registered Nurse
% of Days 100%
5 Medication Aide/Technician
% of Days 97%
2 Mental Health Service Worker
% of Days 72%
6 Speech Language Pathologist
% of Days 80%
5 Clinical Nurse Specialist
% of Days 70%
4 Administrator
% of Days 70%
1 Other Dietary Services Staff
% of Days 82%
4 Physical Therapy Assistant
% of Days 71%
4 Respiratory Therapy Technician
% of Days 59%
2 Nurse Practitioner
% of Days 49%
1 Other Social Services Staff
% of Days 54%
5 Qualified Social Worker
% of Days 68%
3 Occupational Therapy Aide
% of Days 47%
3 Physical Therapy Aide
% of Days 24%
2 Occupational Therapy Assistant
% of Days 10%
2 Medical Director
% of Days 2%

Penalties and fines

Includes penalties issued in 2025

Federal penalties imposed by CMS for regulatory violations, including civil money penalties (fines) and denials of payment for new Medicare/Medicaid admissions.

Source: CMS Penalties Database (Data as of Jan 2026)

Total fines amount $392K Rank #137 / 137Federal fines — State benchmarkedThis home is ranked 137th out of 137 homes in Alabama. Shows this facility's cumulative CMS federal fine dollars versus the Alabama average among facilities with fines, and where it ranks among 137 facilities in the pool. Lower total dollars mean a better rank.Rankings are based only on facilities in Alabama that report data for that category. Facilities without available data are excluded from the ranking.Click the rank badge to see the full State ranking.Click here to see the full State ranking.
507% higher than State average

State average: $65K

Number of fines 1
58% fewer fines than State average

State average: 2.4

Payment Denials Info Serious action where Medicare and/or Medicaid temporarily stops payments for new residents until issues are fixed. 0
100% fewer payment denials than State average

State average: 0.3

Fines amount comparison
This facility $392K
State average $65K
Penalty History

Penalties are imposed by CMS for violations of federal nursing home regulations.

1 penalty in the past 3 years

Mar 19, 2025 · $392K

Civil Money Penalty Info Fines imposed for noncompliance, which can be assessed per day or per instance of violation. Mar 19, 2025
$392K

Last updated: Jan 2026

Quality of care over time

These measures show how residents usually do over time at this home, based on health outcomes and preventive care.

High-risk clinical events score Info A composite score based on pressure ulcers, falls with injury, weight loss, walking ability decline, and activities of daily living decline. 6.2
30% better than State average

State average: 8.9

Functional decline score Info A composite score based on activities of daily living decline, walking ability decline, and incontinence. 14.8
In line with State average

State average: 14.5

Long-stay resident measures
Need for Help with Daily Activities Increased Info Percent of long-stay residents whose need for help with daily activities has increased 11.6%
16% better than State average

State average: 13.9%

Walking Ability Worsened Info Percent of long-stay residents whose ability to move independently worsened 10.5%
35% better than State average

State average: 16.1%

Low Risk Residents with Bowel/Bladder Incontinence Info Percent of low risk long-stay residents who lose control of their bowels or bladder 22.2%
64% worse than State average

State average: 13.6%

Falls with Major Injury Info Percent of long-stay residents experiencing one or more falls with major injury 1.6%
52% better than State average

State average: 3.4%

High Risk Residents with Pressure Ulcers Info Percent of long-stay high risk residents with pressure ulcers 5.4%
9% better than State average

State average: 5.9%

Urinary Tract Infection Info Percent of long-stay residents with a urinary tract infection 1.6%
40% better than State average

State average: 2.7%

Lost Too Much Weight Info Percent of long-stay residents who lose too much weight 1.9%
65% better than State average

State average: 5.4%

Depressive Symptoms Info Percent of long-stay residents who have depressive symptoms 6.7%
444% worse than State average

State average: 1.2%

Antipsychotic Use Info Percent of long-stay residents who received an antipsychotic medication 5.3%
74% better than State average

State average: 20.7%

Pneumococcal Vaccine Info Percent of long-stay residents assessed and appropriately given the pneumococcal vaccine 78.2%
15% worse than State average

State average: 91.5%

Influenza Vaccine Info Percent of long-stay residents assessed and appropriately given the seasonal influenza vaccine 95.4%
In line with State average

State average: 94.8%

Short-stay resident measures
Pneumococcal Vaccine Info Percent of short-stay residents assessed and appropriately given the pneumococcal vaccine 16.8%
80% worse than State average

State average: 83.7%

Antipsychotic medication increase Info Percent of short-stay residents who newly received an antipsychotic medication 1.0%
53% better than State average

State average: 2.1%

Influenza Vaccine Info Percent of short-stay residents assessed and appropriately given the seasonal influenza vaccine 12.5%
84% worse than State average

State average: 80.3%

Breakdown by payment type

Medicare

15% of new residents, usually for short-term rehab.

Typical stay 1 - 2 months

Private pay

56% of new residents, often for short stays.

Typical stay 1 - 2 months

Medicaid

29% of new residents, often for long-term daily care.

Typical stay 1 years

Facility Characteristics

Source: CMS Long-Term Care Facility Characteristics (Data as of Jan 2026)

Total residents 134
Medicare
5
3.7% of residents
Medicaid
106
79.1% of residents
Private pay or other
23
17.2% of residents
Programs & Services
Residents Group

Residents meet regularly to discuss policies, care quality, and activities

Family Member Group

Family members meet regularly to discuss policies, care quality, and activities

Active Family Council

Organized group of family members that meets regularly to discuss facility policies, resident care, and activities.

Active Resident Council

Organized group of residents that meets regularly to discuss facility policies, quality of life, and activities.

Finances and operations

Based on CMS SNF Cost Report for fiscal year ending in 06/2024.

For-profit
Corporation
Net patient revenue Info Net patient revenue — what the home actually collects for resident care, after contractual allowances, bad debt and discounts are subtracted from its gross charges (CMS cost report, Worksheet G-3). It covers resident care only; money the home earns from other sources is shown separately as "Other income."
$16.0M
Net patient income Info Net patient income: net patient revenue minus the home's total operating expenses. A positive figure means it earns more from resident care than it spends to deliver it; a negative figure means the opposite. It excludes non-operating "other income."
$230.7K
For-profit Corporation
Net patient revenue Info Net patient revenue — what the home actually collects for resident care, after contractual allowances, bad debt and discounts are subtracted from its gross charges (CMS cost report, Worksheet G-3). It covers resident care only; money the home earns from other sources is shown separately as "Other income."
$16.0M Rank #15 / 135Revenue — State benchmarkedThis home is ranked 15th out of 135 homes in Alabama. Shows this facility's annual revenue compared to the Alabama average. Higher revenue generally means more resources for staffing and capital — read alongside Payroll %.Rankings are based only on facilities in Alabama that report data for that category. Facilities without available data are excluded from the ranking.Click the rank badge to see the full State ranking.Click here to see the full State ranking.
Net patient income Info Net patient income: net patient revenue minus the home's total operating expenses. A positive figure means it earns more from resident care than it spends to deliver it; a negative figure means the opposite. It excludes non-operating "other income."
$230.7K
Other income Info Money the home earns outside of resident care — such as investments, grants, rentals and other non-operating sources (CMS cost report, Worksheet G-3). It is tracked separately from net patient revenue: it is not part of that figure, and it is not included in net patient income.
$387.2K
Payroll costs Info Staff salaries plus wage-related costs — benefits such as payroll taxes, health insurance and retirement — from the home's own accounting records (CMS cost report, Worksheet A). Contract or agency labor is counted separately, under other operating costs. Rank #22 / 135Payroll — State benchmarkedThis home is ranked 22nd out of 135 homes in Alabama. Shows total annual staff payroll benchmarked to the Alabama average. Higher payroll investment relative to peers often signals better staffing and less reliance on cheaper contract labor.Rankings are based only on facilities in Alabama that report data for that category. Facilities without available data are excluded from the ranking.Click the rank badge to see the full State ranking.Click here to see the full State ranking.
$6.3M 39.5% of net patient revenue Info Payroll as a share of revenue: staff salaries and wage-related benefits divided by net patient revenue. A higher figure means more of each revenue dollar goes to staff pay. Rank #86 / 133Payroll % — State benchmarkedThis home is ranked 86th out of 133 homes in Alabama. Shows payroll as a percentage of revenue versus the Alabama average. Well-run Alabama facilities typically land around 54–69% — the top third Statewide. Below 25% may signal understaffing or heavy agency use — read with Staffing ratings.Rankings are based only on facilities in Alabama that report data for that category. Facilities without available data are excluded from the ranking.Click the rank badge to see the full State ranking.Click here to see the full State ranking.
Other operating costs Info Everything it costs to run the home apart from payroll — food, utilities, supplies, maintenance, contract labor and administration. Calculated as total operating expense minus payroll (staff salaries and wage-related benefits).
$9.5M
Total costs Info The home's total operating expense for the year — all the costs of running it, salaries included (CMS cost report, Worksheet G-3).
$15.8M

What does this home offer?

Housing options icon

Housing Options: Studio

Building type icon
Building type icon

Building Type: Single-story

Beauty services icon

Beauty Services

Social and recreational activities icon

Social and Recreational Activities

Exercise program icon

Exercise Programs

Who this home usually serves

TYPE OF STAY

Mostly long-term care residents

Most residents stay for extended periods and receive ongoing daily care.

Most new residents arrive under private pay (56% of admissions), and a typical private pay stay runs around 1 - 2 months.

Admissions
348 total

Coverage residents most often arrive under.

Medicare 15%
Private pay 56%
Medicaid 29%
Discharges
351 total

Coverage residents most often leave under.

Medicare 10%
Private pay 44%
Medicaid 45%

Places of interest near Magnolia Village

Address 1.1 miles from city center Info Estimated distance in miles from Gardendale's city center to Magnolia Village's address, calculated via Google Maps.

Calculate Travel Distance to Magnolia Village

Add your location

Address

Frequently Asked Questions about Magnolia Village

What neighborhood is Magnolia Village in?

Magnolia Village is in the Gardendale neighborhood.

Is Magnolia Village in a walkable area?

Magnolia Village has a walk score of 1. Car-dependent. Most errands require a car, with limited nearby walkable options.

What is the occupancy rate at Magnolia Village?

Magnolia Village's occupancy is 92.5%.

Does Magnolia Village operate as a for-profit or non-profit?

Magnolia Village is registered as a for-profit.

Are there photos of Magnolia Village?

Yes — there are 6 photos of Magnolia Village in the photo gallery on this page.

What is the address of Magnolia Village?

Magnolia Village is located at 420 Dean Ln, Gardendale, AL 35071.

What is the phone number of Magnolia Village?

(205) 631-9155 will put you in contact with the team at Magnolia Village.

Guides for Better Senior Living

Care Cost Calculator: See Prices in Your Area

Nursing Home Data Explorer

Don’t Wait Too Long: 7 Red Flag Signs Your Parent Needs Assisted Living Now

The True Cost of Assisted Living in 2025 – And How Families Are Paying For It

Understanding Senior Living Costs: Pricing Models, Discounts & Financial Assistance