Maine Veterans’ Homes – Scarborough
Nursing Home, Assisted Living, Memory Care, Residential Care & Respite Care · Scarborough, ME
CMS overall rating Info CMS (the Centers for Medicare & Medicaid Services) is the federal agency that rates nursing home quality. Its Overall Rating runs from 1 to 5 stars, combining health inspections, staffing, and quality measures, with inspections weighted most heavily.

Maine Veterans’ Homes – Scarborough

Nursing Home, Assisted Living, Memory Care, Residential Care & Respite Care · Scarborough, ME
CMS overall rating Info CMS (the Centers for Medicare & Medicaid Services) is the federal agency that rates nursing home quality. Its Overall Rating runs from 1 to 5 stars, combining health inspections, staffing, and quality measures, with inspections weighted most heavily.
Calculator: See prices in your area
Maine Veterans’ Homes – Scarborough accepts Medicare, Medicaid, and private pay.

Overview of Maine Veterans’ Homes – Scarborough

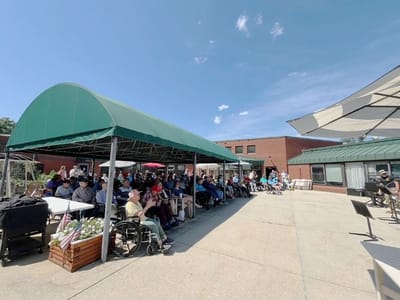
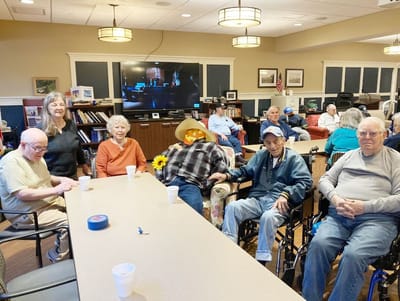
A prestigious senior living community situated in the peaceful residential area of Scarborough, ME, Maine Veterans’ Homes – Scarborough provides a wide array of care options for veterans. These include residential care, memory care, respite care, long-term care, short-term skilled rehabilitation, and outpatient therapy services. A selection of 150 cozy beds await seniors as they move into the serene premises of the community. With its commitment to enhancing seniors’ quality of life, Maine Veterans’ Homes – Scarborough boasts a team of respectful and qualified professionals providing top-tier care and assistance around the clock.

Feel a sense of camaraderie and lead a meaningful life with stimulating activities and enrichment programs. Enjoy mealtimes at your own pace with delicious and healthy meals catering to nutritional needs and preferences. With its vibrant setting and friendly environment, Maine Veterans’ Homes – Scarborough strives to provide a haven for veterans to live a glorious retirement.

Quality ratings

Measured by Centers for Medicare & Medicaid Services (CMS)

Overall rating Info The Overall CMS Rating combines results from health inspections, staffing levels and quality measures. Health inspections carry the most weight. Staffing and quality scores can increase or decrease the final rating based on performance compared to state and national standards.
Health Inspection Info Based on the results of the facility's three most recent standard inspections and any complaint investigations. CMS reviews the number, scope, and severity of deficiencies, with more recent findings weighted more heavily.
Staffing Info Measures average nursing staff hours per resident per day, including Registered Nurses (RNs) and total nursing staff. Ratings are adjusted based on the level of care residents require and are compared to state and national benchmarks.
Quality Measures Info Based on clinical and physical health indicators reported to CMS, such as hospital readmissions, falls, pressure ulcers, and improvements in mobility. These measures reflect how well residents' health needs are being managed.

Staffing hours breakdown

Info Daily nursing hours per resident by staff type, reported to CMS. Higher is generally better — compare this facility to state and national averages to see where staffing stands.

Hours per resident per day — compared to state averages

Total nursing care / resident Info Total adjusted nursing hours per resident per day, combining RN, LPN, and aide time. CMS adjusts this for case-mix so facilities can be fairly compared.
5h 38m per day
Rank #3 / 34Nurse hours — State benchmarkedThis home is ranked 3rd out of 34 homes in Maine. Shows adjusted nurse hours per resident per day benchmarked to the Maine average, with a ranking across 34 Maine facilities. More hours mean more direct care. The national average is about 3.5 hrs; below 3.0 is a red flag.Rankings are based only on facilities in Maine that report data for that category. Facilities without available data are excluded from the ranking.Click the rank badge to see the full State ranking.Click here to see the full State ranking.
vs avg

1 of 6 metrics below state avg

Standout metric Physical Therapist is +71% above state avg
Staff typeHours / Day / Residentvs state avg
Registered Nurse (RN) Info RNs hold the highest nursing license and can assess residents, interpret test results, and direct care plans. More RN hours per day often signals stronger clinical oversight and faster response to health changes. 1h 33m per day ▲ 47% State avg: 1h 3m per day · National avg: 41m per day
LPN / LVN Info Licensed Practical Nurses (LPNs) or Licensed Vocational Nurses (LVNs) deliver routine hands-on care — medication administration, wound dressing, and monitoring vital signs. They work under RN supervision and make up a large share of daily bedside care. 20m per day ▼ 25% State avg: 27m per day · National avg: 52m per day
Nurse Aide Info Certified Nurse Aides (CNAs) provide the most direct day-to-day assistance: bathing, dressing, feeding, and mobility. Nurse aide hours are typically the largest staffing category and directly affect residents' quality of life. 2h 51m per day ■ Avg State avg: 2h 51m per day · National avg: 2h 21m per day
Weekend Total Nursing Info Combined nursing hours (RN + LPN + Nurse Aide) per resident per day on weekends. Staffing often drops on weekends — this figure reveals whether the facility maintains adequate coverage outside of weekday hours. 4h 6m per day ▲ 4% State avg: 3h 55m per day · National avg: 3h 26m per day
Physical Therapist Info Hours per resident per day provided by licensed Physical Therapists (PTs) or PT Assistants. PT services help residents recover mobility after injury or illness and are especially important for post-acute (short-stay) rehabilitation. 7m per day ▲ 71% State avg: 4m per day · National avg: 4m per day
Weekend RN Info Registered nurse hours specifically on weekends. Facilities sometimes reduce RN presence on Saturdays and Sundays — a low weekend RN figure compared to weekday hours can indicate reduced clinical oversight when most administrative staff are absent. 58m per day ▲ 31% State avg: 44m per day · National avg: 29m per day

Capacity and availability

This home usually has limited availability

Similar occupancy to the state average
Occupancy rate
92.7% Rank #135 / 251Occupancy rate — State benchmarkedThis home is ranked 135th out of 251 homes in Maine. Shows this facility's occupancy rate versus the Maine average, with its Statewide rank out of 251. Higher occupancy signals strong local demand and financial stability.Rankings are based only on facilities in Maine that report data for that category. Facilities without available data are excluded from the ranking.Click the rank badge to see the full State ranking.Click here to see the full State ranking.
Avg. Length of Stay
307 days
Bed community size
120-bed community Rank #5 / 357Bed count — State benchmarkedThis home is ranked 5th out of 357 homes in Maine. Shows this facility's certified or reported bed count compared to other Maine facilities. Larger communities may offer more amenities, programs, and on-site services for residents and families.Rankings are based only on facilities in Maine that report data for that category. Facilities without available data are excluded from the ranking.Click the rank badge to see the full State ranking.Click here to see the full State ranking.
A larger shared setting that may offer more common spaces and organized community services.
Walk Score
Walk Score: 41 / 100 Rank #146 / 422Walk Score — State benchmarkedThis home is ranked 146th out of 422 homes in Maine. Shows how walkable this facility's neighborhood is compared to the average Walk Score across Maine facilities. Higher scores benefit residents, families, and staff.Rankings are based only on facilities in Maine that report data for that category. Facilities without available data are excluded from the ranking.Click the rank badge to see the full State ranking.Click here to see the full State ranking.
Somewhat walkable. A few nearby services may be reachable on foot, but most trips require transportation.

About this community

Awards

First in Maine to achieve the National Gold Award for Excellence in Quality from the American Health Care Association.

Safety & Compliance

Wheelchair Accessible

Therapy & Rehabilitation

2 services
Rehabilitation Services
Respite Care

Staffing & Medical

2 services
Doctor on Staff
24-Hour Staffing

Amenities & Lifestyle

On-Site Medical Director And Physician Services
24-Hour Rn Coverage
Clinical Site For Educational And Training Programs
Kitchen Availability For Family And Friends
A Veteran Hall With Projection Tv
Computers
Ipads
Skype & Facetime Available
A Barber/Beauty Shop
Modern Rehabilitation And Therapy Facility
Quiet Rooms
ActivitiesResident-driven activities program that includes on-site events and outings to the casino, race track, local restaurants, the movies, fishing, shopping, and more
Specific ProgramsShort-term Skilled Rehabilitation/Nursing Care, Outpatient Therapy Services
Volunteer Program

Contact Maine Veterans’ Homes – Scarborough

Staffing Data

Reporting period: October 1 – December 31, 2025 (Q4 2025). Source: CMS Payroll-Based Journal report.

Total staff 235
Employees 186
Contractors 49
Staff to resident ratio 2.26 : 1
0% compared with State average

State average ratio: 0 : 0

Avg staff/day 77
Average shift 8 hours
0% compared with State average

State average: 0 hours

Total staff hours (quarter) 56,468

Nursing staff breakdown

Q4 2025 · Oct 1 – Dec 31 More info This data comes from the CMS Payroll-Based Journal report covering October 1 – December 31, 2025.
Registered Nurse

Manages medical care and health needs.

RN Staff Info 44 total: 39 full-time employees and 5 contractors. 44
Average shift length Info Average shift length. Calculated as total hours divided by days worked and average staff per day. 8.3 hours
Licensed Practical Nurse

Assists with medical care and medications.

LPN Staff Info 13 total: 7 full-time employees and 6 contractors. 13
Average shift length Info Average shift length. Calculated as total hours divided by days worked and average staff per day. 8.7 hours
Certified Nursing Assistant

Helps with daily care and mobility.

CNA Staff Info 114 total: 80 full-time employees and 34 contractors. 114
Average shift length Info Average shift length. Calculated as total hours divided by days worked and average staff per day. 8.1 hours

Contractor staffing

Q4 2025 · Oct 1 – Dec 31 More info This data comes from the CMS Payroll-Based Journal report covering October 1 – December 31, 2025.

Total hours from contractors

5.7%

3,245 contractor hours this quarter

Certified Nursing Assistant: 34 Licensed Practical Nurse: 6 Registered Nurse: 5 Medical Director: 2 Diagnostic X-ray Services Staff: 1 Occupational Therapy Assistant: 1

Staff by category

Q4 2025 · Oct 1 – Dec 31 More info This data comes from the CMS Payroll-Based Journal report covering October 1 – December 31, 2025.
Certified Nursing Assistant803411425,11492100%8.1
Registered Nurse3954411,22892100%8.3
Clinical Nurse Specialist110114,0457885%7.8
Licensed Practical Nurse76133,45592100%8.7
Medication Aide/Technician100102,8098997%8.6
Mental Health Service Worker4041,7206874%8.2
Physical Therapy Assistant5051,3037986%7.4
Other Dietary Services Staff6061,2978896%5.4
Nurse Aide in Training8081,1726571%7.1
Respiratory Therapy Technician7071,1637784%7.6
Qualified Social Worker4046736571%7.2
Therapeutic Recreation Specialist1014976368%7.9
Nurse Practitioner1014886166%8
Dietitian1014725964%8
Administrator1014325459%8
Occupational Therapy Aide1014315964%7.3
Occupational Therapy Assistant0116489%8
Diagnostic X-ray Services Staff011561415%4
Medical Director022502527%2
114 Certified Nursing Assistant
% of Days 100%
44 Registered Nurse
% of Days 100%
11 Clinical Nurse Specialist
% of Days 85%
13 Licensed Practical Nurse
% of Days 100%
10 Medication Aide/Technician
% of Days 97%
4 Mental Health Service Worker
% of Days 74%
5 Physical Therapy Assistant
% of Days 86%
6 Other Dietary Services Staff
% of Days 96%
8 Nurse Aide in Training
% of Days 71%
7 Respiratory Therapy Technician
% of Days 84%
4 Qualified Social Worker
% of Days 71%
1 Therapeutic Recreation Specialist
% of Days 68%
1 Nurse Practitioner
% of Days 66%
1 Dietitian
% of Days 64%
1 Administrator
% of Days 59%
1 Occupational Therapy Aide
% of Days 64%
1 Occupational Therapy Assistant
% of Days 9%
1 Diagnostic X-ray Services Staff
% of Days 15%
2 Medical Director
% of Days 27%

Penalties and fines

Federal penalties imposed by CMS for regulatory violations, including civil money penalties (fines) and denials of payment for new Medicare/Medicaid admissions.

Source: CMS Penalties Database

No penalties in the past 3 years

No civil money penalties or payment denials were reported in the last 3 years.

Quality of care over time

These measures show how residents usually do over time at this home, based on health outcomes and preventive care.

High-risk clinical events score Info A composite score based on pressure ulcers, falls with injury, weight loss, walking ability decline, and activities of daily living decline. 16.2
14% worse than State average

State average: 14.2

Functional decline score Info A composite score based on activities of daily living decline, walking ability decline, and incontinence. 31.0
7% worse than State average

State average: 29.1

Long-stay resident measures
Below average State avg: 2.6 Info CMS star rating based on long-stay quality measure performance. 5 stars = significantly above average, 1 star = significantly below average.
Need for Help with Daily Activities Increased Info Percent of long-stay residents whose need for help with daily activities has increased 32.3%
24% worse than State average

State average: 26.0%

Walking Ability Worsened Info Percent of long-stay residents whose ability to move independently worsened 30.1%
In line with State average

State average: 31.4%

Low Risk Residents with Bowel/Bladder Incontinence Info Percent of low risk long-stay residents who lose control of their bowels or bladder 30.7%
In line with State average

State average: 29.8%

Falls with Major Injury Info Percent of long-stay residents experiencing one or more falls with major injury 5.3%
20% worse than State average

State average: 4.4%

High Risk Residents with Pressure Ulcers Info Percent of long-stay high risk residents with pressure ulcers 6.9%
54% worse than State average

State average: 4.5%

Urinary Tract Infection Info Percent of long-stay residents with a urinary tract infection 4.9%
77% worse than State average

State average: 2.8%

Lost Too Much Weight Info Percent of long-stay residents who lose too much weight 6.4%
16% worse than State average

State average: 5.5%

Depressive Symptoms Info Percent of long-stay residents who have depressive symptoms 7.6%
28% better than State average

State average: 10.5%

Antipsychotic Use Info Percent of long-stay residents who received an antipsychotic medication 26.5%
34% worse than State average

State average: 19.8%

Pneumococcal Vaccine Info Percent of long-stay residents assessed and appropriately given the pneumococcal vaccine 100.0%
11% better than State average

State average: 90.1%

Influenza Vaccine Info Percent of long-stay residents assessed and appropriately given the seasonal influenza vaccine 100.0%
5% better than State average

State average: 95.5%

Hospitalizations per 1,000 days Info Number of hospitalizations per 1,000 long-stay resident days. 0.80
42% better than State average

State average: 1.39

ED visits per 1,000 days Info Number of outpatient emergency department visits per 1,000 long-stay resident days. 0.61
71% better than State average

State average: 2.08

Short-stay resident measures
Significantly below average State avg: 3.3 Info CMS star rating based on short-stay quality measure performance. 5 stars = much above average, 1 star = much below average.
Pneumococcal Vaccine Info Percent of short-stay residents assessed and appropriately given the pneumococcal vaccine 97.1%
37% better than State average

State average: 70.8%

Antipsychotic medication increase Info Percent of short-stay residents who newly received an antipsychotic medication 2.3%
58% worse than State average

State average: 1.4%

Influenza Vaccine Info Percent of short-stay residents assessed and appropriately given the seasonal influenza vaccine 96.3%
29% better than State average

State average: 74.5%

Re-hospitalized after SNF stay Info Percentage of short-stay residents who were re-hospitalized after their nursing home admission. 22.8%
11% worse than State average

State average: 20.5%

Emergency department visits Info Percentage of short-stay residents who had an outpatient emergency department visit. 14.2%
9% better than State average

State average: 15.6%

Falls with major injury Info Percentage of SNF residents who experience falls with major injury during their stay. 7.1%
827% worse than State average

State average: 0.8%

Ability to care for self at discharge Info Percentage of residents at or above expected ability to care for themselves at discharge. 15.5%
71% worse than State average

State average: 53.7%

Successful return to home or community Info Rate of successful return to home or community from a skilled nursing facility. 38.7%
23% worse than State average

State average: 50.6%

Breakdown by payment type

Medicare

22% of new residents, usually for short-term rehab.

Typical stay 21 days

Private pay

69% of new residents, often for short stays.

Typical stay 10 - 11 months

Medicaid

10% of new residents, often for long-term daily care.

Typical stay 3 years

Facility Characteristics

Source: CMS Long-Term Care Facility Characteristics (Data as of Jan 2026)

Total residents 104
Medicare
5
4.8% of residents
Medicaid
41
39.4% of residents
Private pay or other
58
55.8% of residents
Programs & Services
Residents Group

Residents meet regularly to discuss policies, care quality, and activities

Family Member Group

Family members meet regularly to discuss policies, care quality, and activities

Nurse Aide Training

State-approved Nurse Aide Training and Competency Evaluation Program on-site

Active Family Council

Organized group of family members that meets regularly to discuss facility policies, resident care, and activities.

Active Resident Council

Organized group of residents that meets regularly to discuss facility policies, quality of life, and activities.

Finances and operations

Based on CMS SNF Cost Report for fiscal year ending in 06/2024.

Nonprofit
Nonprofit Corporation
Net patient revenue Info Net patient revenue — what the home actually collects for resident care, after contractual allowances, bad debt and discounts are subtracted from its gross charges (CMS cost report, Worksheet G-3). It covers resident care only; money the home earns from other sources is shown separately as "Other income."
$86.7M
Net patient income Info Net patient income: net patient revenue minus the home's total operating expenses. A positive figure means it earns more from resident care than it spends to deliver it; a negative figure means the opposite. It excludes non-operating "other income."
-$32.2M
Nonprofit Nonprofit Corporation
Net patient revenue Info Net patient revenue — what the home actually collects for resident care, after contractual allowances, bad debt and discounts are subtracted from its gross charges (CMS cost report, Worksheet G-3). It covers resident care only; money the home earns from other sources is shown separately as "Other income."
$86.7M Rank #1 / 40Revenue — State benchmarkedThis home is ranked 1st out of 40 homes in Maine. Shows this facility's annual revenue compared to the Maine average. Higher revenue generally means more resources for staffing and capital — read alongside Payroll %.Rankings are based only on facilities in Maine that report data for that category. Facilities without available data are excluded from the ranking.Click the rank badge to see the full State ranking.Click here to see the full State ranking.
Net patient income Info Net patient income: net patient revenue minus the home's total operating expenses. A positive figure means it earns more from resident care than it spends to deliver it; a negative figure means the opposite. It excludes non-operating "other income."
-$32.2M
Other income Info Money the home earns outside of resident care — such as investments, grants, rentals and other non-operating sources (CMS cost report, Worksheet G-3). It is tracked separately from net patient revenue: it is not part of that figure, and it is not included in net patient income.
$25.9M
Payroll costs Info Staff salaries plus wage-related costs — benefits such as payroll taxes, health insurance and retirement — from the home's own accounting records (CMS cost report, Worksheet A). Contract or agency labor is counted separately, under other operating costs. Rank #9 / 40Payroll — State benchmarkedThis home is ranked 9th out of 40 homes in Maine. Shows total annual staff payroll benchmarked to the Maine average. Higher payroll investment relative to peers often signals better staffing and less reliance on cheaper contract labor.Rankings are based only on facilities in Maine that report data for that category. Facilities without available data are excluded from the ranking.Click the rank badge to see the full State ranking.Click here to see the full State ranking.
$10.9M 12.5% of net patient revenue Info Payroll as a share of revenue: staff salaries and wage-related benefits divided by net patient revenue. A higher figure means more of each revenue dollar goes to staff pay. Rank #40 / 40Payroll % — State benchmarkedThis home is ranked 40th out of 40 homes in Maine. Shows payroll as a percentage of revenue versus the Maine average. Well-run Maine facilities typically land around 60–66% — the top third Statewide. Below 25% may signal understaffing or heavy agency use — read with Staffing ratings.Rankings are based only on facilities in Maine that report data for that category. Facilities without available data are excluded from the ranking.Click the rank badge to see the full State ranking.Click here to see the full State ranking.
Other operating costs Info Everything it costs to run the home apart from payroll — food, utilities, supplies, maintenance, contract labor and administration. Calculated as total operating expense minus payroll (staff salaries and wage-related benefits).
$108.0M
Total costs Info The home's total operating expense for the year — all the costs of running it, salaries included (CMS cost report, Worksheet G-3).
$118.9M

What does this home offer?

Building type icon
Building type icon

Building Type: Single-story

Transportation services icon

Transportation Services

Fitness and recreation icon

Fitness and Recreation

Who this home usually serves

TYPE OF STAY

Primarily short stays

Residents typically stay for brief periods, with frequent admissions and discharges throughout the year.

Most new residents arrive under private pay (69% of admissions), and a typical private pay stay runs around 10 - 11 months.

Admissions
156 total

Coverage residents most often arrive under.

Medicare 22%
Private pay 69%
Medicaid 10%
Discharges
146 total

Coverage residents most often leave under.

Medicare 11%
Private pay 73%
Medicaid 16%

Managed by Patty Nutting

Administrator

Patty Nutting serves as the Administrator at Maine Veterans' Homes - Scarborough. She leads a vibrant, resident-driven community where Veterans actively participate in planning menus and activities. Under her leadership, the facility prides itself on being the first nursing home in Maine to receive the National Gold Award for Excellence in Quality from the American Health Care Association.

Places of interest near Maine Veterans’ Homes – Scarborough

Address 0.4 miles from city center Info Estimated distance in miles from Scarborough's city center to Maine Veterans’ Homes – Scarborough's address, calculated via Google Maps.

Calculate Travel Distance to Maine Veterans’ Homes – Scarborough

Add your location

Address

Compare Nursing Homes around the area

The information below is reported by the Maine Department of Health and Human Services, Division of Licensing and Certification.

Maine Veterans’ Homes – Scarborough
NH
AL
MC
RC
Scarborough (Oak Hill) -120 - 41 -
Memory Care at Market Square
NH
MC
South Paris -76 - 40 Semi-Private Rooms
Mount Joseph at Waterville
NH
HC
IL
NC
PC
Waterville (Highwood Street) -111 A+ 36 -
Woodlands Senior Living of Hallowell
NH
AL
MC
RC
Hallowell (Winthrop Street) -51 - 9 -
Seal Cove
NH
AL
Ellsworth -90 - 69 -

Frequently Asked Questions about Maine Veterans’ Homes – Scarborough

What neighborhood is Maine Veterans’ Homes – Scarborough in?

Maine Veterans’ Homes – Scarborough is in the Oak Hill neighborhood.

Is Maine Veterans’ Homes – Scarborough in a walkable area?

Maine Veterans’ Homes – Scarborough has a walk score of 41. Somewhat walkable. A few nearby services may be reachable on foot, but most trips require transportation.

What is the occupancy rate at Maine Veterans’ Homes – Scarborough?

Maine Veterans’ Homes – Scarborough's occupancy is 92.7%.

Does Maine Veterans’ Homes – Scarborough operate as a for-profit or non-profit?

Maine Veterans’ Homes – Scarborough is registered as a non-profit.

Are there photos of Maine Veterans’ Homes – Scarborough?

Yes — there are 3 photos of Maine Veterans’ Homes – Scarborough in the photo gallery on this page.

What is the address of Maine Veterans’ Homes – Scarborough?

Maine Veterans’ Homes – Scarborough is located at 290 Us-1, Scarborough, ME 04074.

What is the phone number of Maine Veterans’ Homes – Scarborough?

(207) 883-7184 will put you in contact with the team at Maine Veterans’ Homes – Scarborough.

Guides for Better Senior Living

Care Cost Calculator: See Prices in Your Area

Nursing Home Data Explorer

Don’t Wait Too Long: 7 Red Flag Signs Your Parent Needs Assisted Living Now

The True Cost of Assisted Living in 2025 – And How Families Are Paying For It

Understanding Senior Living Costs: Pricing Models, Discounts & Financial Assistance