Majestic Care of Flushing Assisted Living
Nursing Home & Assisted Living · Flushing, MI
CMS overall rating Info CMS (the Centers for Medicare & Medicaid Services) is the federal agency that rates nursing home quality. Its Overall Rating runs from 1 to 5 stars, combining health inspections, staffing, and quality measures, with inspections weighted most heavily.

Majestic Care of Flushing Assisted Living

Nursing Home & Assisted Living · Flushing, MI
CMS overall rating Info CMS (the Centers for Medicare & Medicaid Services) is the federal agency that rates nursing home quality. Its Overall Rating runs from 1 to 5 stars, combining health inspections, staffing, and quality measures, with inspections weighted most heavily.
Calculator: See prices in your area
Majestic Care of Flushing Assisted Living accepts Medicare, Medicaid, and private pay.

Overview of Majestic Care of Flushing Assisted Living

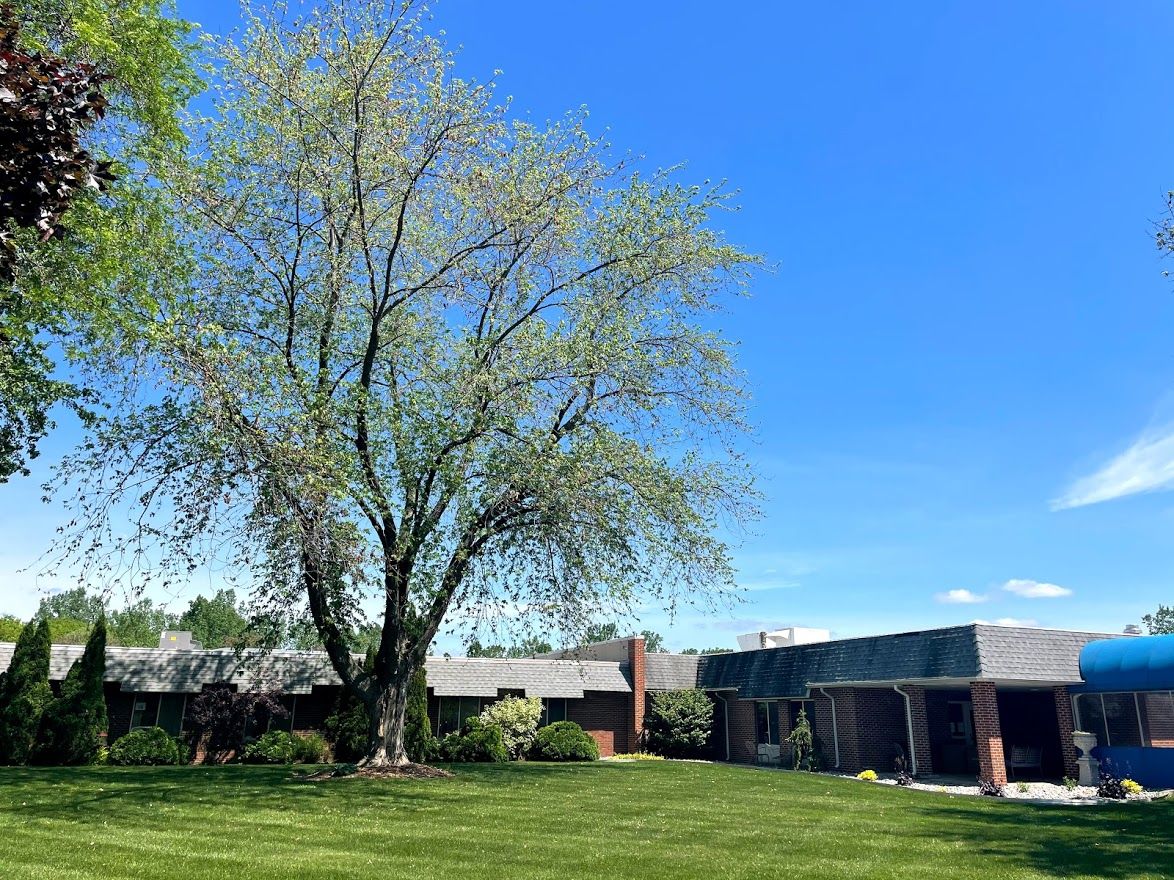
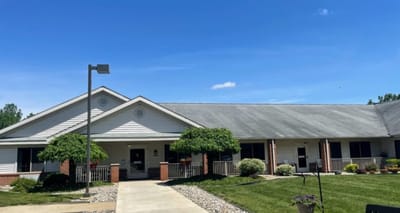
Burrowed in the serene neighborhood of Flushing, MI, Majestic Care of Flushing Assisted Living is a dedicated senior living community offering independent living, assisted living, memory care, and other diverse care services. With 36 Majestic Care Locations in throughout Indiana, Ohio, and Michigan, the community assures its residents with a service-enriched set of programs and services through its highly-equipped and compassionate team.

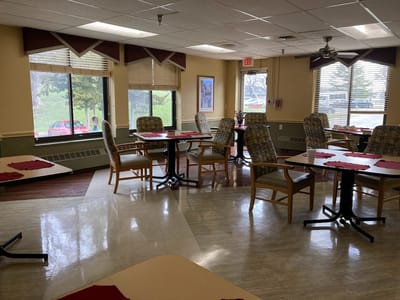
Discover its top-notch services including short-term rehabilitation, physical therapy, occupational therapy, speech therapy, outpatient therapy, memory care, and many more. Expore its amazing common spaces and meet new friends along the way. Engage in a robust calendar of social activities, wellness programs, and community events to boost engagement and health. With the Majestic Care of Flushing Assisted Living seniors can acquire the utmost care and support.

Quality ratings

Measured by Centers for Medicare & Medicaid Services (CMS)

Overall rating Info The Overall CMS Rating combines results from health inspections, staffing levels and quality measures. Health inspections carry the most weight. Staffing and quality scores can increase or decrease the final rating based on performance compared to state and national standards.
Health Inspection Info Based on the results of the facility's three most recent standard inspections and any complaint investigations. CMS reviews the number, scope, and severity of deficiencies, with more recent findings weighted more heavily.
Staffing Info Measures average nursing staff hours per resident per day, including Registered Nurses (RNs) and total nursing staff. Ratings are adjusted based on the level of care residents require and are compared to state and national benchmarks.
Quality Measures Info Based on clinical and physical health indicators reported to CMS, such as hospital readmissions, falls, pressure ulcers, and improvements in mobility. These measures reflect how well residents' health needs are being managed.

Staffing hours breakdown

Info Daily nursing hours per resident by staff type, reported to CMS. Higher is generally better — compare this facility to state and national averages to see where staffing stands.

Hours per resident per day — compared to state averages

Total nursing care / resident Info Total adjusted nursing hours per resident per day, combining RN, LPN, and aide time. CMS adjusts this for case-mix so facilities can be fairly compared.
3h 8m per day
Rank #140 / 142Nurse hours — State benchmarkedThis home is ranked 140th out of 142 homes in Michigan. Shows adjusted nurse hours per resident per day benchmarked to the Michigan average, with a ranking across 142 Michigan facilities. More hours mean more direct care. The national average is about 3.5 hrs; below 3.0 is a red flag.Rankings are based only on facilities in Michigan that report data for that category. Facilities without available data are excluded from the ranking.Click the rank badge to see the full State ranking.Click here to see the full State ranking.
vs avg
Staff type Hours / Day / Resident vs state avg
Registered Nurse (RN) Info RNs hold the highest nursing license and can assess residents, interpret test results, and direct care plans. More RN hours per day often signals stronger clinical oversight and faster response to health changes. 20m per day
LPN / LVN Info Licensed Practical Nurses (LPNs) or Licensed Vocational Nurses (LVNs) deliver routine hands-on care — medication administration, wound dressing, and monitoring vital signs. They work under RN supervision and make up a large share of daily bedside care. 1h 4m per day
Nurse Aide Info Certified Nurse Aides (CNAs) provide the most direct day-to-day assistance: bathing, dressing, feeding, and mobility. Nurse aide hours are typically the largest staffing category and directly affect residents' quality of life. 2h 0m per day
Weekend Total Nursing Info Combined nursing hours (RN + LPN + Nurse Aide) per resident per day on weekends. Staffing often drops on weekends — this figure reveals whether the facility maintains adequate coverage outside of weekday hours. 3h 1m per day
Physical Therapist Info Hours per resident per day provided by licensed Physical Therapists (PTs) or PT Assistants. PT services help residents recover mobility after injury or illness and are especially important for post-acute (short-stay) rehabilitation. 3m per day
Weekend RN Info Registered nurse hours specifically on weekends. Facilities sometimes reduce RN presence on Saturdays and Sundays — a low weekend RN figure compared to weekday hours can indicate reduced clinical oversight when most administrative staff are absent. 15m per day

Capacity and availability

Avg. Length of Stay
107 days
Bed community size
40-bed community Rank #290 / 435Bed count — State benchmarkedThis home is ranked 290th out of 435 homes in Michigan. Shows this facility's certified or reported bed count compared to other Michigan facilities. Larger communities may offer more amenities, programs, and on-site services for residents and families.Rankings are based only on facilities in Michigan that report data for that category. Facilities without available data are excluded from the ranking.Click the rank badge to see the full State ranking.Click here to see the full State ranking.
A moderately sized community that may balance personal attention with shared amenities and social activities.
Years in operation
5 years in operation Rank #130 / 182Years in operation — State benchmarkedThis home is ranked 130th out of 182 homes in Michigan. Shows how long this facility has been in operation compared to other Michigan facilities. Longer operating histories may benefit residents, families, and staff.Rankings are based only on facilities in Michigan that report data for that category. Facilities without available data are excluded from the ranking.Click the rank badge to see the full State ranking.Click here to see the full State ranking.
An established community with some operational experience and growing routines.
Walk Score
Walk Score: 5 / 100 Rank #647 / 703Walk Score — State benchmarkedThis home is ranked 647th out of 703 homes in Michigan. Shows how walkable this facility's neighborhood is compared to the average Walk Score across Michigan facilities. Higher scores benefit residents, families, and staff.Rankings are based only on facilities in Michigan that report data for that category. Facilities without available data are excluded from the ranking.Click the rank badge to see the full State ranking.Click here to see the full State ranking.
Car-dependent. Most errands require a car, with limited nearby walkable options.
BBB Rating
BBB Rating: A+ (Not Accredited)
An independent rating from the Better Business Bureau based on factors such as complaint history, transparency, and business practices.
How BBB ratings work

About this community

License Details

Facility TypeHomes For The Aged
StatusRegular
IssuanceAugust 1, 2026
ExpirationJuly 31, 2027
CountyGenesee
License NumberAH250408318

Ownership & Operating Entity

Majestic Care of Flushing Assisted Living is legally operated by Flushing AL Operations LLC.

Safety & Compliance

Emergency SystemsYes
Safety Features24/7 security and an emergency call system.

Staffing

Key information about the people who lead and staff this community.

Leadership

ContactMr. Don Kump, CFO

Therapy & Rehabilitation

2 services
Rehabilitation Services
Respite Care

Staffing & Medical

2 services
Nursing Services
24-Hour Staffing

Amenities & Lifestyle

Deliciously Prepared Meals
Meaningful Life Enrichment Activities
On-Site Licensed Nurse Availability
Beautifully Appointed Residential Options
Assistance With Activities Of Daily Living
Culture Of Gracious Hospitality And Care
Housekeeping
Laundry And Household Maintenance
Outdoor Patio And Garden Areas
ActivitiesMultiple educational, cultural, social, and recreational activities are offered every day
Specific ProgramsOutpatient Therapy, Behavioral Health, Dialysis Care, Aquatic Therapy, Home Health, Pediatric Care, Child Care
Operating Hours24/7

Contact Majestic Care of Flushing Assisted Living

Inspection History

In Michigan, the Department of Licensing and Regulatory Affairs (LARA) conducts unannounced inspections and investigations to ensure long-term care facilities comply with state health codes.

Since 2021 · 5 years of data 3 deficiencies 5 inspections

Inspection Scorecard Info This scorecard compares key inspection, deficiency, and complaint metrics at this facility against the Michigan state average. Metrics rated ≥15% worse than average are highlighted in red; those ≥15% better are highlighted in green.

Since 2021 vs. Michigan state average
Overall vs. MI average 0 Worse No metrics in this bucket. 1 At Avg Metrics at Michigan average:
• Total inspections (at MI avg)
3 Better Metrics better than Michigan average:
• Total deficiencies (63% below)
• Deficiencies per year (63% below)
• Deficiencies per inspection (63% below)
Latest Inspection June 4, 2024 Complaint Investigation

Deficiencies Info Deficiencies are formal regulatory issues recorded during state inspections.

This Facility MI Average vs. MI Avg
Total deficiencies Info Formal regulatory issues recorded by inspectors across all inspection types. 3 8 This facility has 63% fewer total deficiencies than a typical Michigan assisted living residence (3 vs. MI avg 8).↓ 63% better
Deficiencies per year Info Average deficiencies per year since 2021. 0.6 1.6 This facility has 63% fewer deficiencies per year than a typical Michigan assisted living residence (0.6 vs. MI avg 1.6).↓ 63% better
Deficiencies per inspection Info Average deficiencies per inspection. 0.6 1.6 This facility has 63% fewer deficiencies per inspection than a typical Michigan assisted living residence (0.6 vs. MI avg 1.6).↓ 63% better

Inspections Info State inspections evaluate whether the facility meets health and safety standards.

This Facility MI Average vs. MI Avg
Total inspections Info Combined count of all routine and focused inspections. Excludes complaint investigations. 5 5 This facility has total inspections in line with the Michigan average (5 vs. MI avg 5).— At avg

Inspection Reports Summary Info An editor-reviewed summary of the themes and findings across this facility's recent inspection reports.

  • The June 4, 2024 complaint investigation found no violation of care for the Resident of Concern, though service plans were not updated to reflect current resident needs.
  • The October 18, 2022 complaint investigation substantiated incomplete medication administration records for one resident but found no evidence of understaffing or improper charges.
  • The facility’s license was renewed on February 26, 2024 after an administrative review confirmed substantial compliance with public health code and regulations.

Health Inspection History

Inspections since 2023
Total health inspections 11

State average N/A


Last Health inspection on Aug 2025

Total health citations
63 Rank #127 / 144Health citations — State benchmarkedThis home is ranked 127th out of 144 homes in Michigan. Shows this facility's total health deficiency citations benchmarked to the Michigan State average, with a ranking across all 144 MI facilities. Lower citation counts earn a better rank.Rankings are based only on facilities in Michigan that report data for that category. Facilities without available data are excluded from the ranking.Click the rank badge to see the full State ranking.Click here to see the full State ranking.

State average N/A

Citations per inspection
5.73 Rank #87 / 144Citations per inspection — State benchmarkedThis home is ranked 87th out of 144 homes in Michigan. Shows average deficiency citations per CMS inspection for this facility versus the Michigan mean across 144 facilities with citation data. Lower is better.Rankings are based only on facilities in Michigan that report data for that category. Facilities without available data are excluded from the ranking.Click the rank badge to see the full State ranking.Click here to see the full State ranking.

State average N/A


Health citations are formal notices following inspections when they fail to comply with safety and care standards.

45 of 63 citations resulted from standard inspections; 14 of 63 resulted from complaint investigations; and 4 of 63 came from combined inspections (standard and complaint).

Breakdown of citation severity (last 3 years)
Critical health citations
0
In line with State average

State average: N/A


Serious health citations
9
In line with State average

State average: N/A

0 critical citations State average: N/A

9 serious citations State average: N/A

54 moderate citations State average: N/A

0 minor citations State average: N/A
Citations history (last 3 years)
Quality of Care serious citation Aug 22, 2025
Corrected

Quality of Care moderate citation Aug 22, 2025
Corrected

Environmental moderate citation Jun 05, 2025
Corrected

Infection Control moderate citation Jun 05, 2025
Corrected

Staffing Data

Reporting period: October 1 – December 31, 2025 (Q4 2025). Source: CMS Payroll-Based Journal report.

Total staff 134
Employees 120
Contractors 14
Staff to resident ratio 1.47 : 1
0% compared with State average

State average ratio: 0 : 0

Avg staff/day 56
Average shift 7.6 hours
0% compared with State average

State average: 0 hours

Total staff hours (quarter) 39,402

Nursing staff breakdown

Q4 2025 · Oct 1 – Dec 31 More info This data comes from the CMS Payroll-Based Journal report covering October 1 – December 31, 2025.
Registered Nurse

Manages medical care and health needs.

RN Staff Info All 7 RN Staff are full-time employees. No contractors work on this role. 7
Average shift length Info Average shift length. Calculated as total hours divided by days worked and average staff per day. 9.5 hours
Licensed Practical Nurse

Assists with medical care and medications.

LPN Staff Info All 32 LPN Staff are full-time employees. No contractors work on this role. 32
Average shift length Info Average shift length. Calculated as total hours divided by days worked and average staff per day. 8.7 hours
Certified Nursing Assistant

Helps with daily care and mobility.

CNA Staff Info All 61 CNA Staff are full-time employees. No contractors work on this role. 61
Average shift length Info Average shift length. Calculated as total hours divided by days worked and average staff per day. 7.1 hours

Contractor staffing

Q4 2025 · Oct 1 – Dec 31 More info This data comes from the CMS Payroll-Based Journal report covering October 1 – December 31, 2025.

Total hours from contractors

7.8%

3,073 contractor hours this quarter

Physical Therapy Assistant: 3 Physical Therapy Aide: 2 Speech Language Pathologist: 2 Respiratory Therapy Technician: 2 Occupational Therapy Aide: 2 Qualified Social Worker: 1 Feeding Assistant: 1 Medical Director: 1

Staff by category

Q4 2025 · Oct 1 – Dec 31 More info This data comes from the CMS Payroll-Based Journal report covering October 1 – December 31, 2025.
Certified Nursing Assistant 61 0 61 19,583 92 100% 7.1
Licensed Practical Nurse 32 0 32 8,234 92 100% 8.7
RN Director of Nursing 5 0 5 2,225 77 84% 9.4
Registered Nurse 7 0 7 2,114 90 98% 9.5
Other Dietary Services Staff 3 0 3 1,004 90 98% 7.1
Clinical Nurse Specialist 4 0 4 659 74 80% 7.2
Mental Health Service Worker 2 0 2 601 70 76% 7.2
Speech Language Pathologist 0 2 2 567 78 85% 7.1
Dental Services Staff 3 0 3 559 65 71% 7.3
Nurse Practitioner 1 0 1 512 64 70% 8
Dietitian 1 0 1 487 63 68% 7.7
Physical Therapy Assistant 0 3 3 473 77 84% 5.8
Qualified Social Worker 0 1 1 455 63 68% 7.2
Respiratory Therapy Technician 0 2 2 452 63 68% 7.2
Physical Therapy Aide 0 2 2 446 62 67% 7.2
Feeding Assistant 0 1 1 360 24 26% 15
Administrator 1 0 1 352 44 48% 8
Occupational Therapy Aide 0 2 2 263 47 51% 5
Medical Director 0 1 1 57 25 27% 2.3
61 Certified Nursing Assistant
% of Days 100%
32 Licensed Practical Nurse
% of Days 100%
5 RN Director of Nursing
% of Days 84%
7 Registered Nurse
% of Days 98%
3 Other Dietary Services Staff
% of Days 98%
4 Clinical Nurse Specialist
% of Days 80%
2 Mental Health Service Worker
% of Days 76%
2 Speech Language Pathologist
% of Days 85%
3 Dental Services Staff
% of Days 71%
1 Nurse Practitioner
% of Days 70%
1 Dietitian
% of Days 68%
3 Physical Therapy Assistant
% of Days 84%
1 Qualified Social Worker
% of Days 68%
2 Respiratory Therapy Technician
% of Days 68%
2 Physical Therapy Aide
% of Days 67%
1 Feeding Assistant
% of Days 26%
1 Administrator
% of Days 48%
2 Occupational Therapy Aide
% of Days 51%
1 Medical Director
% of Days 27%

Penalties and fines

Includes penalties issued in 2024-2025

Federal penalties imposed by CMS for regulatory violations, including civil money penalties (fines) and denials of payment for new Medicare/Medicaid admissions.

Source: CMS Penalties Database (Data as of Jan 2026)

Total fines amount $270K Rank #137 / 145Federal fines — State benchmarkedThis home is ranked 137th out of 145 homes in Michigan. Shows this facility's cumulative CMS federal fine dollars versus the Michigan average among facilities with fines, and where it ranks among 145 facilities in the pool. Lower total dollars mean a better rank.Rankings are based only on facilities in Michigan that report data for that category. Facilities without available data are excluded from the ranking.Click the rank badge to see the full State ranking.Click here to see the full State ranking.
255% higher than State average

State average: $76K

Number of fines 4
98% more fines than State average

State average: 2.0

Payment Denials Info Serious action where Medicare and/or Medicaid temporarily stops payments for new residents until issues are fixed. 2
137% more payment denials than State average

State average: 0.8

Fines amount comparison
This facility $270K
State average $76K
Penalty History

Penalties are imposed by CMS for violations of federal nursing home regulations.

4 penalties in the past 3 years

Multiple penalties were reported in the last 3 years.

Civil Money Penalty Info Fines imposed for noncompliance, which can be assessed per day or per instance of violation. May 8, 2025
$85K
Civil Money Penalty Info Fines imposed for noncompliance, which can be assessed per day or per instance of violation. May 22, 2024
$65K
Payment Denial Info Serious action where Medicare and/or Medicaid temporarily stops payments for new residents until issues are fixed. May 22, 2024
12 days
Civil Money Penalty Info Fines imposed for noncompliance, which can be assessed per day or per instance of violation. Feb 22, 2024
$20K

Last updated: Jan 2026

Quality of care over time

These measures show how residents usually do over time at this home, based on health outcomes and preventive care.

High-risk clinical events score Info A composite score based on pressure ulcers, falls with injury, weight loss, walking ability decline, and activities of daily living decline. 3.7
56% better than State average

State average: 8.4

Functional decline score Info A composite score based on activities of daily living decline, walking ability decline, and incontinence. 11.7
29% better than State average

State average: 16.3

Long-stay resident measures
Need for Help with Daily Activities Increased Info Percent of long-stay residents whose need for help with daily activities has increased 4.2%
66% better than State average

State average: 12.5%

Walking Ability Worsened Info Percent of long-stay residents whose ability to move independently worsened 4.2%
72% better than State average

State average: 15.3%

Low Risk Residents with Bowel/Bladder Incontinence Info Percent of low risk long-stay residents who lose control of their bowels or bladder 26.5%
26% worse than State average

State average: 21.0%

Falls with Major Injury Info Percent of long-stay residents experiencing one or more falls with major injury 2.6%
17% better than State average

State average: 3.2%

High Risk Residents with Pressure Ulcers Info Percent of long-stay high risk residents with pressure ulcers 1.8%
68% better than State average

State average: 5.7%

Urinary Tract Infection Info Percent of long-stay residents with a urinary tract infection 0.7%
60% better than State average

State average: 1.7%

Lost Too Much Weight Info Percent of long-stay residents who lose too much weight 5.7%
In line with State average

State average: 5.7%

Depressive Symptoms Info Percent of long-stay residents who have depressive symptoms 6.5%
68% worse than State average

State average: 3.9%

Antipsychotic Use Info Percent of long-stay residents who received an antipsychotic medication 4.6%
69% better than State average

State average: 15.0%

Pneumococcal Vaccine Info Percent of long-stay residents assessed and appropriately given the pneumococcal vaccine 97.7%
In line with State average

State average: 94.9%

Influenza Vaccine Info Percent of long-stay residents assessed and appropriately given the seasonal influenza vaccine 95.5%
In line with State average

State average: 95.0%

Short-stay resident measures
Pneumococcal Vaccine Info Percent of short-stay residents assessed and appropriately given the pneumococcal vaccine 70.6%
14% worse than State average

State average: 82.5%

Antipsychotic medication increase Info Percent of short-stay residents who newly received an antipsychotic medication 0.8%
46% better than State average

State average: 1.4%

Influenza Vaccine Info Percent of short-stay residents assessed and appropriately given the seasonal influenza vaccine 75.2%
5% worse than State average

State average: 79.5%

Breakdown by payment type

Medicare

28% of new residents, usually for short-term rehab.

Typical stay 28 days

Private pay

51% of new residents, often for short stays.

Typical stay 1 - 2 months

Medicaid

21% of new residents, often for long-term daily care.

Typical stay 1 years

Facility Characteristics

Source: CMS Long-Term Care Facility Characteristics (Data as of Jan 2026)

Total residents 91
Medicare
8
8.8% of residents
Medicaid
73
80.2% of residents
Private pay or other
10
11% of residents
Programs & Services
Residents Group

Residents meet regularly to discuss policies, care quality, and activities

Active Resident Council

Organized group of residents that meets regularly to discuss facility policies, quality of life, and activities.

Finances and operations

Based on CMS SNF Cost Report for fiscal year ending in 12/2023.

For-profit
Corporation
Net patient revenue Info Net patient revenue — what the home actually collects for resident care, after contractual allowances, bad debt and discounts are subtracted from its gross charges (CMS cost report, Worksheet G-3). It covers resident care only; money the home earns from other sources is shown separately as "Other income."
$10.0M
Net patient income Info Net patient income: net patient revenue minus the home's total operating expenses. A positive figure means it earns more from resident care than it spends to deliver it; a negative figure means the opposite. It excludes non-operating "other income."
-$1.5M
For-profit Corporation
Net patient revenue Info Net patient revenue — what the home actually collects for resident care, after contractual allowances, bad debt and discounts are subtracted from its gross charges (CMS cost report, Worksheet G-3). It covers resident care only; money the home earns from other sources is shown separately as "Other income."
$10.0M Rank #119 / 143Revenue — State benchmarkedThis home is ranked 119th out of 143 homes in Michigan. Shows this facility's annual revenue compared to the Michigan average. Higher revenue generally means more resources for staffing and capital — read alongside Payroll %.Rankings are based only on facilities in Michigan that report data for that category. Facilities without available data are excluded from the ranking.Click the rank badge to see the full State ranking.Click here to see the full State ranking.
Net patient income Info Net patient income: net patient revenue minus the home's total operating expenses. A positive figure means it earns more from resident care than it spends to deliver it; a negative figure means the opposite. It excludes non-operating "other income."
-$1.5M
Other income Info Money the home earns outside of resident care — such as investments, grants, rentals and other non-operating sources (CMS cost report, Worksheet G-3). It is tracked separately from net patient revenue: it is not part of that figure, and it is not included in net patient income.
$157.4K
Payroll costs Info Staff salaries plus wage-related costs — benefits such as payroll taxes, health insurance and retirement — from the home's own accounting records (CMS cost report, Worksheet A). Contract or agency labor is counted separately, under other operating costs. Rank #101 / 143Payroll — State benchmarkedThis home is ranked 101st out of 143 homes in Michigan. Shows total annual staff payroll benchmarked to the Michigan average. Higher payroll investment relative to peers often signals better staffing and less reliance on cheaper contract labor.Rankings are based only on facilities in Michigan that report data for that category. Facilities without available data are excluded from the ranking.Click the rank badge to see the full State ranking.Click here to see the full State ranking.
$4.5M 44.9% of net patient revenue Info Payroll as a share of revenue: staff salaries and wage-related benefits divided by net patient revenue. A higher figure means more of each revenue dollar goes to staff pay. Rank #36 / 143Payroll % — State benchmarkedThis home is ranked 36th out of 143 homes in Michigan. Shows payroll as a percentage of revenue versus the Michigan average. Well-run Michigan facilities typically land around 49–59% — the top third Statewide. Below 25% may signal understaffing or heavy agency use — read with Staffing ratings.Rankings are based only on facilities in Michigan that report data for that category. Facilities without available data are excluded from the ranking.Click the rank badge to see the full State ranking.Click here to see the full State ranking.
Other operating costs Info Everything it costs to run the home apart from payroll — food, utilities, supplies, maintenance, contract labor and administration. Calculated as total operating expense minus payroll (staff salaries and wage-related benefits).
$7.0M
Total costs Info The home's total operating expense for the year — all the costs of running it, salaries included (CMS cost report, Worksheet G-3).
$11.5M

What does this home offer?

Housing options icon

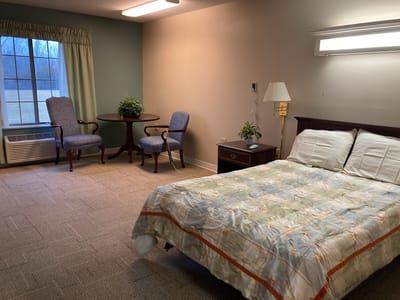
Housing Options: Studio

Building type icon
Building type icon

Building Type: Single-story

Transportation services icon

Transportation Services

Fitness and recreation icon

Fitness and Recreation

Who this home usually serves

TYPE OF STAY

Mix of rehab and long-term care

This home supports both short-term rehab and long-term care, with residents staying for a wide range of durations.

Most new residents arrive under private pay (51% of admissions), and a typical private pay stay runs around 1 - 2 months.

Admissions
293 total

Coverage residents most often arrive under.

Medicare 28%
Private pay 51%
Medicaid 21%
Discharges
296 total

Coverage residents most often leave under.

Medicare 16%
Private pay 49%
Medicaid 34%

Places of interest near Majestic Care of Flushing Assisted Living

Address 1.9 miles from city center Info Estimated distance in miles from Flushing's city center to Majestic Care of Flushing Assisted Living's address, calculated via Google Maps.

Calculate Travel Distance to Majestic Care of Flushing Assisted Living

Add your location

Address

Compare Nursing Homes around the area

The information below is reported by the Michigan Department of Licensing and Regulatory Affairs (LARA).

Majestic Care of Flushing Assisted Living
NH
AL
Flushing - 40 A+ 5 Studio
Covenant Living of the Great Lakes
NH
AL
MC
RC
Grand Rapids (Westside Connection) - 102 A+ 35 1 Bed / 2 Bed

Frequently Asked Questions about Majestic Care of Flushing Assisted Living

Who is the owner of Majestic Care of Flushing Assisted Living?

Majestic Care of Flushing Assisted Living is legally operated by Flushing AL Operations LLC.

Is Majestic Care of Flushing Assisted Living in a walkable area?

Majestic Care of Flushing Assisted Living has a walk score of 5. Car-dependent. Most errands require a car, with limited nearby walkable options.

What is the license number of Majestic Care of Flushing Assisted Living?

According to MI state health department records, Majestic Care of Flushing Assisted Living's license number is AH250408318.

When does Majestic Care of Flushing Assisted Living's license expire?

According to MI state health department records, Majestic Care of Flushing Assisted Living's license expires on July 31, 2027.

What is the occupancy rate at Majestic Care of Flushing Assisted Living?

Majestic Care of Flushing Assisted Living's occupancy is 61.8%.

Does Majestic Care of Flushing Assisted Living operate as a for-profit or non-profit?

Majestic Care of Flushing Assisted Living is registered as a for-profit in MI.

How many beds does Majestic Care of Flushing Assisted Living have?

Majestic Care of Flushing Assisted Living has 40 beds.

Guides for Better Senior Living

Care Cost Calculator: See Prices in Your Area

Nursing Home Data Explorer

Don’t Wait Too Long: 7 Red Flag Signs Your Parent Needs Assisted Living Now

The True Cost of Assisted Living in 2025 – And How Families Are Paying For It

Understanding Senior Living Costs: Pricing Models, Discounts & Financial Assistance