Mankato Lodge Senior Living
Nursing Home, Assisted Living, Independent Living & Respite Care · Mankato, MN
CMS overall rating Info CMS (the Centers for Medicare & Medicaid Services) is the federal agency that rates nursing home quality. Its Overall Rating runs from 1 to 5 stars, combining health inspections, staffing, and quality measures, with inspections weighted most heavily.

Mankato Lodge Senior Living

Nursing Home, Assisted Living, Independent Living & Respite Care · Mankato, MN
CMS overall rating Info CMS (the Centers for Medicare & Medicaid Services) is the federal agency that rates nursing home quality. Its Overall Rating runs from 1 to 5 stars, combining health inspections, staffing, and quality measures, with inspections weighted most heavily.
Calculator: See prices in your area
Mankato Lodge Senior Living accepts Medicare, Medicaid, and private pay.

Overview of Mankato Lodge Senior Living

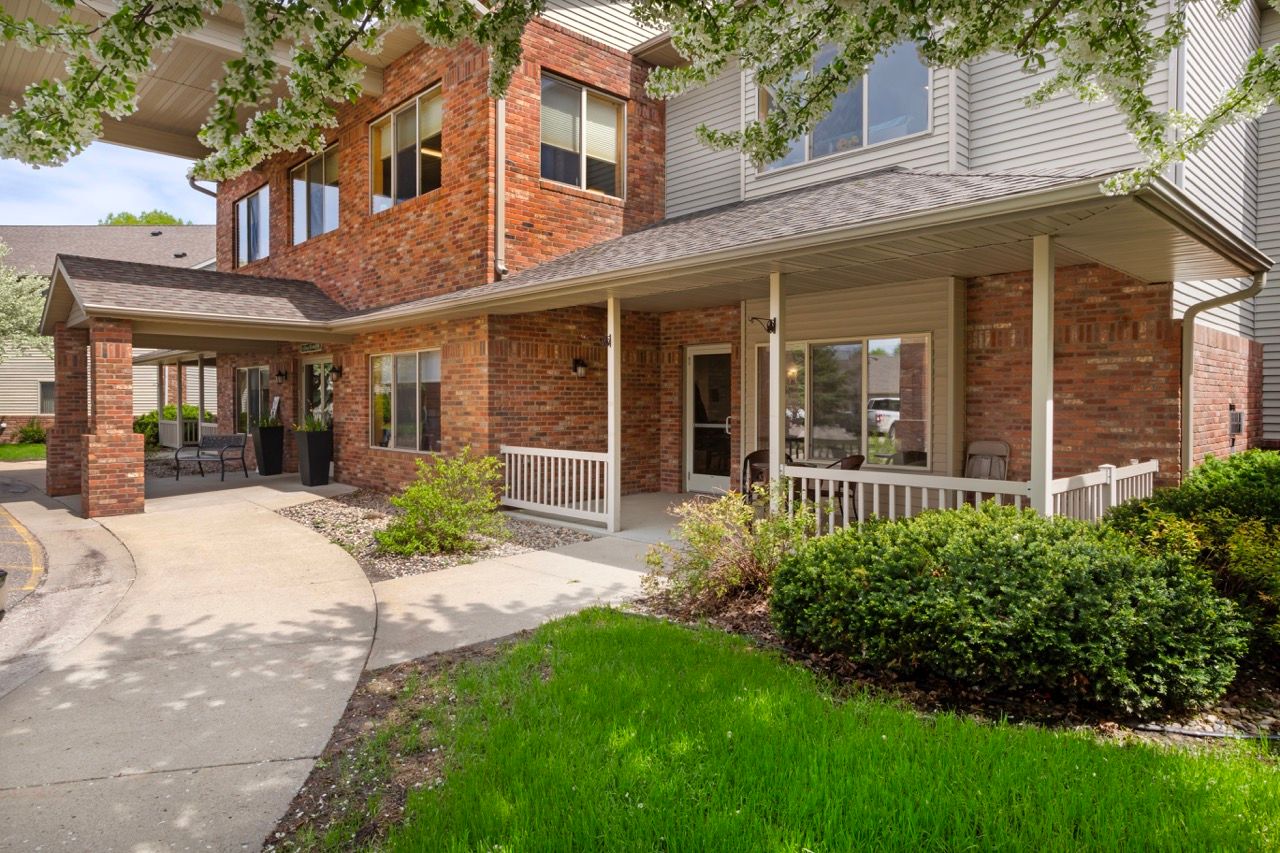
Located in Mankato, MN, Mankato Lodge Senior Living is a reliable senior living community that offers Independent Living, Assisted Living, and Respite Care. The community provides a serene retreat for seniors who wish to spend their golden years actively and independently. With an array of floor plans to choose from, including spacious studios, one-bedroom, and two-bedroom apartments, residents are sure to find the one that matches their needs. A dedicated and compassionate care team is available to provide various services designed to make residents’ lives easier.

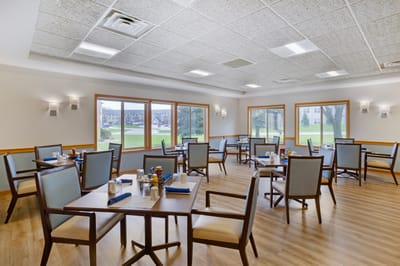
Understanding the challenges of aging, the community provides their Aging Experience program which stimulates what aging may feel like for seniors and educates families and their team more about it. An array of interesting social and leisure activities are available to provide residents opportunities for fun, relaxation, and building connections. The community’s culinary team works with a registered dietitian in creating menus and meals that cater to residents’ unique dietary and nutritional needs. Here, everyday living is made easier, so residents have plenty of time to enjoy a life full of leisure and fun.

Quality ratings

Measured by Centers for Medicare & Medicaid Services (CMS)

Overall rating Info The Overall CMS Rating combines results from health inspections, staffing levels and quality measures. Health inspections carry the most weight. Staffing and quality scores can increase or decrease the final rating based on performance compared to state and national standards.
▲ 57.2% Above MN avg. ▲ 57.2% Above MN avg.MN average: 3.2Click the badge to see the full State ranking.Click here to see the full State ranking.
Health Inspection Info Based on the results of the facility's three most recent standard inspections and any complaint investigations. CMS reviews the number, scope, and severity of deficiencies, with more recent findings weighted more heavily.
▲ 42.3% Above MN avg. ▲ 42.3% Above MN avg.MN average: 2.8Click the badge to see the full State ranking.Click here to see the full State ranking.
Staffing Info Measures average nursing staff hours per resident per day, including Registered Nurses (RNs) and total nursing staff. Ratings are adjusted based on the level of care residents require and are compared to state and national benchmarks.
▼ 2.3% Below MN avg. ▼ 2.3% Below MN avg.MN average: 4.1Click the badge to see the full State ranking.Click here to see the full State ranking.
Quality Measures Info Based on clinical and physical health indicators reported to CMS, such as hospital readmissions, falls, pressure ulcers, and improvements in mobility. These measures reflect how well residents' health needs are being managed.
▲ 59.9% Above MN avg. ▲ 59.9% Above MN avg.MN average: 3.1Click the badge to see the full State ranking.Click here to see the full State ranking.

Staffing hours breakdown

Info Daily nursing hours per resident by staff type, reported to CMS. Higher is generally better — compare this facility to state and national averages to see where staffing stands.

Hours per resident per day — compared to Minnesota state averages

Total nursing care / resident Info This home is ranked 20th out of 89 homes in Minnesota for nurse hours. Total adjusted nursing hours per resident per day, combining RN, LPN, and aide time. CMS adjusts this for case-mix so facilities can be fairly compared.
5h 10m per day
Rank #20 / 89Nurse hours — State benchmarkedThis home is ranked 20th out of 89 homes in Minnesota. Shows adjusted nurse hours per resident per day benchmarked to the Minnesota average, with a ranking across 89 Minnesota facilities. More hours mean more direct care. The national average is about 3.5 hrs; below 3.0 is a red flag.Rankings are based only on facilities in Minnesota that report data for that category. Facilities without available data are excluded from the ranking.Click the rank badge to see the full State ranking.Click here to see the full State ranking.
This facility Minnesota avg (4h 46m per day)
vs Minnesota avg
+8%

3 of 6 metrics below state avg

Standout metric Nurse Aide is +50% above state avg
Staff typeHours / Day / Residentvs state avg
Registered Nurse (RN) Info RNs hold the highest nursing license and can assess residents, interpret test results, and direct care plans. More RN hours per day often signals stronger clinical oversight and faster response to health changes. 26m per day ▼ 60% State avg: 1h 4m per day · National avg: 41m per day
LPN / LVN Info Licensed Practical Nurses (LPNs) or Licensed Vocational Nurses (LVNs) deliver routine hands-on care — medication administration, wound dressing, and monitoring vital signs. They work under RN supervision and make up a large share of daily bedside care. 54m per day ▲ 46% State avg: 37m per day · National avg: 52m per day
Nurse Aide Info Certified Nurse Aides (CNAs) provide the most direct day-to-day assistance: bathing, dressing, feeding, and mobility. Nurse aide hours are typically the largest staffing category and directly affect residents' quality of life. 3h 45m per day ▲ 50% State avg: 2h 30m per day · National avg: 2h 20m per day
Weekend Total Nursing Info Combined nursing hours (RN + LPN + Nurse Aide) per resident per day on weekends. Staffing often drops on weekends — this figure reveals whether the facility maintains adequate coverage outside of weekday hours. 4h 25m per day ▲ 21% State avg: 3h 40m per day · National avg: 3h 27m per day
Physical Therapist Info Hours per resident per day provided by licensed Physical Therapists (PTs) or PT Assistants. PT services help residents recover mobility after injury or illness and are especially important for post-acute (short-stay) rehabilitation. 3m per day ▼ 41% State avg: 5m per day · National avg: 4m per day
Weekend RN Info Registered nurse hours specifically on weekends. Facilities sometimes reduce RN presence on Saturdays and Sundays — a low weekend RN figure compared to weekday hours can indicate reduced clinical oversight when most administrative staff are absent. 13m per day ▼ 68% State avg: 41m per day · National avg: 29m per day

Capacity and availability

Avg. Length of Stay
582 days
Bed community size
70-bed community Rank #197 / 532Bed count — State benchmarkedThis home is ranked 197th out of 532 homes in Minnesota. Shows this facility's certified or reported bed count compared to other Minnesota facilities. Larger communities may offer more amenities, programs, and on-site services for residents and families.Rankings are based only on facilities in Minnesota that report data for that category. Facilities without available data are excluded from the ranking.Click the rank badge to see the full State ranking.Click here to see the full State ranking.
A moderately sized community that may balance personal attention with shared amenities and social activities.
Walk Score
Walk Score: 56 / 100 Rank #212 / 632Walk Score — State benchmarkedThis home is ranked 212th out of 632 homes in Minnesota. Shows how walkable this facility's neighborhood is compared to the average Walk Score across Minnesota facilities. Higher scores benefit residents, families, and staff.Rankings are based only on facilities in Minnesota that report data for that category. Facilities without available data are excluded from the ranking.Click the rank badge to see the full State ranking.Click here to see the full State ranking.
Moderately walkable. Some errands can be accomplished on foot, with a mix of nearby amenities.

About this community

Occupancy

Occupancy rate
97%
Rank #56 / 331Occupancy rate — State benchmarkedThis home is ranked 56th out of 331 homes in Minnesota. Shows this facility's occupancy rate versus the Minnesota average, with its Statewide rank out of 331. Higher occupancy signals strong local demand and financial stability.Rankings are based only on facilities in Minnesota that report data for that category. Facilities without available data are excluded from the ranking.Click the rank badge to see the full State ranking.Click here to see the full State ranking.
Higher than the Minnesota average: 79.7%
Occupied beds
68 / 70
Average occupied beds in Minnesota homes 59 beds

License Details

Facility TypeAssisted Living
StatusApproved
CountyBlue Earth

Performance summary

Key indicators of commitment to quality care and safety.

Ratings

Quality of Life Rating
3 / 5

Based on the Minnesota Department of Health, Health Regulation Division surveys measuring resident well-being and satisfaction.

Ranked 54th (tied) of 136 homes in Minnesota

Family Satisfaction Rating
3 / 5

Based on the Minnesota Department of Health, Health Regulation Division surveys measuring surveys of residents' family members.

Ranked 52nd (tied) of 123 homes in Minnesota

Scores

QoL Overall Satisfaction
68.8% Moderate

Based on the Minnesota Department of Health, Health Regulation Division surveys measuring resident well-being and satisfaction.

Minnesota average: 72.4%

Family Overall Satisfaction
72.4% Moderate

Based on the Minnesota Department of Health, Health Regulation Division surveys measuring surveys of residents' family members.

Minnesota average: 83.7%

Food Quality Score
80.6% High

Based on the Minnesota Department of Health, Health Regulation Division surveys measuring satisfaction with food quality and meal service.

Community Activities Score
78.8% Moderate

Based on the Minnesota Department of Health, Health Regulation Division surveys measuring meaningful activities and engagement opportunities.

Safety & Privacy Score
94.9% High

Based on the Minnesota Department of Health, Health Regulation Division surveys measuring safety and privacy conditions for residents.

Religion & Spirituality Score
94.0% High

Based on the Minnesota Department of Health, Health Regulation Division surveys measuring support for religious and spiritual needs.

Family Satisfaction - Care
69.3% Moderate

Based on the Minnesota Department of Health, Health Regulation Division surveys measuring family satisfaction with overall care experience.

Family Satisfaction - Cost
66.6% Moderate

Based on the Minnesota Department of Health, Health Regulation Division surveys measuring family satisfaction with value and cost of care.

Family Satisfaction - Housekeeping
77.9% Moderate

Based on the Minnesota Department of Health, Health Regulation Division surveys measuring family satisfaction with cleanliness and housekeeping.

Contact Mankato Lodge Senior Living

Inspection History

In Minnesota, the Department of Health, Health Regulation Division is the primary authority for conducting onsite inspections and reporting on the quality of care in residential facilities.

Since 2025 · 1 year of data 10 deficiencies

Inspection Scorecard Info This scorecard compares key inspection, deficiency, and complaint metrics at this facility against the Minnesota state average. Metrics rated ≥15% worse than average are highlighted in red; those ≥15% better are highlighted in green.

Since 2025 vs. Minnesota state average
Overall vs. MN average 0 Worse No metrics in this bucket. 2 At Avg Metrics at Minnesota average:
• Total deficiencies (at MN avg)
• Deficiencies per year (at MN avg)
0 Better No metrics in this bucket.
Latest Inspection September 18, 2025 Annual Inspection

Deficiencies Info Deficiencies are formal regulatory issues recorded during state inspections.

This FacilityMN Averagevs. MN Avg
Total deficiencies Info Formal regulatory issues recorded by inspectors across all inspection types. 1010 This facility has total deficiencies in line with the Minnesota average (10 vs. MN avg 10).— At avg
Deficiencies per year Info Average deficiencies per year since 2025. 1010 This facility has deficiencies per year in line with the Minnesota average (10 vs. MN avg 10).— At avg

Inspection Reports Summary Info An editor-reviewed summary of the themes and findings across this facility's recent inspection reports.

  • September 18, 2025 inspection found 10 deficiencies including food code violations, fire safety failures, medication errors, and incomplete resident assessments and service plans.
  • Medication management errors included failure to administer newly ordered pain medication for seven days, causing inadequate pain control after a resident’s hip fracture.
  • Staff training and competency were deficient, especially regarding notification to RN after a resident fall with injury, and fire-rated doors failed to close and latch properly.

Health Inspection History

Inspections since 2023
Total health inspections 3

Minnesota average 6


Last Health inspection on Aug 2025

Total health citations
3 Rank #1 / 90Health citations — State benchmarkedThis home is ranked 1st out of 90 homes in Minnesota. Shows this facility's total health deficiency citations benchmarked to the Minnesota State average, with a ranking across all 90 MN facilities. Lower citation counts earn a better rank.Rankings are based only on facilities in Minnesota that report data for that category. Facilities without available data are excluded from the ranking.Click the rank badge to see the full State ranking.Click here to see the full State ranking.

Minnesota average 23.2

Citations per inspection
1 Rank #1 / 90Citations per inspection — State benchmarkedThis home is ranked 1st out of 90 homes in Minnesota. Shows average deficiency citations per CMS inspection for this facility versus the Minnesota mean across 90 facilities with citation data. Lower is better.Rankings are based only on facilities in Minnesota that report data for that category. Facilities without available data are excluded from the ranking.Click the rank badge to see the full State ranking.Click here to see the full State ranking.

Minnesota average 3.76


Health citations are formal notices following inspections when they fail to comply with safety and care standards.

2 of 3 citations resulted from standard inspections; and 1 of 3 resulted from complaint investigations.

Breakdown of citation severity (last 3 years)
Critical health citations
0
100% better than Minnesota average

Minnesota average: 0.7


Serious health citations
1
100% worse than Minnesota average

Minnesota average: 0.5

0 critical citations Minnesota average: 0.7

1 serious citation Minnesota average: 0.5

1 moderate citation Minnesota average: 21.2

1 minor citation Minnesota average: 0.8
Citations history (last 3 years)
Quality of Care serious citation Aug 19, 2025

Infection Control moderate citation Jan 29, 2025
Corrected

Care Planning minor citation Jun 07, 2023
Corrected

Staffing Data

Reporting period: October 1 – December 31, 2025 (Q4 2025). Source: CMS Payroll-Based Journal report.

Total staff 100
Employees 94
Contractors 6
Staff to resident ratio 2.44 : 1
12% more staff per resident than Minnesota average
Minnesota average ratio: 2.19 : 1 Minnesota average ratio: 2.19 : 1See full Minnesota ranking
Avg staff/day 35
Average shift 7.3 hours
0% compared with Minnesota average
Minnesota average: 7.5 hours Minnesota average shift: 7.5 hoursSee full Minnesota ranking
Total staff hours (quarter) 23,426

Nursing staff breakdown

Q4 2025 · Oct 1 – Dec 31 More info This data comes from the CMS Payroll-Based Journal report covering October 1 – December 31, 2025.
Registered Nurse

Manages medical care and health needs.

RN Staff Info All 5 RN Staff are full-time employees. No contractors work on this role. 5
Average shift length Info Average shift length. Calculated as total hours divided by days worked and average staff per day. 8 hours
Licensed Practical Nurse

Assists with medical care and medications.

LPN Staff Info All 10 LPN Staff are full-time employees. No contractors work on this role. 10
Average shift length Info Average shift length. Calculated as total hours divided by days worked and average staff per day. 8.3 hours
Certified Nursing Assistant

Helps with daily care and mobility.

CNA Staff Info All 42 CNA Staff are full-time employees. No contractors work on this role. 42
Average shift length Info Average shift length. Calculated as total hours divided by days worked and average staff per day. 7.5 hours

Contractor staffing

Q4 2025 · Oct 1 – Dec 31 More info This data comes from the CMS Payroll-Based Journal report covering October 1 – December 31, 2025.

Total hours from contractors

1.9%

453 contractor hours this quarter

Physical Therapy Assistant: 1 Qualified Social Worker: 1 Respiratory Therapy Technician: 1 Occupational Therapy Aide: 1 Medical Director: 1 Occupational Therapy Assistant: 1

Staff by category

Q4 2025 · Oct 1 – Dec 31 More info This data comes from the CMS Payroll-Based Journal report covering October 1 – December 31, 2025.
Certified Nursing Assistant4204210,31192100%7.5
Medication Aide/Technician130133,16592100%8
Licensed Practical Nurse100103,15692100%8.3
Nurse Aide in Training7071,8419098%7.4
Registered Nurse5059418896%8
Other Dietary Services Staff100109208592%6.7
RN Director of Nursing2025355459%7.2
Dietitian1014716368%7.5
Nurse Practitioner1014466065%7.4
Administrator1014365762%7.6
Dental Services Staff1013805661%6.8
Clinical Nurse Specialist1013734650%8.1
Respiratory Therapy Technician0111866267%3
Physical Therapy Assistant0111605964%2.7
Qualified Social Worker011683740%1.8
Occupational Therapy Assistant0111833%6
Occupational Therapy Aide01115910%1.6
Medical Director011667%1
42 Certified Nursing Assistant
% of Days 100%
13 Medication Aide/Technician
% of Days 100%
10 Licensed Practical Nurse
% of Days 100%
7 Nurse Aide in Training
% of Days 98%
5 Registered Nurse
% of Days 96%
10 Other Dietary Services Staff
% of Days 92%
2 RN Director of Nursing
% of Days 59%
1 Dietitian
% of Days 68%
1 Nurse Practitioner
% of Days 65%
1 Administrator
% of Days 62%
1 Dental Services Staff
% of Days 61%
1 Clinical Nurse Specialist
% of Days 50%
1 Respiratory Therapy Technician
% of Days 67%
1 Physical Therapy Assistant
% of Days 64%
1 Qualified Social Worker
% of Days 40%
1 Occupational Therapy Assistant
% of Days 3%
1 Occupational Therapy Aide
% of Days 10%
1 Medical Director
% of Days 7%

Penalties and fines

Federal penalties imposed by CMS for regulatory violations, including civil money penalties (fines) and denials of payment for new Medicare/Medicaid admissions.

Source: CMS Penalties Database

No penalties in the past 3 years

No civil money penalties or payment denials were reported in the last 3 years.

Quality of care over time

These measures show how residents usually do over time at this home, based on health outcomes and preventive care.

High-risk clinical events score Info A composite score based on pressure ulcers, falls with injury, weight loss, walking ability decline, and activities of daily living decline. 3.6
67% better than Minnesota average

Minnesota average: 11.1

Functional decline score Info A composite score based on activities of daily living decline, walking ability decline, and incontinence. 7.9
65% better than Minnesota average

Minnesota average: 22.6

Long-stay resident measures
Need for Help with Daily Activities Increased Info Percent of long-stay residents whose need for help with daily activities has increased 8.3%
56% better than Minnesota average

Minnesota average: 18.9%

Walking Ability Worsened Info Percent of long-stay residents whose ability to move independently worsened 5.9%
75% better than Minnesota average

Minnesota average: 23.8%

Low Risk Residents with Bowel/Bladder Incontinence Info Percent of low risk long-stay residents who lose control of their bowels or bladder 9.5%
62% better than Minnesota average

Minnesota average: 25.0%

Falls with Major Injury Info Percent of long-stay residents experiencing one or more falls with major injury 2.3%
38% better than Minnesota average

Minnesota average: 3.7%

High Risk Residents with Pressure Ulcers Info Percent of long-stay high risk residents with pressure ulcers 0.0%
100% better than Minnesota average

Minnesota average: 5.4%

Urinary Tract Infection Info Percent of long-stay residents with a urinary tract infection 1.2%
58% better than Minnesota average

Minnesota average: 2.7%

Lost Too Much Weight Info Percent of long-stay residents who lose too much weight 1.8%
56% better than Minnesota average

Minnesota average: 4.1%

Depressive Symptoms Info Percent of long-stay residents who have depressive symptoms 0.0%
100% better than Minnesota average

Minnesota average: 4.4%

Antipsychotic Use Info Percent of long-stay residents who received an antipsychotic medication 13.0%
24% better than Minnesota average

Minnesota average: 17.2%

Pneumococcal Vaccine Info Percent of long-stay residents assessed and appropriately given the pneumococcal vaccine 100.0%
In line with Minnesota average

Minnesota average: 97.3%

Influenza Vaccine Info Percent of long-stay residents assessed and appropriately given the seasonal influenza vaccine 100.0%
In line with Minnesota average

Minnesota average: 96.0%

Short-stay resident measures
Pneumococcal Vaccine Info Percent of short-stay residents assessed and appropriately given the pneumococcal vaccine 100.0%
12% better than Minnesota average

Minnesota average: 88.9%

Breakdown by payment type

Medicare

41% of new residents, usually for short-term rehab.

Typical stay 4 - 5 years

Private pay

41% of new residents, often for short stays.

Typical stay 1 - 2 years

Medicaid

18% of new residents, often for long-term daily care.

Typical stay 4 - 5 months

Facility Characteristics

Source: CMS Long-Term Care Facility Characteristics (Data as of Jan 2026)

Total residents 41
Medicare
1
2.4% of residents
Medicaid
28
68.3% of residents
Private pay or other
12
29.3% of residents
Programs & Services
Residents Group

Residents meet regularly to discuss policies, care quality, and activities

Nurse Aide Training

State-approved Nurse Aide Training and Competency Evaluation Program on-site

Active Resident Council

Organized group of residents that meets regularly to discuss facility policies, quality of life, and activities.

Finances and operations

Based on CMS SNF Cost Report for fiscal year ending in 12/2022.

Nonprofit
Nonprofit Corporation
Net patient revenue Info Net patient revenue — what the home actually collects for resident care, after contractual allowances, bad debt and discounts are subtracted from its gross charges (CMS cost report, Worksheet G-3). It covers resident care only; money the home earns from other sources is shown separately as "Other income."
$5.5M
Net patient income Info Net patient income: net patient revenue minus the home's total operating expenses. A positive figure means it earns more from resident care than it spends to deliver it; a negative figure means the opposite. It excludes non-operating "other income."
-$216.9K
Nonprofit Nonprofit Corporation
Net patient revenue Info Net patient revenue — what the home actually collects for resident care, after contractual allowances, bad debt and discounts are subtracted from its gross charges (CMS cost report, Worksheet G-3). It covers resident care only; money the home earns from other sources is shown separately as "Other income."
$5.5M Rank #70 / 89Revenue — State benchmarkedThis home is ranked 70th out of 89 homes in Minnesota. Shows this facility's annual revenue compared to the Minnesota average. Higher revenue generally means more resources for staffing and capital — read alongside Payroll %.Rankings are based only on facilities in Minnesota that report data for that category. Facilities without available data are excluded from the ranking.Click the rank badge to see the full State ranking.Click here to see the full State ranking.
Net patient income Info Net patient income: net patient revenue minus the home's total operating expenses. A positive figure means it earns more from resident care than it spends to deliver it; a negative figure means the opposite. It excludes non-operating "other income."
-$216.9K
Other income Info Money the home earns outside of resident care — such as investments, grants, rentals and other non-operating sources (CMS cost report, Worksheet G-3). It is tracked separately from net patient revenue: it is not part of that figure, and it is not included in net patient income.
$1.7M
Payroll costs Info Staff salaries plus wage-related costs — benefits such as payroll taxes, health insurance and retirement — from the home's own accounting records (CMS cost report, Worksheet A). Contract or agency labor is counted separately, under other operating costs. Rank #69 / 89Payroll — State benchmarkedThis home is ranked 69th out of 89 homes in Minnesota. Shows total annual staff payroll benchmarked to the Minnesota average. Higher payroll investment relative to peers often signals better staffing and less reliance on cheaper contract labor.Rankings are based only on facilities in Minnesota that report data for that category. Facilities without available data are excluded from the ranking.Click the rank badge to see the full State ranking.Click here to see the full State ranking.
$4.1M 75.8% of net patient revenue Info Payroll as a share of revenue: staff salaries and wage-related benefits divided by net patient revenue. A higher figure means more of each revenue dollar goes to staff pay. Rank #37 / 89Payroll % — State benchmarkedThis home is ranked 37th out of 89 homes in Minnesota. Shows payroll as a percentage of revenue versus the Minnesota average. Well-run Minnesota facilities typically land around 61–68% — the top third Statewide. Below 25% may signal understaffing or heavy agency use — read with Staffing ratings.Rankings are based only on facilities in Minnesota that report data for that category. Facilities without available data are excluded from the ranking.Click the rank badge to see the full State ranking.Click here to see the full State ranking.
Other operating costs Info Everything it costs to run the home apart from payroll — food, utilities, supplies, maintenance, contract labor and administration. Calculated as total operating expense minus payroll (staff salaries and wage-related benefits).
$1.5M
Total costs Info The home's total operating expense for the year — all the costs of running it, salaries included (CMS cost report, Worksheet G-3).
$5.7M

What does this home offer?

Housing options icon

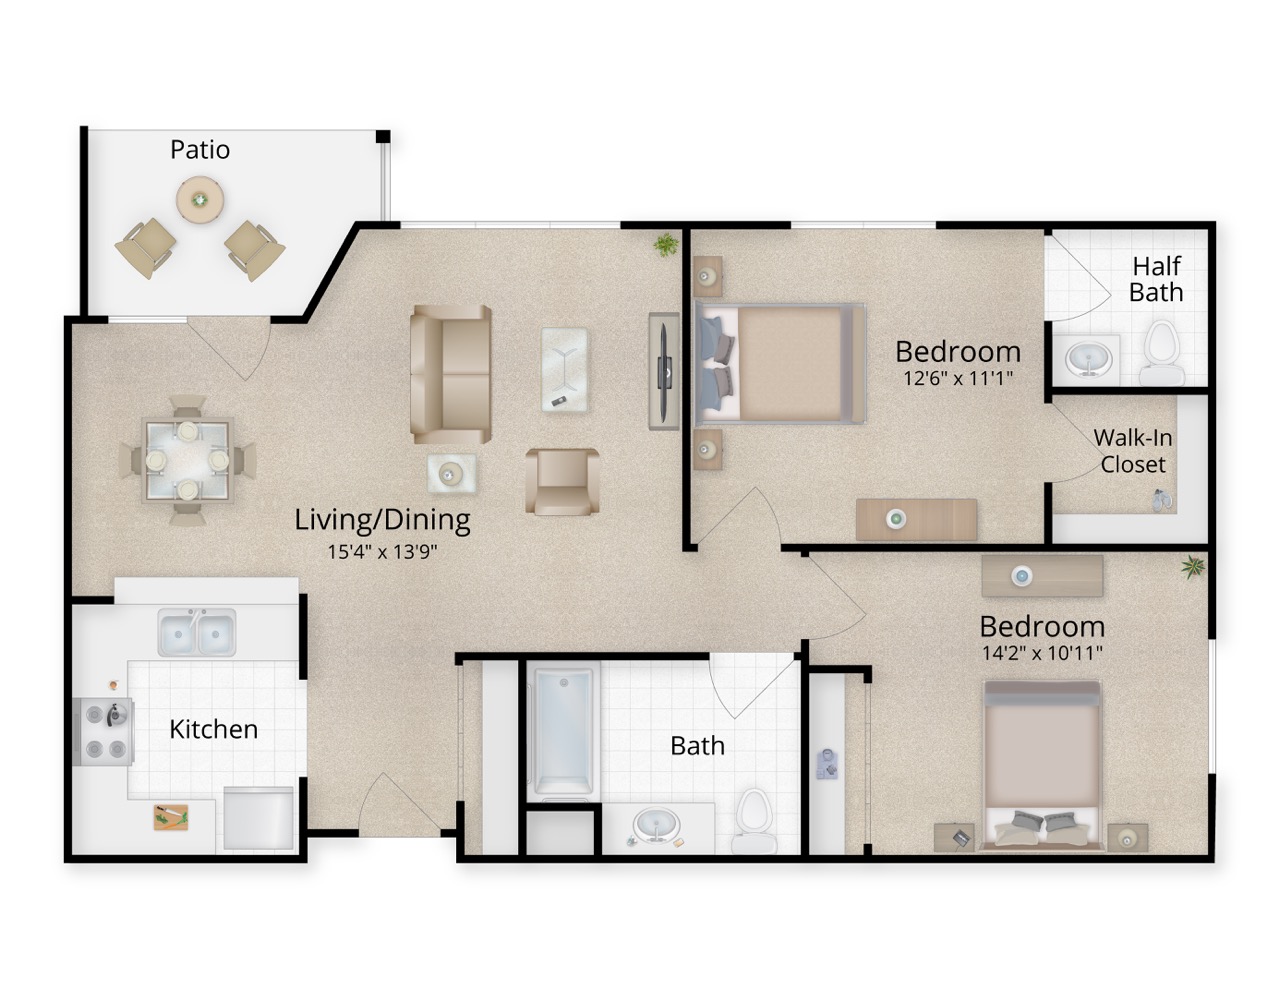
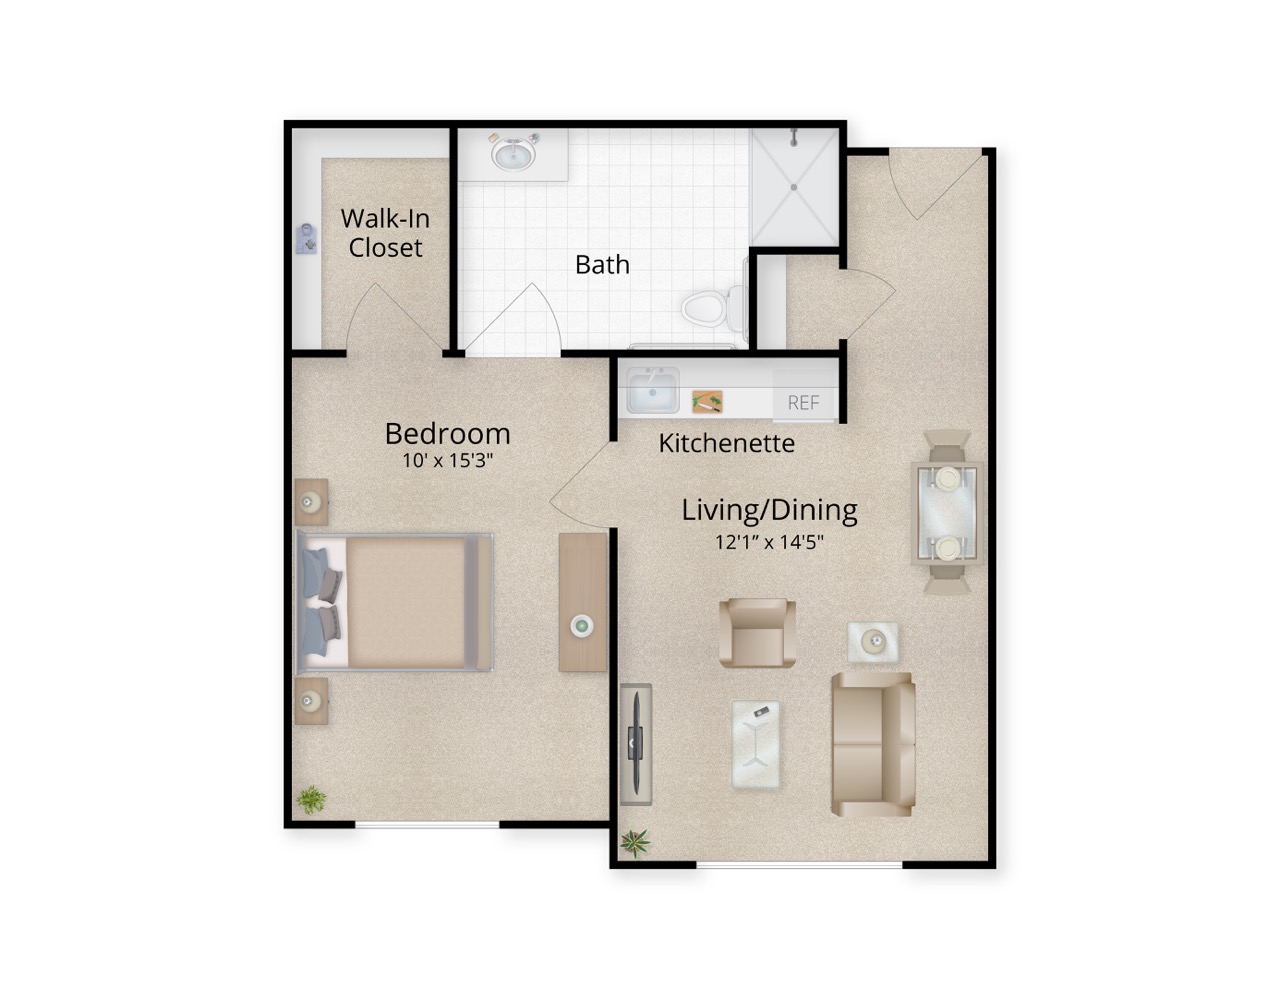
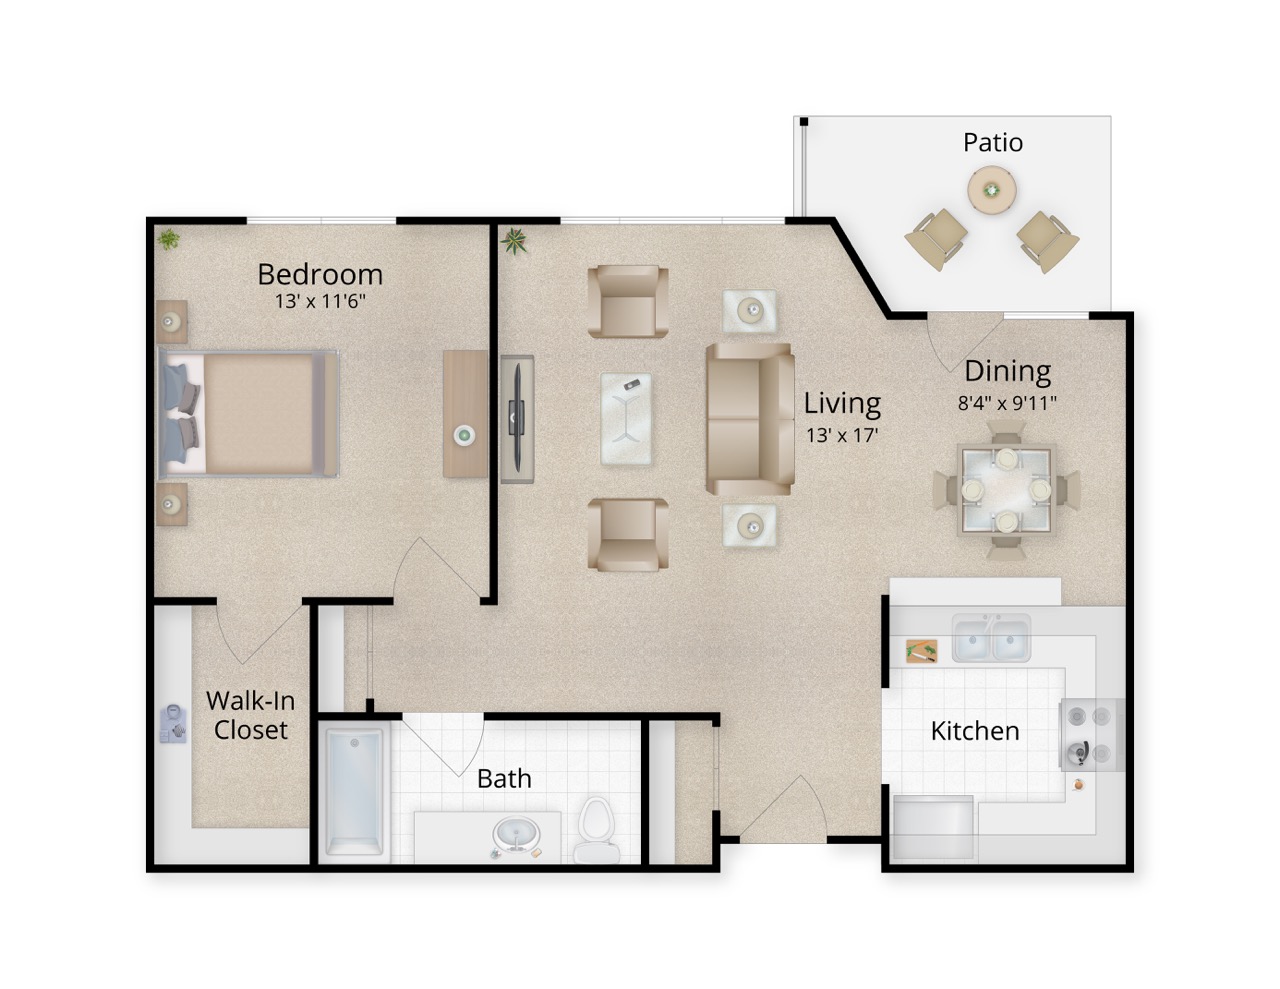
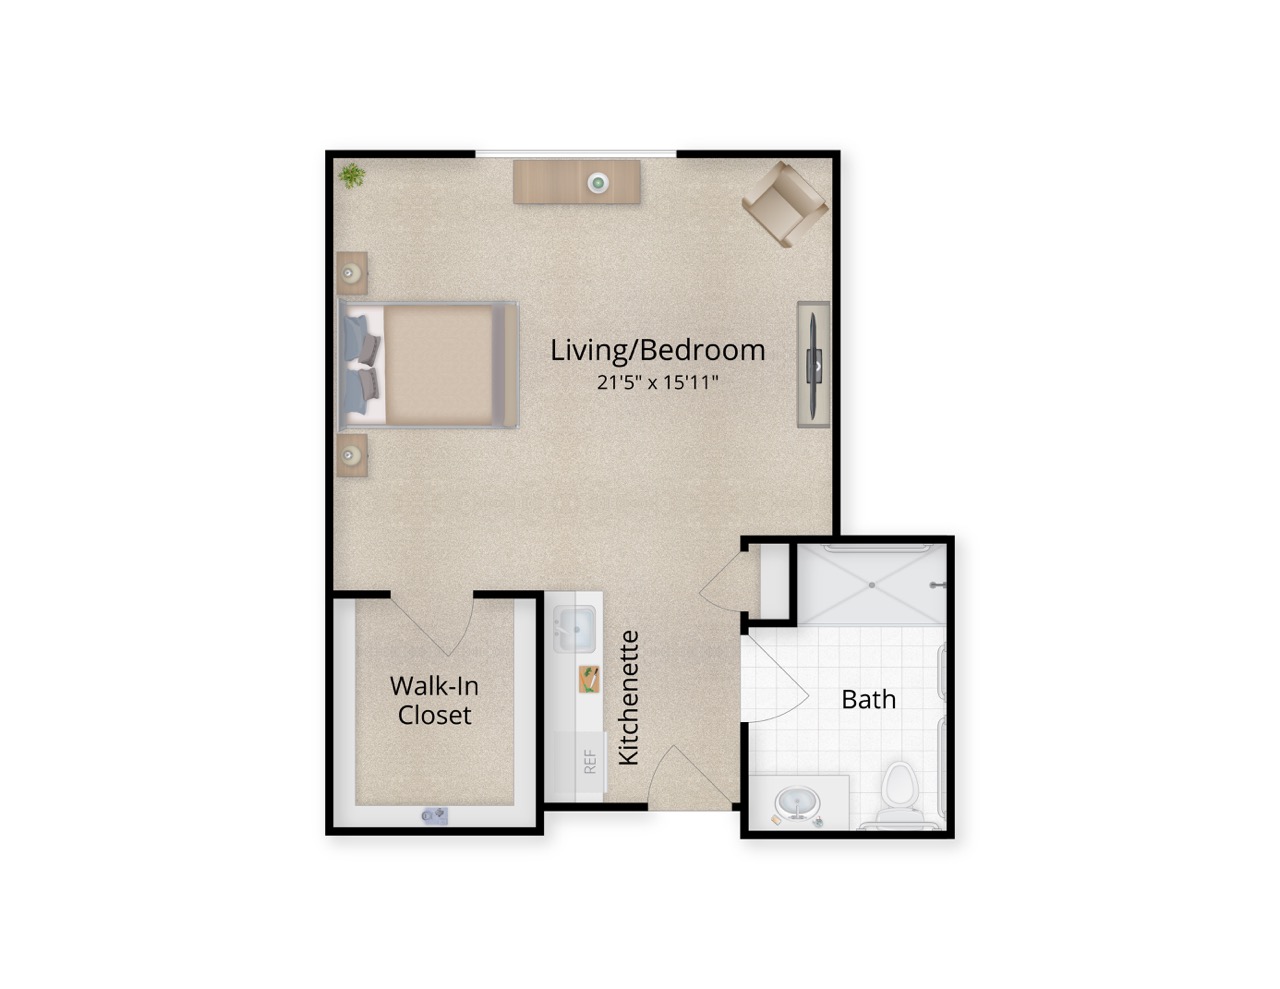
Housing Options: Studio / 1 Bed / 2 Bed

Who this home usually serves

TYPE OF STAY

Mix of rehab and long-term care

This home supports both short-term rehab and long-term care, with residents staying for a wide range of durations.

New residents most often arrive under Medicare (41% of admissions), and a typical Medicare stay runs around 4 - 5 years.

Admissions
17 total

Coverage residents most often arrive under.

Medicare 41%
Private pay 41%
Medicaid 18%
Discharges
27 total

Coverage residents most often leave under.

Medicare 15%
Private pay 59%
Medicaid 26%

Living Spaces & Floor Plans for Mankato Lodge Senior Living

Places of interest near Mankato Lodge Senior Living

Address 1.7 miles from city center Info Estimated distance in miles from Mankato's city center to Mankato Lodge Senior Living's address, calculated via Google Maps.

Calculate Travel Distance to Mankato Lodge Senior Living

Add your location

Address

Financial Assistance for
Assisted Living in Minnesota

Mankato Lodge Senior Living is located in Mankato, Minnesota.
Here are the financial assistance programs available to residents in Minnesota.

Get Financial aid guidance

Elderly Waiver

Minnesota Medicaid EW

Age 65+
General Minnesota resident, Medicaid-eligible, nursing home-level care need.
Income Limits (2025) ~$2,829/month 300% FBR, individual
Asset Limits $3,000 individual, higher than most states
MN

Higher asset limit; rural access focus.

Benefits
Personal care (5-7 hours/day) Respite (240 hours/year) Adult day care (~$70/day) Home aides

Essential Community Supports (ECS)

Minnesota ECS

Age 65+
General Minnesota resident, at risk of decline but not nursing home level.
Income Limits ~$1,732/month individual, varies
Asset Limits $3,000 individual
MN

Bridges gap for those ineligible for waivers.

Benefits
In-home support (2-4 hours/week) Respite (up to 5 days/year) Transportation (~5 trips/month)

Alternative Care (AC) Program

Minnesota Alternative Care Program

Age 65+
General Minnesota resident, NFLOC, not MA-eligible.
Income Limits (2025) ~$1,255-$2,829/month (100%-300% FPL); sliding scale copays.
Asset Limits $3,000 (individual); home equity limit $713,000.
MN

CDCS option; statewide via counties.

Benefits
Personal care (4-6 hours/day) Respite (~5 days/year) Home health Meals Home mods

Minnesota Senior Health Options (MSHO)

Minnesota Senior Health Options

Age 65+
General Minnesota resident, eligible for MA and Medicare Parts A/B.
Income Limits (2025) ~$1,255/month (100% FPL for MA); spenddown allowed.
Asset Limits $3,000 (individual), $6,000 (couple).
MN

7 health plans (e.g., UCare, HealthPartners); care coordinator assigned.

Benefits
Personal care (5-7 hours/day) Medical care Respite Adult day care Home mods $900/year groceries (some plans)

Minnesota Senior Care Plus (MSC+)

Minnesota Senior Care Plus

Age 65+
General Minnesota resident, MA-eligible, not on Medicare.
Income Limits (2025) ~$1,255/month (100% FPL); spenddown allowed.
Asset Limits $3,000 (individual), $6,000 (couple).
MN

Includes EW services; 7 health plans available.

Benefits
Personal care (5-7 hours/day) Respite Adult day care Home mods Limited nursing home care

Consumer Support Grant (CSG)

Minnesota Consumer Support Grant

Age 65+ or disabled
General Minnesota resident, eligible for MA personal care but opts for grant.
Income Limits (2025) ~$1,255/month (MA-eligible); spenddown allowed.
Asset Limits $3,000 individual
MN

Can hire family; statewide via counties.

Benefits
Cash (~$500-$1,500/month) for personal care Respite Home mods Assistive tech

Medicare Savings Program (MSP)

Minnesota Medicare Savings Program

Age 65+ or disabled
General Minnesota resident, Medicare Part A/B.
Income Limits (2025) ~$2,510/month (QMB), ~$3,380/month (SLMB), ~$3,598/month (QI)—individual.
Asset Limits $9,430 (individual), $14,130 (couple).
MN

Three tiers; no waitlist; includes Extra Help for Part D.

Benefits
Covers Part B premiums ($174.70/month) Deductibles ($240/year) Copays (~20%)

VA Aid and Attendance (A&A) and Housebound Benefits

Minnesota VA Aid and Attendance/Housebound

Age 65+ or disabled veteran/spouse
General Minnesota resident, wartime service, need for ADL help (A&A) or homebound.
Income Limits (2025) Net income < ~$1,984/month (veteran with dependent, A&A); pension offsets income.
Asset Limits ~$155,356 net worth limit
MN

High veteran demand in rural/urban areas.

Benefits
Cash (~$1,433-$2,642/month veteran, ~$951-$1,318 spouse) for care costs (e.g., in-home, assisted living)

Frequently Asked Questions about Mankato Lodge Senior Living

Is Mankato Lodge Senior Living in a walkable area?

Mankato Lodge Senior Living has a walk score of 56. Moderately walkable. Some errands can be accomplished on foot, with a mix of nearby amenities.

What is the occupancy rate at Mankato Lodge Senior Living?

Mankato Lodge Senior Living's occupancy is 97%.

Does Mankato Lodge Senior Living operate as a for-profit or non-profit?

Mankato Lodge Senior Living is registered as a non-profit in MN.

How many beds does Mankato Lodge Senior Living have?

Mankato Lodge Senior Living has 70 beds.

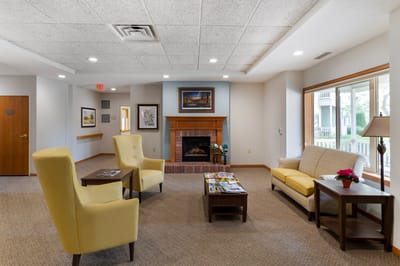
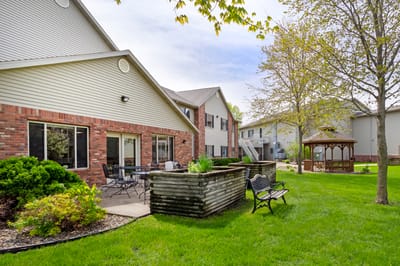
Are there photos of Mankato Lodge Senior Living?

Yes — there are 4 photos of Mankato Lodge Senior Living in the photo gallery on this page.

What is the address of Mankato Lodge Senior Living?

Mankato Lodge Senior Living is located at 1360 Adams St, Mankato, MN 56001.

What is the phone number of Mankato Lodge Senior Living?

(507) 388-9292 will put you in contact with the team at Mankato Lodge Senior Living.

Guides for Better Senior Living

Care Cost Calculator: See Prices in Your Area

Nursing Home Data Explorer

Don’t Wait Too Long: 7 Red Flag Signs Your Parent Needs Assisted Living Now

The True Cost of Assisted Living in 2025 – And How Families Are Paying For It

Understanding Senior Living Costs: Pricing Models, Discounts & Financial Assistance