


Total staff
110
Employees
109
Contractors
1
ManorCare Health Services is one of the most trusted senior living communities in Overland Park; they have strived to offer excellent and comprehensive accommodations for seniors with respect and dignity. The nursing home specializes in skilled nursing and rehabilitation services. Staff is sure to maintain a high-quality standard of service delivered with compassion at a beautiful and welcoming campus. ManorCare ensures that your needs are met and that your recovery is their priority.
Community services include 24-hour nursing care, stimulating activities, engaging social activities and programs, and therapy services, including speech, occupational, and physical therapy. Individualized and long-term care are also offered to provide maximum care to unique seniors.
| Staff type | Hours / Day / Resident | vs state avg |
|---|---|---|
|
Registered Nurse (RN)
| 21m per day | ▼ 51% State avg: 43m per day · National avg: 41m per day |
|
LPN / LVN
| 51m per day | ▲ 28% State avg: 40m per day · National avg: 52m per day |
|
Nurse Aide
| 1h 47m per day | ▼ 34% State avg: 2h 42m per day · National avg: 2h 21m per day |
|
Weekend Total Nursing
| 2h 39m per day | ▼ 26% State avg: 3h 35m per day · National avg: 3h 26m per day |
|
Physical Therapist
| 5m per day | ▲ 163% State avg: 2m per day · National avg: 4m per day |
|
Weekend RN
| 13m per day | ▼ 56% State avg: 29m per day · National avg: 29m per day |
Reporting period: October 1 – December 31, 2025 (Q4 2025). Source: CMS Payroll-Based Journal report.
Manages medical care and health needs.
Assists with medical care and medications.
Helps with daily care and mobility.
| Certified Nursing Assistant | 55 | 1 | 56 | 17,221 | 92 | 100% | 9.5 |
| Licensed Practical Nurse | 24 | 0 | 24 | 8,795 | 92 | 100% | 9.9 |
| Registered Nurse | 7 | 0 | 7 | 3,101 | 92 | 100% | 9.3 |
| Other Dietary Services Staff | 3 | 0 | 3 | 1,470 | 91 | 99% | 8.4 |
| Medication Aide/Technician | 6 | 0 | 6 | 1,140 | 78 | 85% | 9.3 |
| Respiratory Therapy Technician | 2 | 0 | 2 | 905 | 68 | 74% | 7.8 |
| Dental Services Staff | 3 | 0 | 3 | 840 | 64 | 70% | 8 |
| Qualified Social Worker | 2 | 0 | 2 | 752 | 65 | 71% | 7 |
| Dietitian | 1 | 0 | 1 | 584 | 64 | 70% | 9.1 |
| Administrator | 1 | 0 | 1 | 512 | 64 | 70% | 8 |
| Nurse Practitioner | 1 | 0 | 1 | 512 | 64 | 70% | 8 |
| Physical Therapy Aide | 1 | 0 | 1 | 494 | 62 | 67% | 8 |
| Speech Language Pathologist | 1 | 0 | 1 | 356 | 58 | 63% | 6.1 |
| Physical Therapy Assistant | 2 | 0 | 2 | 124 | 27 | 29% | 4.6 |
Includes penalties issued in 2024-2025
Federal penalties imposed by CMS for regulatory violations, including civil money penalties (fines) and denials of payment for new Medicare/Medicaid admissions.
Source: CMS Penalties Database (Data as of Jan 2026)
Kansas average: $44K
Kansas average: 2.4
Kansas average: 0.3
Penalties are imposed by CMS for violations of federal nursing home regulations.
3 penalties in the past 3 years
Multiple penalties were reported in the last 3 years.
Last updated: Jan 2026
These measures show how residents usually do over time at this home, based on health outcomes and preventive care.
Kansas average: 10.5
Kansas average: 20.7
Kansas average: 19.0%
Kansas average: 19.4%
Kansas average: 23.8%
Kansas average: 4.4%
Kansas average: 4.6%
Kansas average: 3.1%
Kansas average: 5.1%
Kansas average: 5.2%
Kansas average: 16.9%
Kansas average: 91.9%
Kansas average: 95.5%
Kansas average: 1.84
Kansas average: 2.16
Kansas average: 75.6%
Kansas average: 2.2%
Kansas average: 73.5%
Kansas average: 23.0%
Kansas average: 11.7%
Kansas average: 0.8%
Quality measures are calculated from Minimum Data Set (MDS) assessments. For most measures, lower percentages indicate better care quality.
20% of new residents, usually for short-term rehab.
70% of new residents, often for short stays.
10% of new residents, often for long-term daily care.
Source: CMS Long-Term Care Facility Characteristics (Data as of Jan 2026)
Residents meet regularly to discuss policies, care quality, and activities
Organized group of residents that meets regularly to discuss facility policies, quality of life, and activities.
Data sourced from CMS Long-Term Care Facility Characteristics quarterly report. Payer mix reflects the current resident census by primary payment source.
Historical financial and operational data for ManorCare Health Services-Overland Park from 2012–2022, based on CMS SNF Cost Reports.
Key figures below are for fiscal year ending in 07/2022 — the home's most recent complete cost report, an older period than most facilities report.
Based on the home's most recent complete CMS SNF Cost Report — fiscal year ending in 07/2022. This is an older period than most facilities report, so compare with that in mind.
Residents typically stay for brief periods, with frequent admissions and discharges throughout the year.
Most new residents arrive under private pay (70% of admissions), and a typical private pay stay runs around 4 - 5 months.
Coverage residents most often arrive under.
Coverage residents most often leave under.
![]() 3.2 miles from city center
3.2 miles from city center
![]() Estimated distance in miles from Overland Park's city center to ManorCare Health Services-Overland Park's address, calculated via Google Maps.
— 2.18 miles to nearest hospital (Menorah Medical Center)
Estimated distance in miles from Overland Park's city center to ManorCare Health Services-Overland Park's address, calculated via Google Maps.
— 2.18 miles to nearest hospital (Menorah Medical Center)
Add your location
Info below is compiled from CMS reports & the KS Dept. for Aging & Disability Services (KDADS), senior community websites & trusted data sources such as Walk Score & BBB.
Communities are listed from highest to lowest based on our ranking methodology.
| Brookdale Overland Park | NH AL MC SNF | Overland Park | 94
Facility
94
KS AVG
69
Rank
#44 / 223 |
79.3%
Facility
79.3%
KS AVG
76.8
Rank
#117 / 206 | +3% | 4.53
Facility
4.53
KS AVG
4.63
Rank
#72 / 141 | +65% | -2% | $7.4k
Facility
$7.4k
KS AVG
$49.2k
Rank
#62 / 144 | 20
Facility
20
KS AVG
26.9
Rank
#53 / 144 | 6.7
Facility
6.7
KS AVG
6.1
Rank
#98 / 144 | 1 | 75 | - |
44
Facility
44
KS AVG
46
Rank
#207 / 363 | Kimberly Ellis | $22.0MFiscal year ending 12/2023
Facility
$22.0MFiscal year ending 12/2023
KS AVG
$7.3M
Rank
#15 / 143 | $10.9MFiscal year ending 12/2023
Facility
$10.9MFiscal year ending 12/2023
KS AVG
$3.3M
Rank
#12 / 143 | 49.6%Fiscal year ending 12/2023
Facility
49.6%Fiscal year ending 12/2023
KS AVG
47.9%
Rank
#33 / 143 | 175517 | ||||
| Ahc of Overland Park LLC | NH SNF | Overland Park (South Lakes) | 38
Facility
38
KS AVG
69
Rank
#203 / 223 |
100.0%
Facility
100.0%
KS AVG
76.8
Rank
#1 / 206 | +30% | 5.02
Facility
5.02
KS AVG
4.63
Rank
#44 / 141 | +13% | +8% | $13.4k
Facility
$13.4k
KS AVG
$49.2k
Rank
#77 / 144 | 22
Facility
22
KS AVG
26.9
Rank
#61 / 144 | 4.4
Facility
4.4
KS AVG
6.1
Rank
#36 / 144 | 2 | 38 | - |
92
Facility
92
KS AVG
46
Rank
#1 / 363 | Paul Hura | $6.4MFiscal year ending 12/2023
Facility
$6.4MFiscal year ending 12/2023
KS AVG
$7.3M
Rank
#55 / 143 | $4.3MFiscal year ending 12/2023
Facility
$4.3MFiscal year ending 12/2023
KS AVG
$3.3M
Rank
#59 / 143 | 66.6%Fiscal year ending 12/2023
Facility
66.6%Fiscal year ending 12/2023
KS AVG
47.9%
Rank
#113 / 143 | 175542 | ||||
| Village Shalom Inc | NH AL IL MC RC SNF | Overland Park (6850) | 66
Facility
66
KS AVG
69
Rank
#87 / 223 |
98.5%
Facility
98.5%
KS AVG
76.8
Rank
#7 / 206 | +28% | 6.86
Facility
6.86
KS AVG
4.63
Rank
#4 / 141 | -48% | +48% | $16.2k
Facility
$16.2k
KS AVG
$49.2k
Rank
#91 / 144 | 32
Facility
32
KS AVG
26.9
Rank
#99 / 144 | 8.0
Facility
8.0
KS AVG
6.1
Rank
#115 / 144 | 2 | 65 | - |
22
Facility
22
KS AVG
46
Rank
#299 / 363 | Michael Abrams | $22.7MFiscal year ending 12/2023
Facility
$22.7MFiscal year ending 12/2023
KS AVG
$7.3M
Rank
#7 / 143 | $10.7MFiscal year ending 12/2023
Facility
$10.7MFiscal year ending 12/2023
KS AVG
$3.3M
Rank
#8 / 143 | 47%Fiscal year ending 12/2023
Facility
47%Fiscal year ending 12/2023
KS AVG
47.9%
Rank
#113 / 143 | 175441 | ||||
| Stratford Commons Rehabilitation & Health Care | NH HOS RC SNF | Overland Park (Stratford Place) | 60
Facility
60
KS AVG
69
Rank
#94 / 223 |
88.3%
Facility
88.3%
KS AVG
76.8
Rank
#57 / 206 | +15% | 3.79
Facility
3.79
KS AVG
4.63
Rank
#109 / 141 | 0% | -18% | $24.8k
Facility
$24.8k
KS AVG
$49.2k
Rank
#106 / 144 | 44
Facility
44
KS AVG
26.9
Rank
#120 / 144 | 14.7
Facility
14.7
KS AVG
6.1
Rank
#143 / 144 | - | 53 | - |
47
Facility
47
KS AVG
46
Rank
#186 / 363 | Joseph Charles Tutera 2013 Family Irrevociable Trust Agreement | $7.0MFiscal year ending 12/2023
Facility
$7.0MFiscal year ending 12/2023
KS AVG
$7.3M
Rank
#54 / 143 | $3.7MFiscal year ending 12/2023
Facility
$3.7MFiscal year ending 12/2023
KS AVG
$3.3M
Rank
#51 / 143 | 53%Fiscal year ending 12/2023
Facility
53%Fiscal year ending 12/2023
KS AVG
47.9%
Rank
#87 / 143 | 175549 | ||||
| ManorCare Health Services-Overland Park | NH AL IL | Overland Park | 140
Facility
140
KS AVG
69
Rank
#11 / 223 |
80.1%
Facility
80.1%
KS AVG
76.8
Rank
#108 / 206 | +4% | 3.79
Facility
3.79
KS AVG
4.63
Rank
#109 / 141 | -37% | -18% | $59.7k
Facility
$59.7k
KS AVG
$49.2k
Rank
#123 / 144 | 56
Facility
56
KS AVG
26.9
Rank
#135 / 144 | 7.0
Facility
7.0
KS AVG
6.1
Rank
#104 / 144 | 4 | 112 | - |
35
Facility
35
KS AVG
46
Rank
#240 / 363 | - | $12.0M*Fiscal year ending 07/2022These figures are from this home's most recent complete cost report — an older period than most facilities report. Compare with that in mind.
Facility
$12.0M*Fiscal year ending 07/2022These figures are from this home's most recent complete cost report — an older period than most facilities report. Compare with that in mind.
KS AVG
$7.3M
Rank
#27 / 143 | $6.2M*Fiscal year ending 07/2022These figures are from this home's most recent complete cost report — an older period than most facilities report. Compare with that in mind.
Facility
$6.2M*Fiscal year ending 07/2022These figures are from this home's most recent complete cost report — an older period than most facilities report. Compare with that in mind.
KS AVG
$3.3M
Rank
#38 / 143 | 51.9%*Fiscal year ending 07/2022These figures are from this home's most recent complete cost report — an older period than most facilities report. Compare with that in mind.
Facility
51.9%*Fiscal year ending 07/2022These figures are from this home's most recent complete cost report — an older period than most facilities report. Compare with that in mind.
KS AVG
47.9%
Rank
#96 / 143 | 175180 |
ManorCare Health Services-Overland Park is located in Overland Park, Kansas.
Here are the financial assistance programs available to residents in Kansas.
ManorCare Health Services-Overland Park has a walk score of 35. Somewhat walkable. A few nearby services may be reachable on foot, but most trips require transportation.
ManorCare Health Services-Overland Park's occupancy is 86.5%.
No, ManorCare Health Services-Overland Park has a no-pet policy.
ManorCare Health Services-Overland Park is registered as a for-profit.
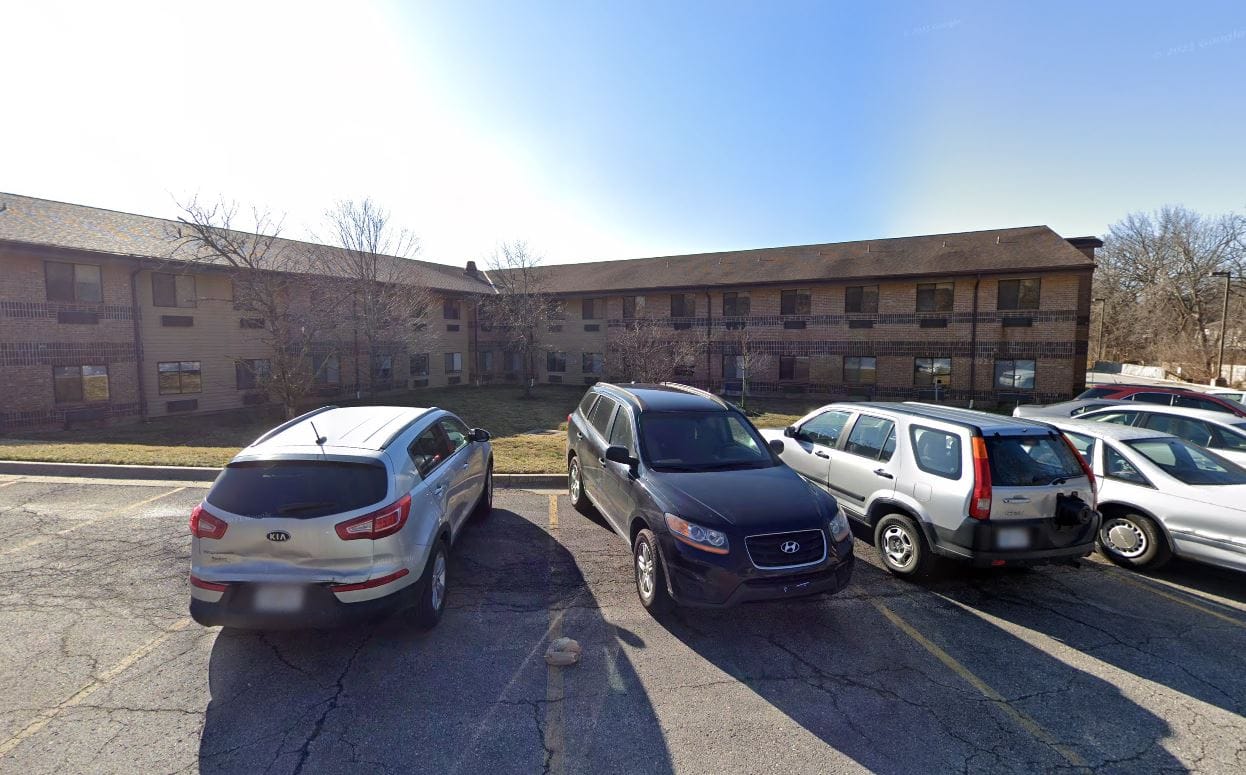
Yes — there is 1 photo of ManorCare Health Services-Overland Park in the photo gallery on this page.
ManorCare Health Services-Overland Park is located at 5211 W 103Rd St, Overland Park, KS 66207.
(913) 383-2569 will put you in contact with the team at ManorCare Health Services-Overland Park.
Care Cost Calculator: See Prices in Your Area
Nursing Home Data Explorer
Don’t Wait Too Long: 7 Red Flag Signs Your Parent Needs Assisted Living Now
The True Cost of Assisted Living in 2025 – And How Families Are Paying For It
Understanding Senior Living Costs: Pricing Models, Discounts & Financial Assistance


