Markley Rehabilitation & Healthcare Center
Nursing Home, Hospice Care, Memory Care, Nursing Care, Palliative Care & Respite Care · Montgomery County, PA
CMS overall rating Info CMS (the Centers for Medicare & Medicaid Services) is the federal agency that rates nursing home quality. Its Overall Rating runs from 1 to 5 stars, combining health inspections, staffing, and quality measures, with inspections weighted most heavily.

Markley Rehabilitation & Healthcare Center

Nursing Home, Hospice Care, Memory Care, Nursing Care, Palliative Care & Respite Care · Montgomery County, PA
CMS overall rating Info CMS (the Centers for Medicare & Medicaid Services) is the federal agency that rates nursing home quality. Its Overall Rating runs from 1 to 5 stars, combining health inspections, staffing, and quality measures, with inspections weighted most heavily.
Calculator: See prices in your area
Markley Rehabilitation & Healthcare Center accepts Medicare, Medicaid, and private pay.

Overview of Markley Rehabilitation & Healthcare Center

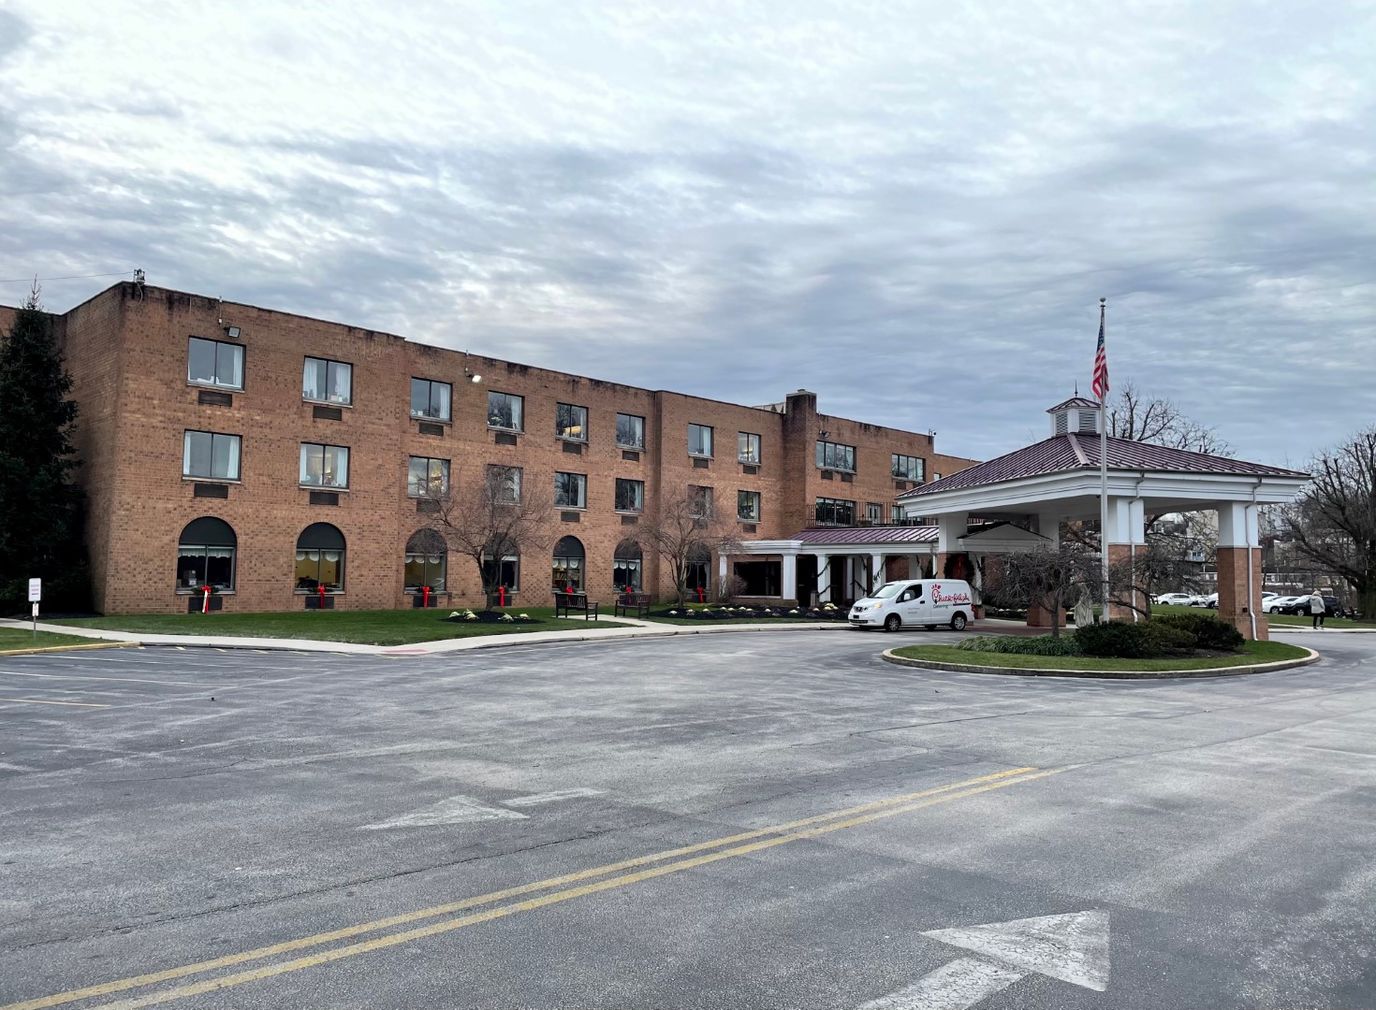
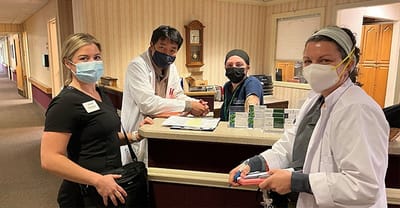
Markley Rehabilitation & Healthcare Center is a respected community in Norristown, PA, offering exceptional rehabilitation, skilled nursing care, and memory care services. Residents here are guaranteed improved quality of life and well-being with the help of excellent nurses available to support their daily needs. Physical, speech, and occupational therapy services are also provided to ensure residents maintain or recover their overall functions to continue doing the things they love.

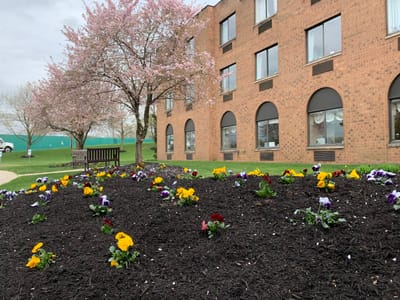
Regular housekeeping and laundry services are also available to ensure residents’ living environment always remains clean and safe. To make residents’ daily lives more enjoyable and enriching, the community provides a wide range of activities for them to engage in while getting their energy from healthy and tasty meals. At Markley Rehabilitation & Healthcare Center, they strive to provide residents with a vibrant environment where they can recover fast or enjoy a comfortable living experience.

Quality ratings

Measured by Centers for Medicare & Medicaid Services (CMS)

Overall rating Info The Overall CMS Rating combines results from health inspections, staffing levels and quality measures. Health inspections carry the most weight. Staffing and quality scores can increase or decrease the final rating based on performance compared to state and national standards.
At PA avg. At PA avg.PA average: 3.0Click the badge to see the full State ranking.Click here to see the full State ranking.
Health Inspection Info Based on the results of the facility's three most recent standard inspections and any complaint investigations. CMS reviews the number, scope, and severity of deficiencies, with more recent findings weighted more heavily.
▼ 28.5% Below PA avg. ▼ 28.5% Below PA avg.PA average: 2.8Click the badge to see the full State ranking.Click here to see the full State ranking.
Staffing Info Measures average nursing staff hours per resident per day, including Registered Nurses (RNs) and total nursing staff. Ratings are adjusted based on the level of care residents require and are compared to state and national benchmarks.
▼ 41.0% Below PA avg. ▼ 41.0% Below PA avg.PA average: 3.4Click the badge to see the full State ranking.Click here to see the full State ranking.
Quality Measures Info Based on clinical and physical health indicators reported to CMS, such as hospital readmissions, falls, pressure ulcers, and improvements in mobility. These measures reflect how well residents' health needs are being managed.
▲ 47.3% Above PA avg. ▲ 47.3% Above PA avg.PA average: 3.4Click the badge to see the full State ranking.Click here to see the full State ranking.

Staffing hours breakdown

Info Daily nursing hours per resident by staff type, reported to CMS. Higher is generally better — compare this facility to state and national averages to see where staffing stands.

Hours per resident per day — compared to Pennsylvania state averages

Total nursing care / resident Info This home is ranked 174th out of 207 homes in Pennsylvania for nurse hours. Total adjusted nursing hours per resident per day, combining RN, LPN, and aide time. CMS adjusts this for case-mix so facilities can be fairly compared.
3h 30m per day
Rank #174 / 207Nurse hours — State benchmarkedThis home is ranked 174th out of 207 homes in Pennsylvania. Shows adjusted nurse hours per resident per day benchmarked to the Pennsylvania average, with a ranking across 207 Pennsylvania facilities. More hours mean more direct care. The national average is about 3.5 hrs; below 3.0 is a red flag.Rankings are based only on facilities in Pennsylvania that report data for that category. Facilities without available data are excluded from the ranking.Click the rank badge to see the full State ranking.Click here to see the full State ranking.
This facility Pennsylvania avg (4h 9m per day)
vs Pennsylvania avg
-15%

6 of 6 metrics below state avg

Staff typeHours / Day / Residentvs state avg
Registered Nurse (RN) Info RNs hold the highest nursing license and can assess residents, interpret test results, and direct care plans. More RN hours per day often signals stronger clinical oversight and faster response to health changes. 40m per day ▼ 15% State avg: 47m per day · National avg: 41m per day
LPN / LVN Info Licensed Practical Nurses (LPNs) or Licensed Vocational Nurses (LVNs) deliver routine hands-on care — medication administration, wound dressing, and monitoring vital signs. They work under RN supervision and make up a large share of daily bedside care. 46m per day ▼ 16% State avg: 55m per day · National avg: 52m per day
Nurse Aide Info Certified Nurse Aides (CNAs) provide the most direct day-to-day assistance: bathing, dressing, feeding, and mobility. Nurse aide hours are typically the largest staffing category and directly affect residents' quality of life. 2h 4m per day ▼ 6% State avg: 2h 12m per day · National avg: 2h 21m per day
Weekend Total Nursing Info Combined nursing hours (RN + LPN + Nurse Aide) per resident per day on weekends. Staffing often drops on weekends — this figure reveals whether the facility maintains adequate coverage outside of weekday hours. 3h 5m per day ▼ 12% State avg: 3h 31m per day · National avg: 3h 26m per day
Physical Therapist Info Hours per resident per day provided by licensed Physical Therapists (PTs) or PT Assistants. PT services help residents recover mobility after injury or illness and are especially important for post-acute (short-stay) rehabilitation. 1m per day ▼ 91% State avg: 6m per day · National avg: 4m per day
Weekend RN Info Registered nurse hours specifically on weekends. Facilities sometimes reduce RN presence on Saturdays and Sundays — a low weekend RN figure compared to weekday hours can indicate reduced clinical oversight when most administrative staff are absent. 22m per day ▼ 32% State avg: 33m per day · National avg: 29m per day

Capacity and availability

This home usually has limited availability

Higher occupancy than the Pennsylvania average: 78.7%
Occupancy rate
92.5% Rank #38 / 518Occupancy rate — State benchmarkedThis home is ranked 38th out of 518 homes in Pennsylvania. Shows this facility's occupancy rate versus the Pennsylvania average, with its Statewide rank out of 518. Higher occupancy signals strong local demand and financial stability.Rankings are based only on facilities in Pennsylvania that report data for that category. Facilities without available data are excluded from the ranking.Click the rank badge to see the full State ranking.Click here to see the full State ranking.
Avg. Length of Stay
114 days
Bed community size
121-bed community Rank #122 / 555Bed count — State benchmarkedThis home is ranked 122nd out of 555 homes in Pennsylvania. Shows this facility's certified or reported bed count compared to other Pennsylvania facilities. Larger communities may offer more amenities, programs, and on-site services for residents and families.Rankings are based only on facilities in Pennsylvania that report data for that category. Facilities without available data are excluded from the ranking.Click the rank badge to see the full State ranking.Click here to see the full State ranking.
A larger shared setting that may offer more common spaces and organized community services.
Walk Score
Walk Score: 54 / 100 Rank #249 / 668Walk Score — State benchmarkedThis home is ranked 249th out of 668 homes in Pennsylvania. Shows how walkable this facility's neighborhood is compared to the average Walk Score across Pennsylvania facilities. Higher scores benefit residents, families, and staff.Rankings are based only on facilities in Pennsylvania that report data for that category. Facilities without available data are excluded from the ranking.Click the rank badge to see the full State ranking.Click here to see the full State ranking.
Moderately walkable. Some errands can be accomplished on foot, with a mix of nearby amenities.

Therapy & Rehabilitation

2 services
Rehabilitation Services
Respite Care

Amenities & Lifestyle

Well-Appointed Patient Suites
Fine Dining With A Variety Of Menu Selections
Beautiful Courtyard
Inviting Lounges & Activity Areas
Complimentary Wifi & Cable
Housekeeping & Laundry
Beauty & Barber Services
Religious Services
Stimulating Recreation Activities
Local Trips & Outings
Specific ProgramsSubacute Rehab, Urgent SNF™ Service, Care Navigation.
Religious ServicesYes

Dining & Nutrition

Food DescriptionFine dining with a variety of menu selections.

Contact Markley Rehabilitation & Healthcare Center

Staffing Data

Reporting period: October 1 – December 31, 2025 (Q4 2025). Source: CMS Payroll-Based Journal report.

Total staff 134
Employees 107
Contractors 27
Staff to resident ratio 1.23 : 1
33% fewer staff per resident than Pennsylvania average
Pennsylvania average ratio: 1.83 : 1 Pennsylvania average ratio: 1.83 : 1See full Pennsylvania ranking
Avg staff/day 56
Average shift 8.1 hours
0% compared with Pennsylvania average
Pennsylvania average: 7.8 hours Pennsylvania average shift: 7.8 hoursSee full Pennsylvania ranking
Total staff hours (quarter) 41,560

Nursing staff breakdown

Q4 2025 · Oct 1 – Dec 31 More info This data comes from the CMS Payroll-Based Journal report covering October 1 – December 31, 2025.
Registered Nurse

Manages medical care and health needs.

RN Staff Info 18 total: 12 full-time employees and 6 contractors. 18
Average shift length Info Average shift length. Calculated as total hours divided by days worked and average staff per day. 8 hours
Licensed Practical Nurse

Assists with medical care and medications.

LPN Staff Info All 20 LPN Staff are full-time employees. No contractors work on this role. 20
Average shift length Info Average shift length. Calculated as total hours divided by days worked and average staff per day. 9.2 hours
Certified Nursing Assistant

Helps with daily care and mobility.

CNA Staff Info 72 total: 63 full-time employees and 9 contractors. 72
Average shift length Info Average shift length. Calculated as total hours divided by days worked and average staff per day. 8 hours

Contractor staffing

Q4 2025 · Oct 1 – Dec 31 More info This data comes from the CMS Payroll-Based Journal report covering October 1 – December 31, 2025.

Total hours from contractors

8.5%

3,522 contractor hours this quarter

Certified Nursing Assistant: 9 Registered Nurse: 6 Speech Language Pathologist: 5 Respiratory Therapy Technician: 3 Physical Therapy Assistant: 2 Qualified Social Worker: 1 Physical Therapy Aide: 1

Staff by category

Q4 2025 · Oct 1 – Dec 31 More info This data comes from the CMS Payroll-Based Journal report covering October 1 – December 31, 2025.
Certified Nursing Assistant6397221,44292100%8
Licensed Practical Nurse200208,00192100%9.2
Registered Nurse126184,65692100%8
Clinical Nurse Specialist4041,6726672%9.1
Other Dietary Services Staff3031,40392100%7.3
Speech Language Pathologist0558427278%7.1
Physical Therapy Assistant0228248289%6.6
Nurse Practitioner1015606470%8.8
Mental Health Service Worker1014966267%8
Dietitian1014245358%8
Administrator2024085155%8
Physical Therapy Aide0113805762%6.7
Qualified Social Worker0113595762%6.3
Respiratory Therapy Technician033931820%4.9
72 Certified Nursing Assistant
% of Days 100%
20 Licensed Practical Nurse
% of Days 100%
18 Registered Nurse
% of Days 100%
4 Clinical Nurse Specialist
% of Days 72%
3 Other Dietary Services Staff
% of Days 100%
5 Speech Language Pathologist
% of Days 78%
2 Physical Therapy Assistant
% of Days 89%
1 Nurse Practitioner
% of Days 70%
1 Mental Health Service Worker
% of Days 67%
1 Dietitian
% of Days 58%
2 Administrator
% of Days 55%
1 Physical Therapy Aide
% of Days 62%
1 Qualified Social Worker
% of Days 62%
3 Respiratory Therapy Technician
% of Days 20%

Penalties and fines

Includes penalties issued in 2023

Federal penalties imposed by CMS for regulatory violations, including civil money penalties (fines) and denials of payment for new Medicare/Medicaid admissions.

Source: CMS Penalties Database (Data as of Jan 2026)

Total fines amount $20K Rank #153 / 210Federal fines — State benchmarkedThis home is ranked 153rd out of 210 homes in Pennsylvania. Shows this facility's cumulative CMS federal fine dollars versus the Pennsylvania average among facilities with fines, and where it ranks among 210 facilities in the pool. Lower total dollars mean a better rank.Rankings are based only on facilities in Pennsylvania that report data for that category. Facilities without available data are excluded from the ranking.Click the rank badge to see the full State ranking.Click here to see the full State ranking.
65% lower than Pennsylvania average

Pennsylvania average: $59K

Number of fines 2
In line with Pennsylvania average

Pennsylvania average: 2.1

Payment Denials Info Serious action where Medicare and/or Medicaid temporarily stops payments for new residents until issues are fixed. 0
100% fewer payment denials than Pennsylvania average

Pennsylvania average: 0.2

Fines amount comparison
This facility $20K
Pennsylvania average $59K
Penalty History

Penalties are imposed by CMS for violations of federal nursing home regulations.

1 penalty in the past 3 years

Jul 19, 2023 · $9K

Civil Money Penalty Info Fines imposed for noncompliance, which can be assessed per day or per instance of violation. Jul 19, 2023
$9K

Last updated: Jan 2026

Quality of care over time

These measures show how residents usually do over time at this home, based on health outcomes and preventive care.

High-risk clinical events score Info A composite score based on pressure ulcers, falls with injury, weight loss, walking ability decline, and activities of daily living decline. 4.5
59% better than Pennsylvania average

Pennsylvania average: 11.0

Functional decline score Info A composite score based on activities of daily living decline, walking ability decline, and incontinence. 13.9
37% better than Pennsylvania average

Pennsylvania average: 22.2

Long-stay resident measures
Significantly above average Pennsylvania avg: 3.7 Info CMS star rating based on long-stay quality measure performance. 5 stars = significantly above average, 1 star = significantly below average.
Need for Help with Daily Activities Increased Info Percent of long-stay residents whose need for help with daily activities has increased 8.5%
55% better than Pennsylvania average

Pennsylvania average: 19.0%

Walking Ability Worsened Info Percent of long-stay residents whose ability to move independently worsened 10.1%
52% better than Pennsylvania average

Pennsylvania average: 21.1%

Low Risk Residents with Bowel/Bladder Incontinence Info Percent of low risk long-stay residents who lose control of their bowels or bladder 23.3%
13% better than Pennsylvania average

Pennsylvania average: 26.7%

Falls with Major Injury Info Percent of long-stay residents experiencing one or more falls with major injury 0.9%
73% better than Pennsylvania average

Pennsylvania average: 3.2%

High Risk Residents with Pressure Ulcers Info Percent of long-stay high risk residents with pressure ulcers 1.5%
72% better than Pennsylvania average

Pennsylvania average: 5.5%

Urinary Tract Infection Info Percent of long-stay residents with a urinary tract infection 0.0%
100% better than Pennsylvania average

Pennsylvania average: 1.8%

Lost Too Much Weight Info Percent of long-stay residents who lose too much weight 1.6%
76% better than Pennsylvania average

Pennsylvania average: 6.6%

Depressive Symptoms Info Percent of long-stay residents who have depressive symptoms 4.1%
25% better than Pennsylvania average

Pennsylvania average: 5.5%

Antipsychotic Use Info Percent of long-stay residents who received an antipsychotic medication 9.2%
46% better than Pennsylvania average

Pennsylvania average: 17.1%

Pneumococcal Vaccine Info Percent of long-stay residents assessed and appropriately given the pneumococcal vaccine 92.7%
7% better than Pennsylvania average

Pennsylvania average: 86.9%

Influenza Vaccine Info Percent of long-stay residents assessed and appropriately given the seasonal influenza vaccine 99.0%
6% better than Pennsylvania average

Pennsylvania average: 93.5%

Hospitalizations per 1,000 days Info Number of hospitalizations per 1,000 long-stay resident days. 1.95
16% worse than Pennsylvania average

Pennsylvania average: 1.68

ED visits per 1,000 days Info Number of outpatient emergency department visits per 1,000 long-stay resident days. 0.82
32% better than Pennsylvania average

Pennsylvania average: 1.20

Short-stay resident measures
Significantly above average Pennsylvania avg: 3.2 Info CMS star rating based on short-stay quality measure performance. 5 stars = much above average, 1 star = much below average.
Pneumococcal Vaccine Info Percent of short-stay residents assessed and appropriately given the pneumococcal vaccine 81.9%
19% better than Pennsylvania average

Pennsylvania average: 68.8%

Antipsychotic medication increase Info Percent of short-stay residents who newly received an antipsychotic medication 1.5%
In line with Pennsylvania average

Pennsylvania average: 1.5%

Influenza Vaccine Info Percent of short-stay residents assessed and appropriately given the seasonal influenza vaccine 53.1%
23% worse than Pennsylvania average

Pennsylvania average: 68.7%

Re-hospitalized after SNF stay Info Percentage of short-stay residents who were re-hospitalized after their nursing home admission. 21.9%
5% better than Pennsylvania average

Pennsylvania average: 23.1%

Emergency department visits Info Percentage of short-stay residents who had an outpatient emergency department visit. 6.0%
39% better than Pennsylvania average

Pennsylvania average: 9.8%

Falls with major injury Info Percentage of SNF residents who experience falls with major injury during their stay. 0.0%
100% better than Pennsylvania average

Pennsylvania average: 0.8%

Ability to care for self at discharge Info Percentage of residents at or above expected ability to care for themselves at discharge. 58.2%
8% better than Pennsylvania average

Pennsylvania average: 53.7%

Successful return to home or community Info Rate of successful return to home or community from a skilled nursing facility. 44.7%
12% worse than Pennsylvania average

Pennsylvania average: 50.6%

Breakdown by payment type

Medicare

41% of new residents, usually for short-term rehab.

Typical stay 1 - 2 months

Private pay

44% of new residents, often for short stays.

Typical stay 1 - 2 months

Medicaid

15% of new residents, often for long-term daily care.

Typical stay 1 - 2 years

Facility Characteristics

Source: CMS Long-Term Care Facility Characteristics (Data as of Jan 2026)

Total residents 109
Medicare
13
11.9% of residents
Medicaid
74
67.9% of residents
Private pay or other
22
20.2% of residents
Programs & Services
Residents Group

Residents meet regularly to discuss policies, care quality, and activities

Active Resident Council

Organized group of residents that meets regularly to discuss facility policies, quality of life, and activities.

Finances and operations

Based on CMS SNF Cost Report for fiscal year ending in 12/2023.

Privately-owned community
Operated by a single business entity.
Net patient revenue Info Net patient revenue — what the home actually collects for resident care, after contractual allowances, bad debt and discounts are subtracted from its gross charges (CMS cost report, Worksheet G-3). It covers resident care only; money the home earns from other sources is shown separately as "Other income."
$14.5M
Net patient income Info Net patient income: net patient revenue minus the home's total operating expenses. A positive figure means it earns more from resident care than it spends to deliver it; a negative figure means the opposite. It excludes non-operating "other income."
$733.0K
Privately-owned community Operated by a single business entity.
Net patient revenue Info Net patient revenue — what the home actually collects for resident care, after contractual allowances, bad debt and discounts are subtracted from its gross charges (CMS cost report, Worksheet G-3). It covers resident care only; money the home earns from other sources is shown separately as "Other income."
$14.5M Rank #150 / 209Revenue — State benchmarkedThis home is ranked 150th out of 209 homes in Pennsylvania. Shows this facility's annual revenue compared to the Pennsylvania average. Higher revenue generally means more resources for staffing and capital — read alongside Payroll %.Rankings are based only on facilities in Pennsylvania that report data for that category. Facilities without available data are excluded from the ranking.Click the rank badge to see the full State ranking.Click here to see the full State ranking.
Net patient income Info Net patient income: net patient revenue minus the home's total operating expenses. A positive figure means it earns more from resident care than it spends to deliver it; a negative figure means the opposite. It excludes non-operating "other income."
$733.0K
Other income Info Money the home earns outside of resident care — such as investments, grants, rentals and other non-operating sources (CMS cost report, Worksheet G-3). It is tracked separately from net patient revenue: it is not part of that figure, and it is not included in net patient income.
$24.6K
Payroll costs Info Staff salaries plus wage-related costs — benefits such as payroll taxes, health insurance and retirement — from the home's own accounting records (CMS cost report, Worksheet A). Contract or agency labor is counted separately, under other operating costs. Rank #131 / 209Payroll — State benchmarkedThis home is ranked 131st out of 209 homes in Pennsylvania. Shows total annual staff payroll benchmarked to the Pennsylvania average. Higher payroll investment relative to peers often signals better staffing and less reliance on cheaper contract labor.Rankings are based only on facilities in Pennsylvania that report data for that category. Facilities without available data are excluded from the ranking.Click the rank badge to see the full State ranking.Click here to see the full State ranking.
$7.2M 49.6% of net patient revenue Info Payroll as a share of revenue: staff salaries and wage-related benefits divided by net patient revenue. A higher figure means more of each revenue dollar goes to staff pay. Rank #42 / 209Payroll % — State benchmarkedThis home is ranked 42nd out of 209 homes in Pennsylvania. Shows payroll as a percentage of revenue versus the Pennsylvania average. Well-run Pennsylvania facilities typically land around 53–61% — the top third Statewide. Below 25% may signal understaffing or heavy agency use — read with Staffing ratings.Rankings are based only on facilities in Pennsylvania that report data for that category. Facilities without available data are excluded from the ranking.Click the rank badge to see the full State ranking.Click here to see the full State ranking.
Other operating costs Info Everything it costs to run the home apart from payroll — food, utilities, supplies, maintenance, contract labor and administration. Calculated as total operating expense minus payroll (staff salaries and wage-related benefits).
$6.6M
Total costs Info The home's total operating expense for the year — all the costs of running it, salaries included (CMS cost report, Worksheet G-3).
$13.8M

What does this home offer?

Housing options icon

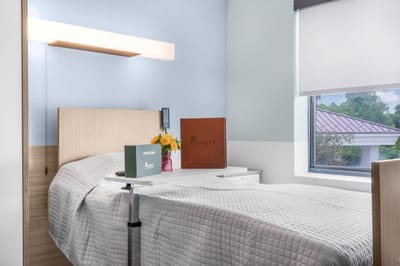
Housing Options: Suites

Building type icon
Building type icon

Building Type: 3-story

Beauty services icon

Beauty Services

Housekeeping icon
Housekeeping icon

Housekeeping Services

Recreational activities icon

Recreational Activities

Exercise program icon

Exercise Programs

Who this home usually serves

TYPE OF STAY

Mix of rehab and long-term care

This home supports both short-term rehab and long-term care, with residents staying for a wide range of durations.

New residents most often arrive under private pay (44% of admissions), and a typical private pay stay runs around 1 - 2 months.

Admissions
359 total

Coverage residents most often arrive under.

Medicare 41%
Private pay 44%
Medicaid 15%
Discharges
359 total

Coverage residents most often leave under.

Medicare 34%
Private pay 37%
Medicaid 29%

Managed by Nha Dean Mcgroarty

Administrator

Dean McGroarty, NHA, serves as the Administrator at Markley Rehabilitation & Healthcare Center. He leads the community with a focus on providing quality care and fostering a supportive environment for residents and staff.

Places of interest near Markley Rehabilitation & Healthcare Center

Address 8.2 miles from city center Info Estimated distance in miles from Norristown's city center to Markley Rehabilitation & Healthcare Center's address, calculated via Google Maps.

Calculate Travel Distance to Markley Rehabilitation & Healthcare Center

Add your location

Address

Compare Nursing Homes around Montgomery County

The information below is reported by the Pennsylvania Department of Human Services and Department of Health.

5 facilities compared · CMS & PA Dept. of Health data

Gwynedd Healthcare & Rehabilitation Center
NH
HC
MC
RC
Lansdale (Sumneytown Pike)
181
Facility 181
PA AVG 94
Rank #26 / 555
92.7%
Facility 92.7%
PA AVG 78.7%
Rank #36 / 518
+18%
4.09
Facility 4.09
PA AVG 4.15
Rank #111 / 207
-41%-1%
$24.1k
Facility $24.1k
PA AVG $61.2k
Rank #179 / 210
-
17
Facility 17
PA AVG 31.3
Rank #103 / 207
3.4
Facility 3.4
PA AVG 4.4
Rank #95 / 207
1172-
8
Facility 8
PA AVG 46
Rank #611 / 668
Michelle Taylor
$22.6M
Facility $22.6M
PA AVG $32.8M
Rank #94 / 209
$10.1M
Facility $10.1M
PA AVG $6.7M
Rank #77 / 209
44.5%
Facility 44.5%
PA AVG 40%
Rank #84 / 209
395479
Sanatoga Court
NH
MC
Pottstown
85
Facility 85
PA AVG 94
Rank #268 / 555
58.8%
Facility 58.8%
PA AVG 78.7%
Rank #372 / 518
-25%
3.42
Facility 3.42
PA AVG 4.15
Rank #186 / 207
-50%-18%
$0
Facility $0
PA AVG $61.2k
Rank #1 / 210
81
Facility 81
PA AVG 83
Rank #274 / 460
15
Facility 15
PA AVG 31.3
Rank #92 / 207
1.7
Facility 1.7
PA AVG 4.4
Rank #27 / 207
-50-
25
Facility 25
PA AVG 46
Rank #501 / 668
227 Evergreen Road Operations LLC
$17.3M
Facility $17.3M
PA AVG $32.8M
Rank #87 / 209
$6.5M
Facility $6.5M
PA AVG $6.7M
Rank #166 / 209
37.6%
Facility 37.6%
PA AVG 40%
Rank #203 / 209
395904
Ambler Extended Care Center
NH
HC
MC
RC
Ambler (Rose Valley)
100
Facility 100
PA AVG 94
Rank #203 / 555
90.7%
Facility 90.7%
PA AVG 78.7%
Rank #51 / 518
+15%
3.46
Facility 3.46
PA AVG 4.15
Rank #174 / 207
-17%-16%
$0
Facility $0
PA AVG $61.2k
Rank #1 / 210
-
11
Facility 11
PA AVG 31.3
Rank #72 / 207
2.8
Facility 2.8
PA AVG 4.4
Rank #64 / 207
-94-
84
Facility 84
PA AVG 46
Rank #59 / 668
Cody Meenan
$11.6M
Facility $11.6M
PA AVG $32.8M
Rank #162 / 209
$6.7M
Facility $6.7M
PA AVG $6.7M
Rank #153 / 209
58%
Facility 58%
PA AVG 40%
Rank #53 / 209
395176
Montgomeryville Skilled Nursing and Rehabilitation Center
NH
Montgomeryville
155
Facility 155
PA AVG 94
Rank #45 / 555
78.2%
Facility 78.2%
PA AVG 78.7%
Rank #177 / 518
-1%
7.50
Facility 7.50
PA AVG 4.15
Rank #3 / 207
+14%+81%
$0
Facility $0
PA AVG $61.2k
Rank #1 / 210
-
40
Facility 40
PA AVG 31.3
Rank #158 / 207
3.3
Facility 3.3
PA AVG 4.4
Rank #90 / 207
-54-
27
Facility 27
PA AVG 46
Rank #489 / 668
-
$16.1M
Facility $16.1M
PA AVG $32.8M
Rank #121 / 209
$6.3M
Facility $6.3M
PA AVG $6.7M
Rank #108 / 209
39%
Facility 39%
PA AVG 40%
Rank #101 / 209
395796
Markley Rehabilitation & Healthcare Center
NH
HC
MC
NC
PC
RC
Norristown (East Fornance Street)
121
Facility 121
PA AVG 94
Rank #122 / 555
92.5%
Facility 92.5%
PA AVG 78.7%
Rank #38 / 518
+18%
3.51
Facility 3.51
PA AVG 4.15
Rank #174 / 207
+12%-15%
$9.3k
Facility $9.3k
PA AVG $61.2k
Rank #153 / 210
-
33
Facility 33
PA AVG 31.3
Rank #150 / 207
3.3
Facility 3.3
PA AVG 4.4
Rank #90 / 207
2113-
54
Facility 54
PA AVG 46
Rank #249 / 668
-
$14.5M
Facility $14.5M
PA AVG $32.8M
Rank #150 / 209
$7.2M
Facility $7.2M
PA AVG $6.7M
Rank #131 / 209
49.6%
Facility 49.6%
PA AVG 40%
Rank #42 / 209
395483

Financial Assistance for
Nursing Home in Pennsylvania

Markley Rehabilitation & Healthcare Center is located in Norristown, Pennsylvania.
Here are the financial assistance programs available to residents in Pennsylvania.

Get Financial aid guidance

Community HealthChoices (CHC)

PA Medicaid CHC

Age 65+ or disabled
General Pennsylvania resident, Medicaid-eligible, nursing home-level care need.
Income Limits (2025) ~$2,829/month 300% FBR, individual
Asset Limits $2,000 (individual), $3,000 (couple) (excludes home, car).
PA

Managed care model; high urban demand (e.g., Philadelphia, Pittsburgh).

Benefits
Personal care (5-7 hours/day, e.g., bathing, dressing) Respite care (up to 240 hours/year) Adult day care ($70/day) Home modifications ($1,500 avg.)

Pennsylvania OPTIONS Program

PA OPTIONS

Age 60+
General Pennsylvania resident, at risk of nursing home placement.
Income Limits ~$2,000/month individual, varies by region
Asset Limits $8,000 individual
PA

Cost-sharing required above certain income; rural/urban balance.

Benefits
In-home care (3-5 hours/week) Respite (up to 10 days/year) Adult day care (~$70/day) Transportation (~5 trips/month)

Living Independence for the Elderly (LIFE)

Pennsylvania LIFE (PACE)

Age 55+
General PA resident (specific counties), NFLOC, safe with LIFE support.
Income Limits (2025) ~$2,829/month (Medicaid-eligible); private pay option available.
Asset Limits $2,000 (individual), $3,000 (couple) for Medicaid enrollees.
PA

16 providers in 25 counties (e.g., Allegheny, Luzerne); LIFE branding unique to PA.

Benefits
Personal care (5-7 hours/day) Medical care Meals Transportation Respite Therapies

Medicare Savings Program (MSP)

Pennsylvania Medicare Savings Program

Age 65+ or disabled
General PA resident, Medicare Part A/B.
Income Limits (2025) ~$2,510/month (QMB), ~$3,380/month (SLMB), ~$3,598/month (QI)—individual.
Asset Limits $9,430 (individual), $14,130 (couple).
PA

Three tiers; includes Extra Help for Part D; no waitlist.

Benefits
Covers Part B premiums ($174.70/month) Deductibles ($240/year) Copays (~20%)

Family Caregiver Support Program (FCSP)

Pennsylvania Family Caregiver Support Program

Age
General Caregivers of 60+ needing care or 55+ caregivers of others; PA resident; functional needs (2+ ADLs).
Income Limits (2025) No strict cap; reimbursements up to $600/month if care recipient income < ~$2,322/month 185% FPL
Asset Limits Not assessed; need-based.
PA

High demand; includes grandparent caregivers.

Benefits
Respite (4-6 hours/week or 5 days/year) Adult day care ($60/day) Supplies (~$2,000/year) Caregiver training

VA Aid and Attendance (A&A) and Housebound Benefits

Pennsylvania VA Aid and Attendance/Housebound

Age 65+ or disabled veteran/spouse
General PA resident, wartime service, need for ADL help (A&A) or homebound.
Income Limits (2025) Net income < ~$1,984/month (veteran with dependent, A&A); pension offsets income.
Asset Limits ~$155,356 net worth limit
PA

High veteran population; supports rural/urban care needs.

Benefits
Cash (~$1,433-$2,642/month veteran, ~$951-$1,318 spouse) for care costs (e.g., in-home, assisted living)

Property Tax/Rent Rebate Program (PTRR)

Pennsylvania Property Tax/Rent Rebate Program

Age 65+
General PA resident, homeowner/renter (or widow/er 50+, disabled 18+).
Income Limits (2025) ~$45,000/year individual or couple, excludes half of Social Security
Asset Limits Not assessed; income-focused.
PA

Rebates up to $1,000; ~600,000 eligible annually.

Benefits
Rebates ($250-$1,000 based on income; e.g., $1,000 if income < $8,000)

Senior Farmers’ Market Nutrition Program (SFMNP)

Pennsylvania SFMNP

Age 60+
General PA resident, low-income.
Income Limits (2025) ~$2,322/month individual, 185% FPL
Asset Limits Not assessed.
PA

Vouchers (~$50/season) via 52 AAAs; serves ~200,000 annually.

Benefits
Vouchers (~$50/season) for fresh produce at approved markets

Frequently Asked Questions about Markley Rehabilitation & Healthcare Center

What neighborhood is Markley Rehabilitation & Healthcare Center in?

Markley Rehabilitation & Healthcare Center is in the East Fornance Street neighborhood.

Is Markley Rehabilitation & Healthcare Center in a walkable area?

Markley Rehabilitation & Healthcare Center has a walk score of 54. Moderately walkable. Some errands can be accomplished on foot, with a mix of nearby amenities.

What is the occupancy rate at Markley Rehabilitation & Healthcare Center?

Markley Rehabilitation & Healthcare Center's occupancy is 92.5%.

Are there photos of Markley Rehabilitation & Healthcare Center?

Yes — there are 5 photos of Markley Rehabilitation & Healthcare Center in the photo gallery on this page.

What is the address of Markley Rehabilitation & Healthcare Center?

Markley Rehabilitation & Healthcare Center is located at 550 E Fornance St, Norristown, PA 19401.

What is the phone number of Markley Rehabilitation & Healthcare Center?

(610) 272-5600 will put you in contact with the team at Markley Rehabilitation & Healthcare Center.

Is Markley Rehabilitation & Healthcare Center Medicare or Medicaid certified?

Yes — Markley Rehabilitation & Healthcare Center is a CMS-certified provider of Medicare and Medicaid.

Guides for Better Senior Living

Care Cost Calculator: See Prices in Your Area

Nursing Home Data Explorer

Don’t Wait Too Long: 7 Red Flag Signs Your Parent Needs Assisted Living Now

The True Cost of Assisted Living in 2025 – And How Families Are Paying For It

Understanding Senior Living Costs: Pricing Models, Discounts & Financial Assistance