

Total health inspections
5
Hawaii average 4.4
Last Health inspection on Aug 2025

We arrange tours, appointments, and even moving support so you don’t have to

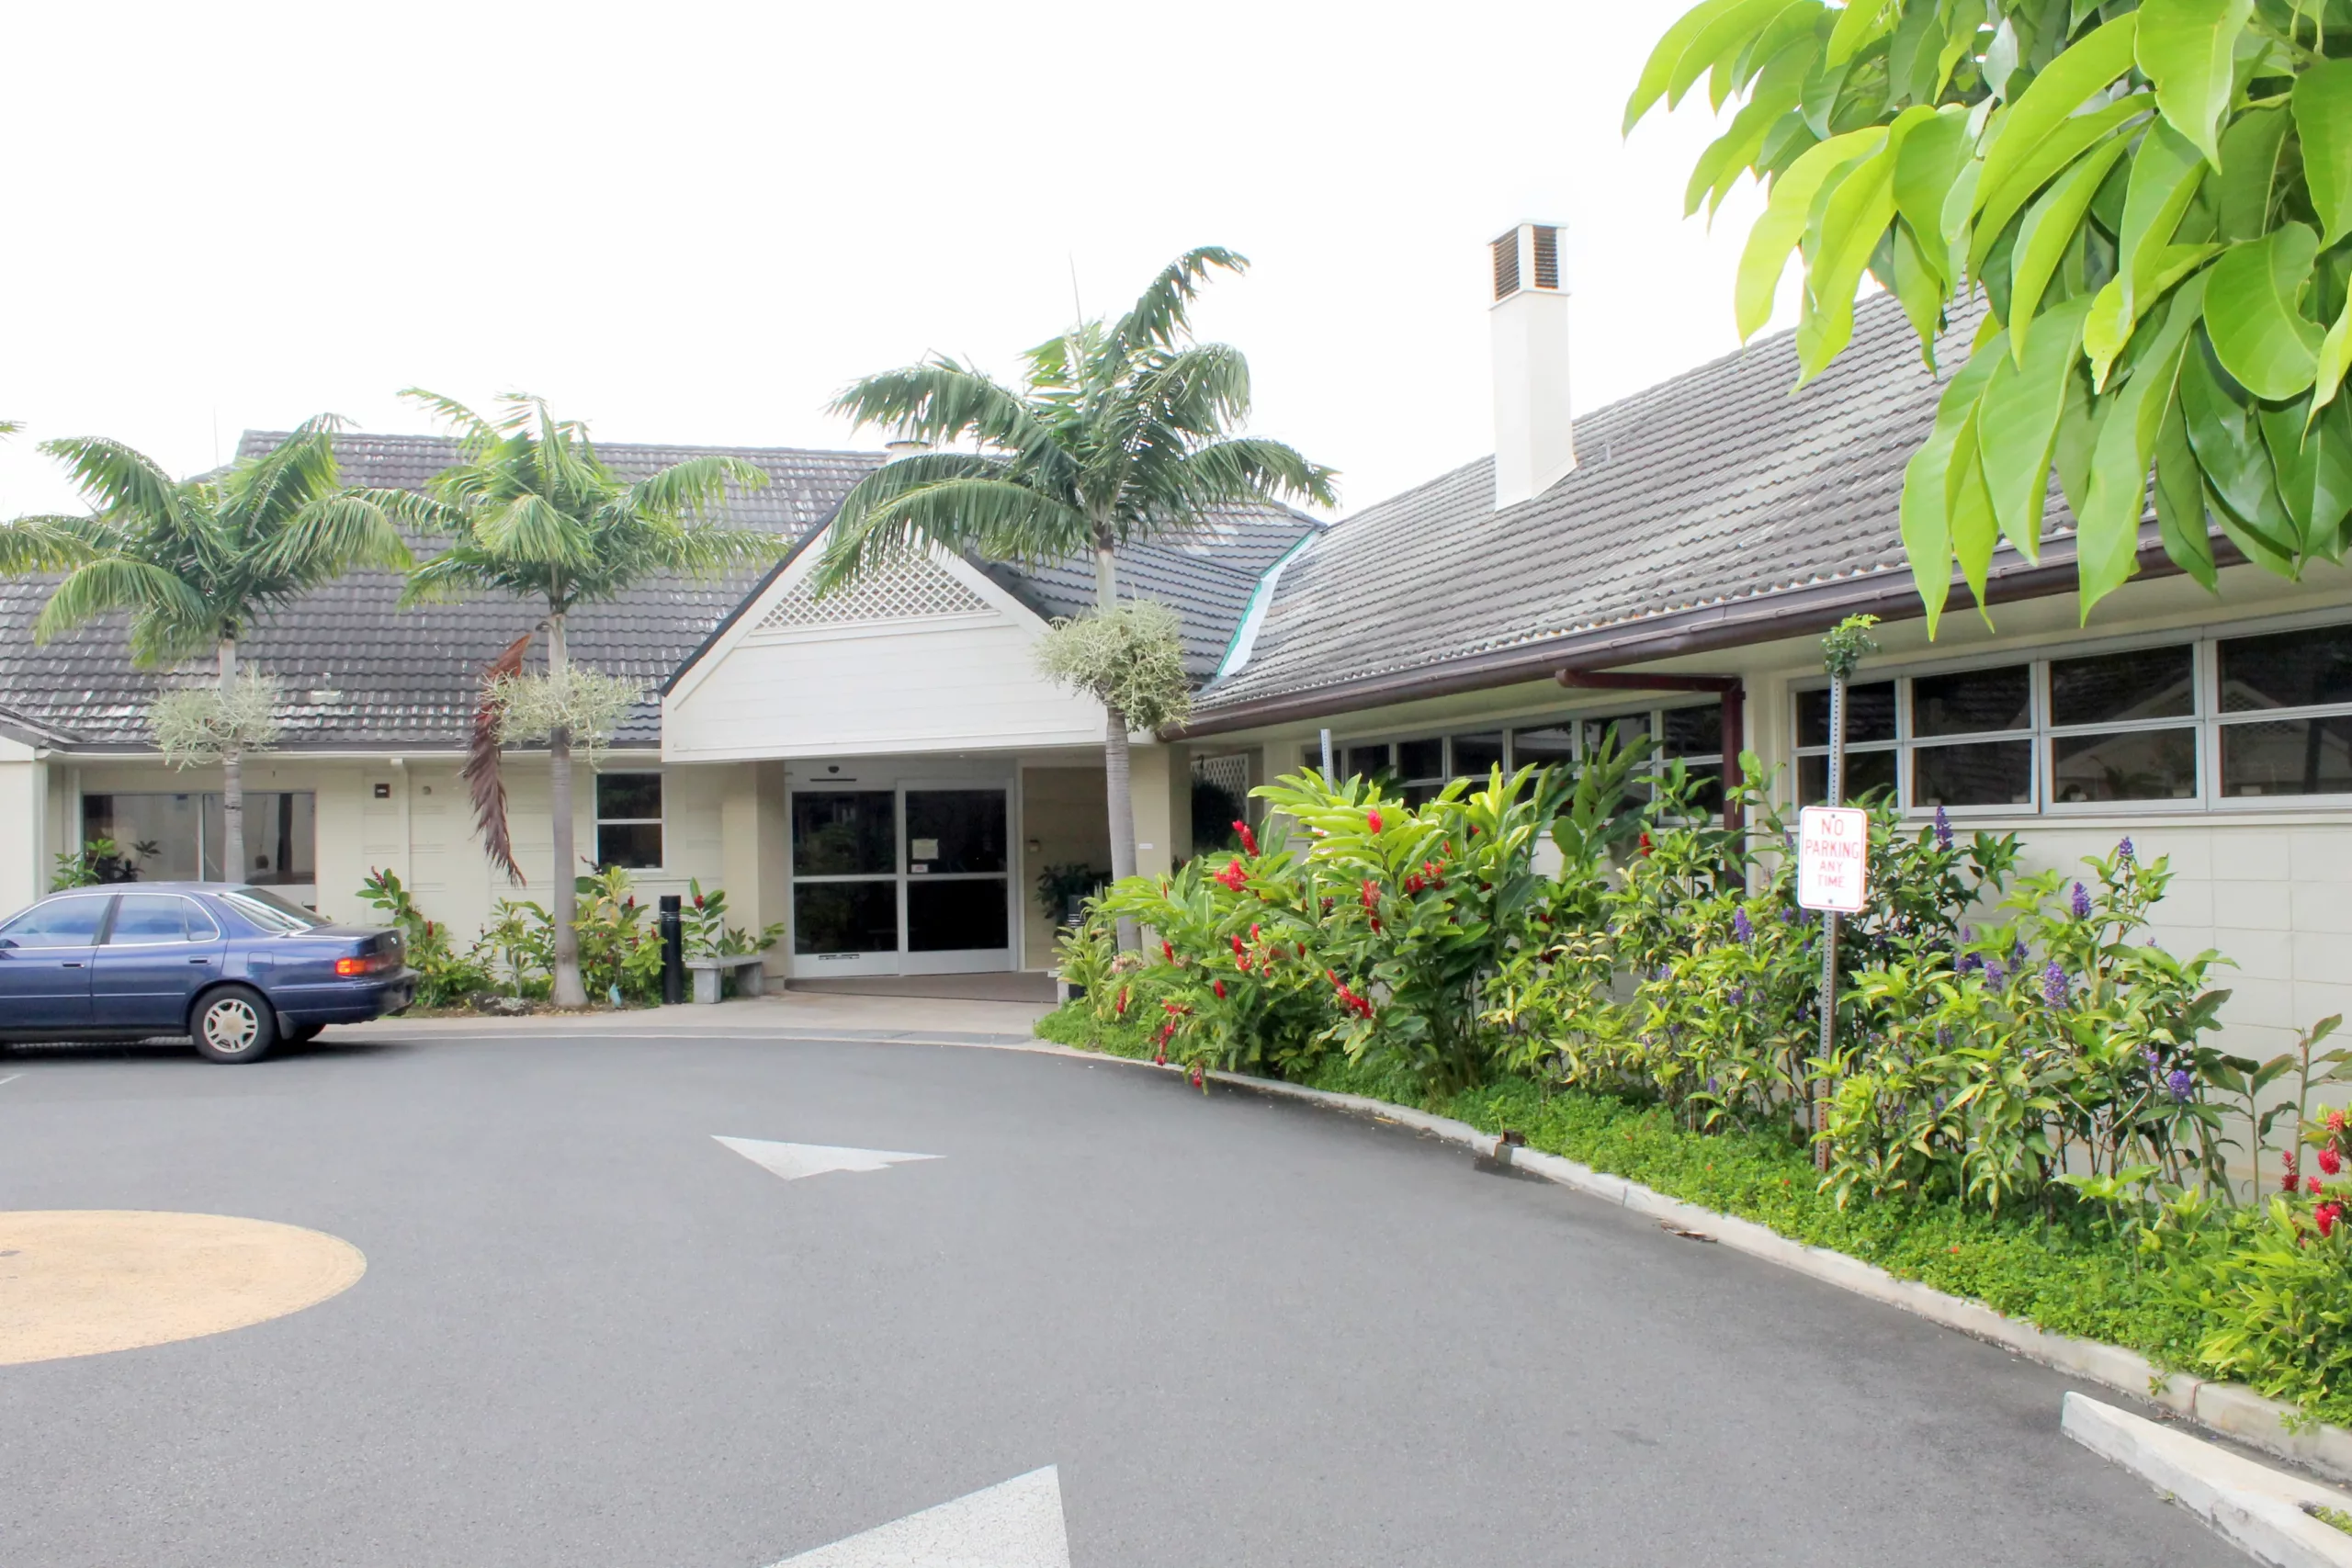
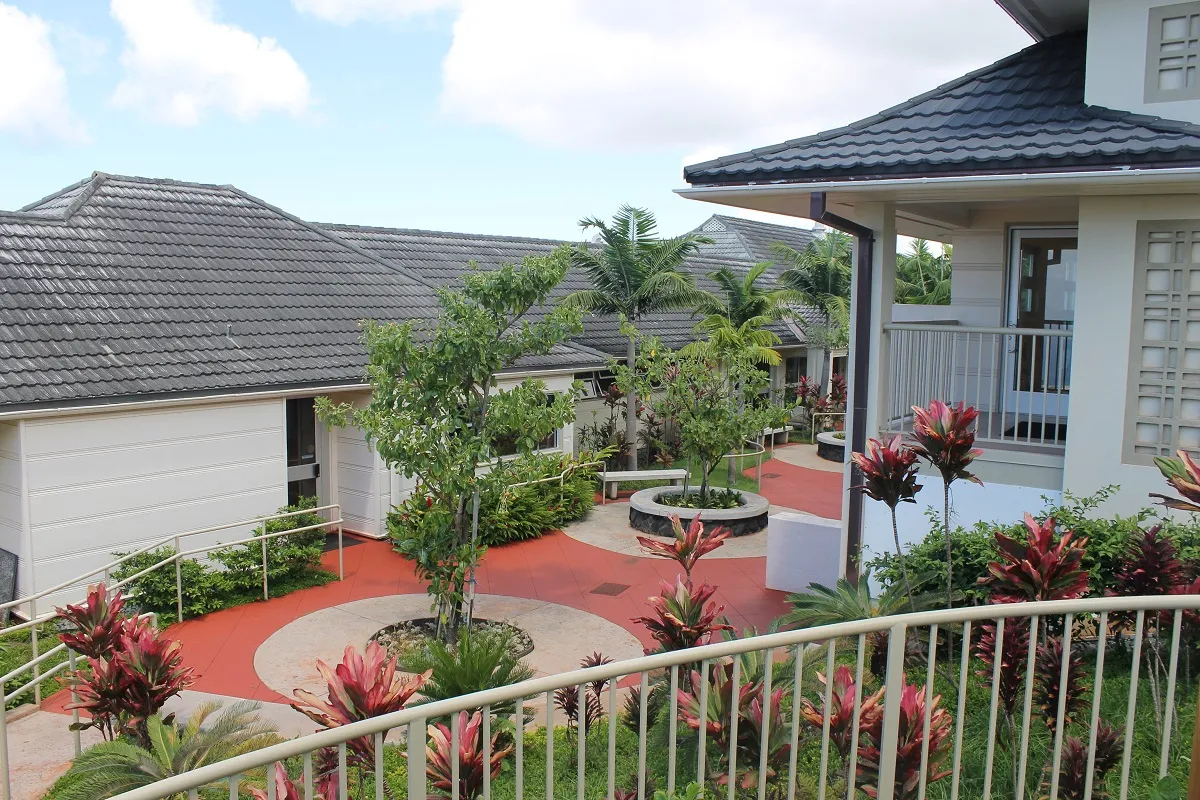

Maunalani Nursing and Rehabilitation Center provides an exemplary approach to skilled nursing; it has pioneered as the home for comprehensive rehabilitation and nursing. One of the longest continuum of care centers in Oahu, the long-term healthcare center gives attention to all levels of care, as well even the complex medical conditions. Maunlani Nursing Center boasts a comfortable and secure environment for a speedy recovery.
The nursing home is rehabilitative and focuses on receiving results in the services they offer; services include 24-hour nursing available, physicians available, and therapists– all provided to ensure residents all receive their holistic wellness. Therapy services include speech, occupational, and physical that sustain and strengthen daily skills.
Elaine P. Johnson was Maunalani Nursing and Rehabilitation Center’s first administrator, setting the foundation and pace for the community since it opened in 1950. Her leadership helped shape the facility’s commitment to compassionate senior care, establishing a lasting legacy that continues to influence Maunalani’s mission and culture today.
 Official CMS rating based on health inspections, staffing and quality measures.
Official CMS rating based on deficiencies found during state health inspections.
Official CMS rating based on nurse staffing hours per resident per day.
Official CMS rating based on clinical outcomes for residents.
Average daily nursing hours per resident (adjusted for acuity). Higher values indicate more nursing time per resident.
Hours of care per resident per day, broken down by staff type. Data from CMS Medicare.
Registered nurse hours per resident per day.
Licensed Practical Nurse / Licensed Vocational Nurse hours per resident per day.
Nurse aide hours per resident per day.
Total number of nurse staff hours per resident per day on weekends.
Physical therapist staff hours per resident per day.
Registered nurse hours per resident per day on weekends.
Official CMS rating based on health inspections, staffing and quality measures.
Official CMS rating based on deficiencies found during state health inspections.
Official CMS rating based on nurse staffing hours per resident per day.
Official CMS rating based on clinical outcomes for residents.
Average daily nursing hours per resident (adjusted for acuity). Higher values indicate more nursing time per resident.
Hours of care per resident per day, broken down by staff type. Data from CMS Medicare.
Registered nurse hours per resident per day.
Licensed Practical Nurse / Licensed Vocational Nurse hours per resident per day.
Nurse aide hours per resident per day.
Total number of nurse staff hours per resident per day on weekends.
Physical therapist staff hours per resident per day.
Registered nurse hours per resident per day on weekends.
Offers a balance of services and community atmosphere.
Occupancy is moderate, suggesting balanced demand.
Residents typically stay for brief periods, with frequent admissions and discharges throughout the year.
37% of new residents, usually for short-term rehab.
61% of new residents, often for short stays.
2% of new residents, often for long-term daily care.
The portion of the home's budget spent on staff, including nurses, caregivers, and other employees who support care and operations.
All remaining costs needed to run the home, such as food, utilities, building maintenance, supplies and administrative expenses.
Nursing Home 24/7 care needed
Assisted Living For seniors needing help with daily tasks but not full-time nursing.
Nursing Home 24/7 care needed
Assisted Living For seniors needing help with daily tasks but not full-time nursing.
Nursing Home 24/7 care needed
Assisted Living For seniors needing help with daily tasks but not full-time nursing.
Nursing Home 24/7 care needed
Assisted Living For seniors needing help with daily tasks but not full-time nursing.
Nursing Home 24/7 care needed
Assisted Living For seniors needing help with daily tasks but not full-time nursing.
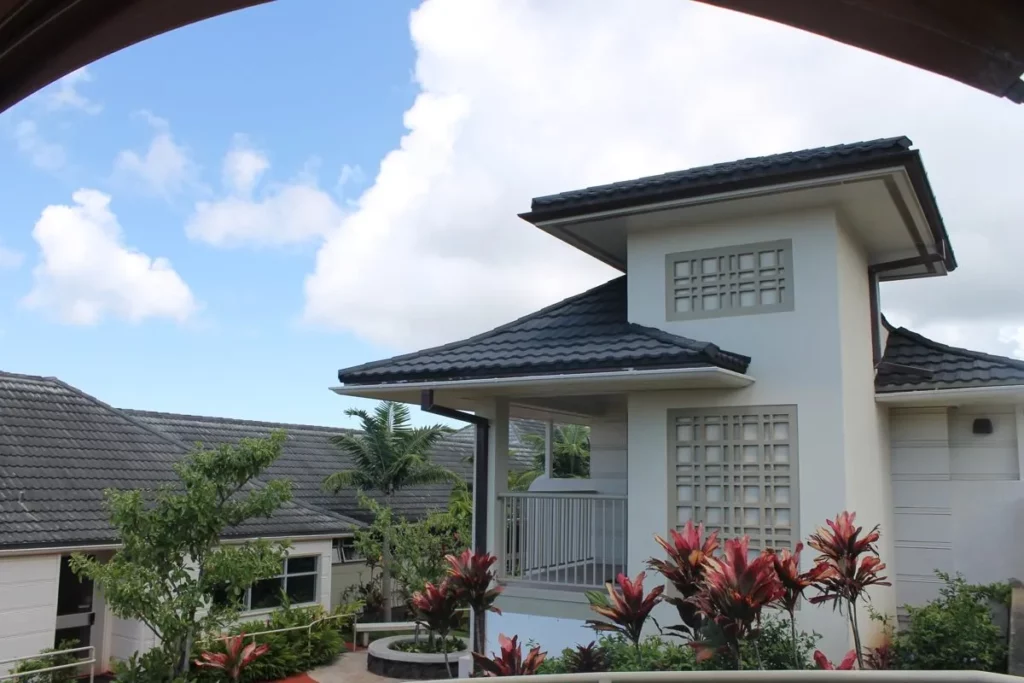 Maunalani Nursing and Rehabilitation Center
 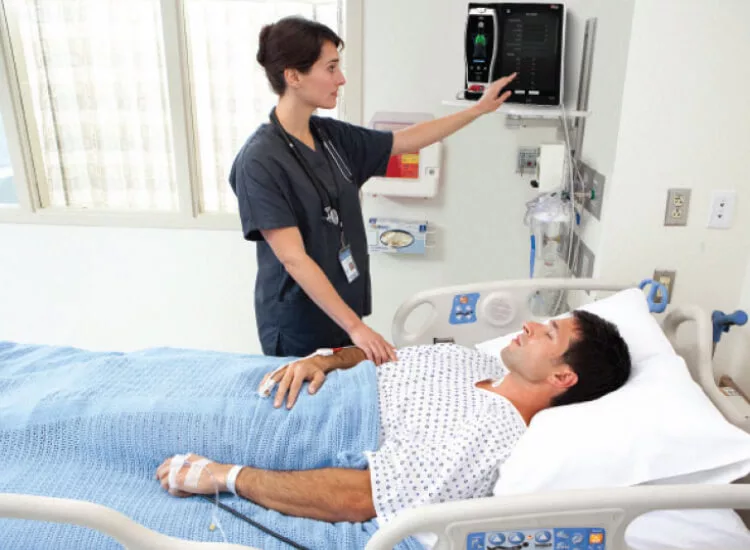 Islands Skilled Nursing and Rehab
 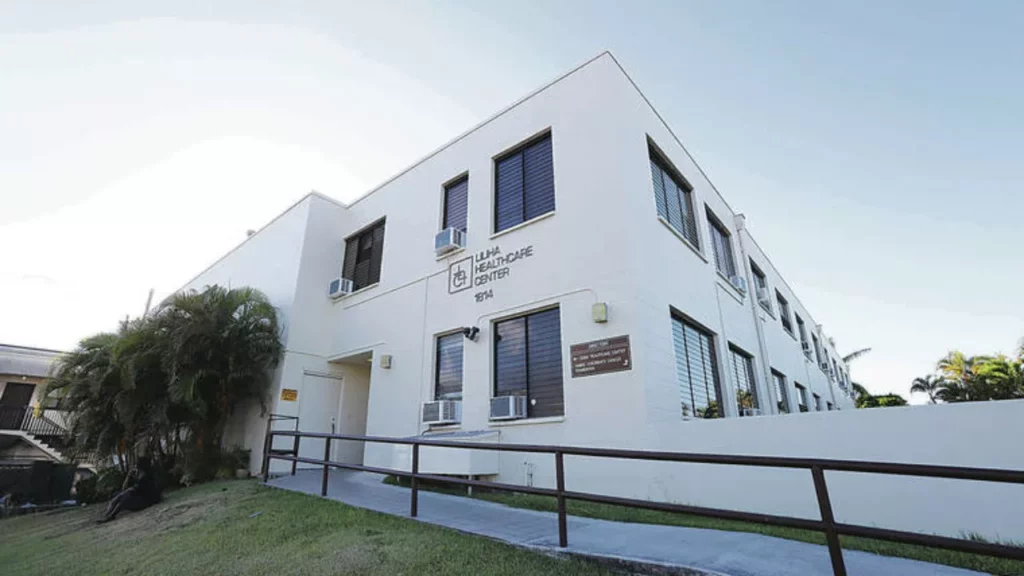 Liliha Healthcare Center
 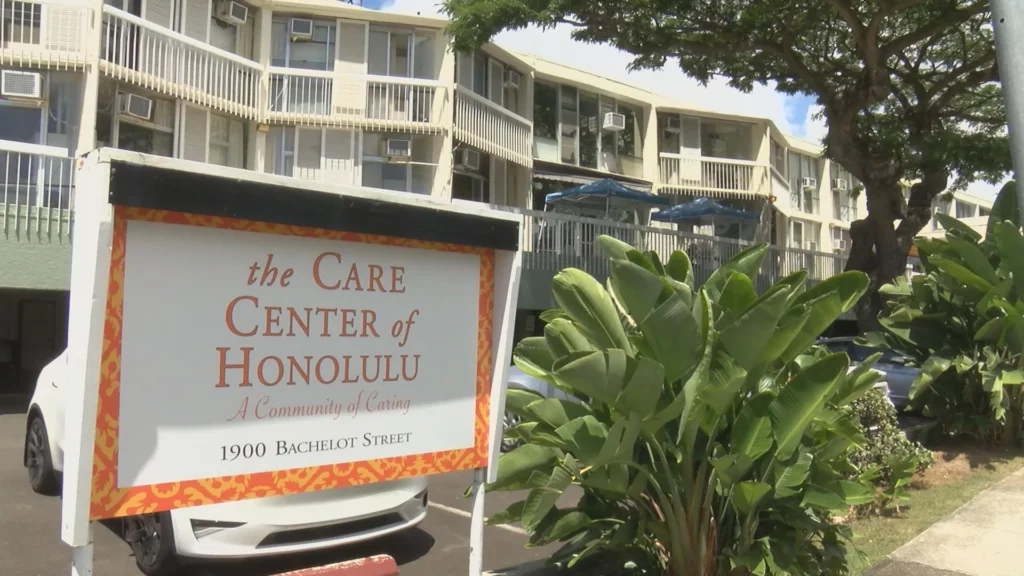 The Care Center of Honolulu
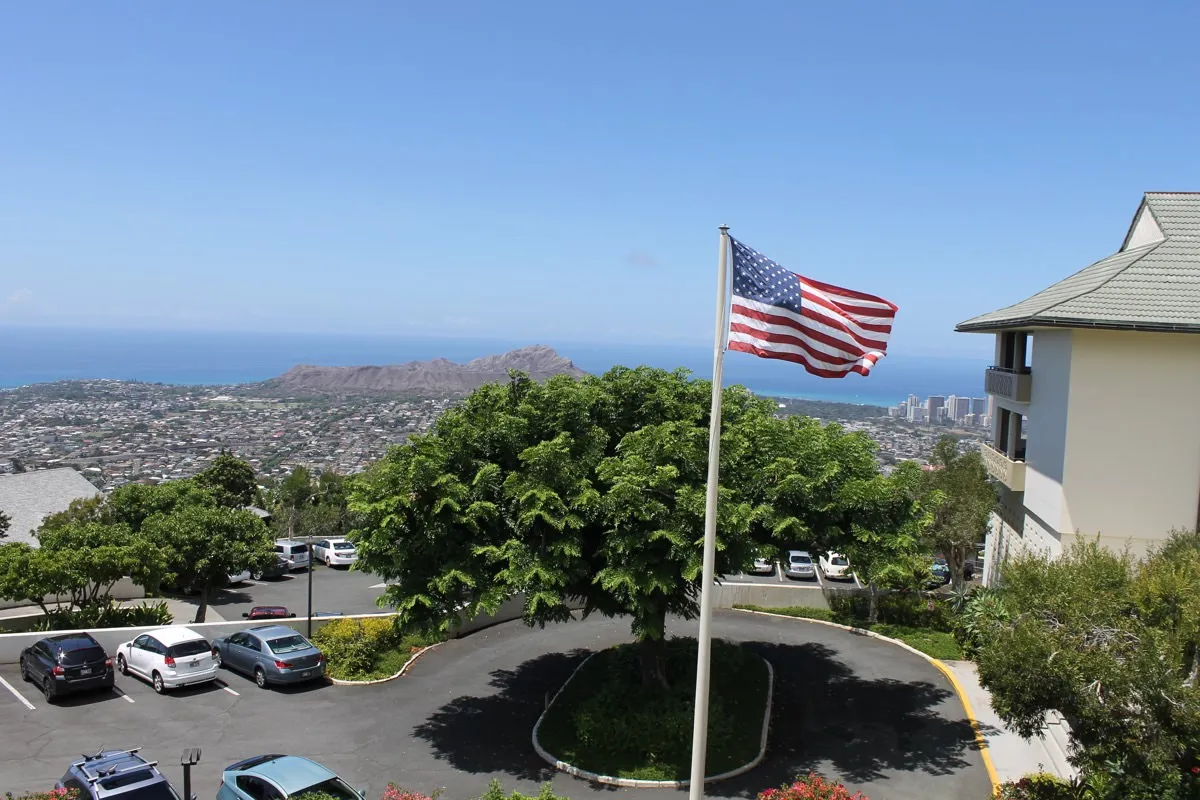
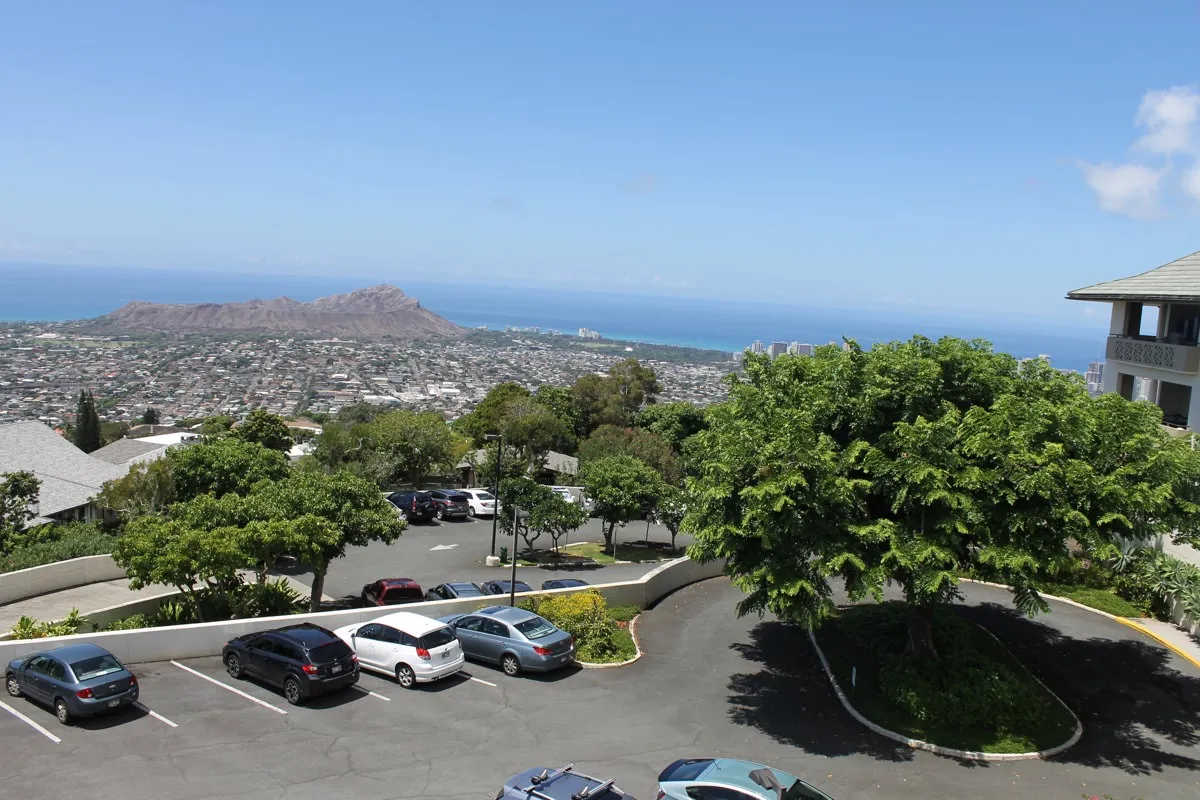
![]() 4.5 miles from city center — 1.86 miles to nearest hospital (Lu0113u02bbahi Hospital)
4.5 miles from city center — 1.86 miles to nearest hospital (Lu0113u02bbahi Hospital)
![]() 5113 Maunalani Cir, Honolulu, HI 96816
5113 Maunalani Cir, Honolulu, HI 96816
Add your location
Source: CMS Payroll-Based Journal (Q2 2025)
| Role ⓘ | Count ⓘ | Avg Shift (hrs) ⓘ | Uses Contractors? ⓘ |
|---|---|---|---|
| Registered Nurse | 29 | 7.8 | Yes |
| Licensed Practical Nurse | 12 | 8.4 | Yes |
| Certified Nursing Assistant | 60 | 7.3 | Yes |
| Role ⓘ | Employees ⓘ | Contractors ⓘ | Total Staff ⓘ | Total Hours ⓘ | Days Worked ⓘ | % of Days ⓘ | Avg Shift (hrs) ⓘ |
|---|---|---|---|---|---|---|---|
| Certified Nursing Assistant | 51 | 9 | 60 | 19,471 | 91 | 100% | 7.3 |
| Registered Nurse | 25 | 4 | 29 | 8,626 | 91 | 100% | 7.8 |
| Nurse Aide in Training | 29 | 0 | 29 | 6,046 | 91 | 100% | 6.8 |
| Licensed Practical Nurse | 8 | 4 | 12 | 3,660 | 91 | 100% | 8.4 |
| Other Dietary Services Staff | 16 | 0 | 16 | 3,327 | 91 | 100% | 7.6 |
| Dental Services Staff | 6 | 0 | 6 | 2,116 | 81 | 89% | 6.9 |
| Speech Language Pathologist | 0 | 9 | 9 | 1,320 | 73 | 80% | 7.1 |
| Physical Therapy Aide | 0 | 6 | 6 | 1,024 | 74 | 81% | 6.8 |
| Physical Therapy Assistant | 0 | 6 | 6 | 914 | 77 | 85% | 7.1 |
| Respiratory Therapy Technician | 0 | 6 | 6 | 667 | 81 | 89% | 6.9 |
| Qualified Social Worker | 0 | 1 | 1 | 598 | 65 | 71% | 9.2 |
| Nurse Practitioner | 1 | 0 | 1 | 504 | 63 | 69% | 8 |
| Dietitian | 1 | 0 | 1 | 432 | 54 | 59% | 8 |
| Administrator | 1 | 0 | 1 | 400 | 50 | 55% | 8 |
| Medical Director | 1 | 0 | 1 | 130 | 65 | 71% | 2 |
Hawaii average 4.4
Last Health inspection on Aug 2025
Health citations are formal notices following inspections when they fail to comply with safety and care standards.
15 of 21 citations resulted from standard inspections; 5 of 21 resulted from complaint investigations; and 1 of 21 came from combined inspections (standard and complaint).
Hawaii average: 0.1
Hawaii average: 1
Data sourced from CMS Health Deficiencies reports. Citation severity codes range from A (least serious) to L (most serious). Immediate Jeopardy (J-L) citations indicate situations where the facility's noncompliance has placed residents at risk of death or serious harm.
Source: CMS Long-Term Care Facility Characteristics (Data as of Jan 2026)
Active councils help families stay involved in care decisions and facility operations.
These measures show how residents usually do over time at this home, based on health outcomes and preventive care.
Hawaii average: 10.2
Hawaii average: 20.0
Hawaii average: 17.6%
Hawaii average: 25.8%
Hawaii average: 18.3%
Hawaii average: 2.1%
Hawaii average: 3.6%
Hawaii average: 2.4%
Hawaii average: 4.7%
Hawaii average: 1.5%
Hawaii average: 10.1%
Hawaii average: 96.3%
Hawaii average: 95.4%
Hawaii average: 1.34
Hawaii average: 0.89
Hawaii average: 83.4%
Hawaii average: 1.2%
Hawaii average: 84.7%
Hawaii average: 19.6%
Hawaii average: 10.9%
Hawaii average: 0.8%
Hawaii average: 53.7%
Hawaii average: 50.6%
Quality measures are calculated from Minimum Data Set (MDS) assessments. For most measures, lower percentages indicate better care quality.
Federal penalties imposed by CMS for regulatory violations, including civil money penalties (fines) and denials of payment for new Medicare/Medicaid admissions.
Source: CMS Penalties Database (Data as of Jan 2026)
Hawaii average: $38K
Hawaii average: 1.5
Hawaii average: 0.1
Penalties are imposed by CMS for violations of federal nursing home regulations.
Last updated: Jan 2026
Historical financial and operational data for Maunalani Nursing and Rehabilitation Center based on CMS SNF Cost Reports.
Loading trend charts...
Care Cost Calculator: See Prices in Your Area
Nursing Home Data Explorer
Don’t Wait Too Long: 7 Red Flag Signs Your Parent Needs Assisted Living Now
The True Cost of Assisted Living in 2025 – And How Families Are Paying For It
Understanding Senior Living Costs: Pricing Models, Discounts & Financial Assistance

We help families find affordable senior communities and unlock same day discounts, Medicaid, and Medicare options tailored to your needs.
Contact us Today
Touring a community? Use this expert-backed checklist to stay organized, ask the right questions, and find the perfect fit.
We'll send you a PDF version of the touring checklist.


