Liliha Healthcare Center

Nursing Home in Honolulu

CMS overall rating Info The Overall CMS Rating is scored from 1 to 5 stars and combines results from health inspections, staffing levels, and quality measures. Health inspections carry the most weight. Staffing and quality scores can increase or decrease the final rating based on performance compared to state and national standards.

Overview of Liliha Healthcare Center

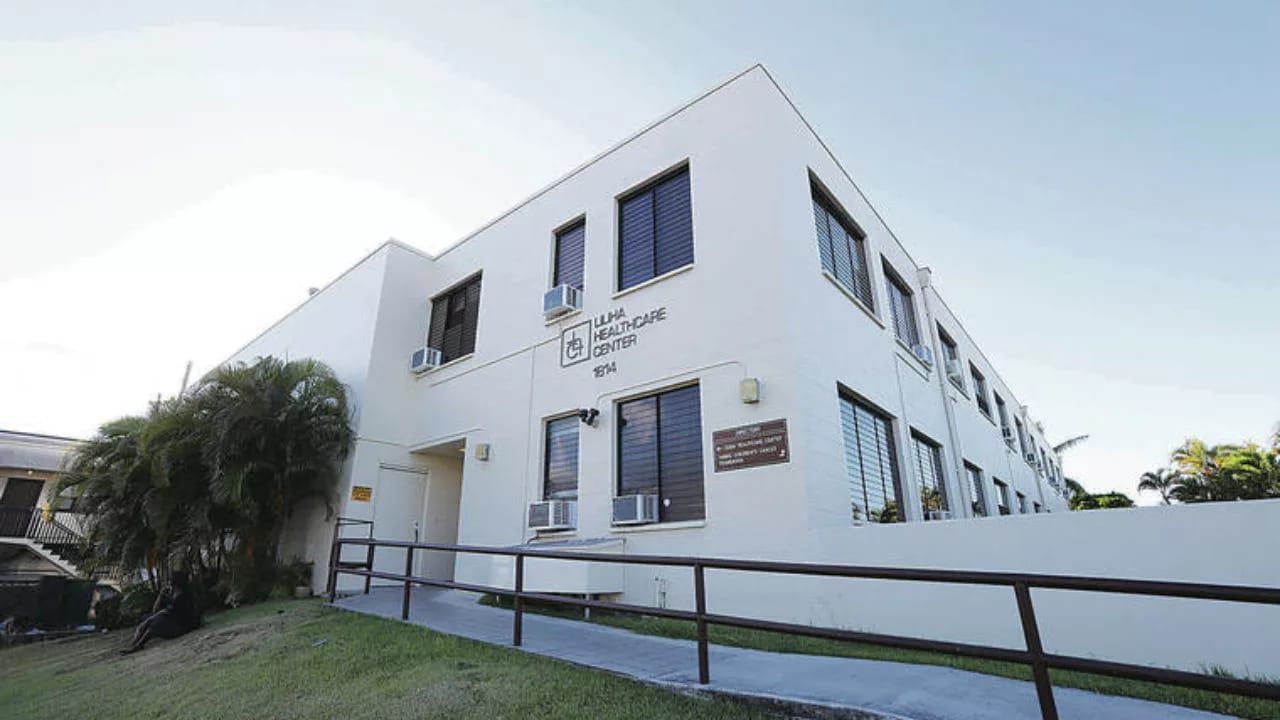
Liliha Healthcare Center is a nursing home in Honolulu, HI, that offers long-term care and rehabilitation. The community’s supportive and welcoming environment creates the ideal setting where older adults can keep their peace of mind in retirement. With 24-hour care, nutritious meals, and therapy services, residents receive the utmost attention and care. Through a holistic approach to care, the community strives to help residents live to their potential.

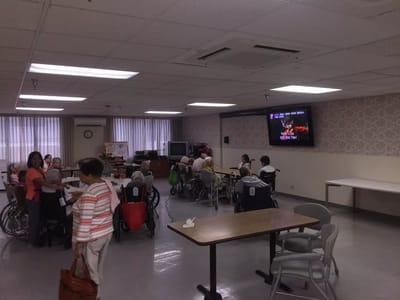
Light exercises and social events ensure residents stay active and have fun. Residents can also rest and move around without worries, as spacious rooms and accessible communal areas are available. Kuakini Medical Center, bus stops, and parks also surround the area, ensuring accessibility and convenience. With its comprehensive services and top-notch amenities, this nursing home is an ideal choice for senior living in Hawaii.

(808) 537-9557

Quality ratings

Measured by Centers for Medicare & Medicaid Services (CMS)

Overall rating Info The Overall CMS Rating combines results from health inspections, staffing levels and quality measures. Health inspections carry the most weight. Staffing and quality scores can increase or decrease the final rating based on performance compared to state and national standards.
1/5 ▼ 2.4 Hawaii average: 3.4/5
Health Inspection Info Based on the results of the facility's three most recent standard inspections and any complaint investigations. CMS reviews the number, scope, and severity of deficiencies, with more recent findings weighted more heavily.
1/5 ▼ 1.9 Hawaii average: 2.9/5
Staffing Info Measures average nursing staff hours per resident per day, including Registered Nurses (RNs) and total nursing staff. Ratings are adjusted based on the level of care residents require and are compared to state and national benchmarks.
3/5 ▼ 1.0 Hawaii average: 4.0/5
Quality Measures Info Based on clinical and physical health indicators reported to CMS, such as hospital readmissions, falls, pressure ulcers, and improvements in mobility. These measures reflect how well residents' health needs are being managed.
4/5 ▼ 0.2 Hawaii average: 4.2/5

Staffing hours breakdown

Info Daily nursing hours per resident by staff type, reported to CMS. Higher is generally better — compare this facility to state and national averages to see where staffing stands.

Hours per resident per day — compared to Hawaii state averages

Total nursing care / resident Info This home is ranked 16th out of 26 homes in Hawaii.

Total adjusted nursing hours per resident per day, combining RN, LPN, and aide time. CMS adjusts this for case-mix so facilities can be fairly compared.
4h 0m per day
Rank #16 / 26Nurse hours — state benchmarkedThis home is ranked 16th out of 26 homes in Hawaii.Shows adjusted nurse hours per resident per day benchmarked to the Hawaii average, with a ranking across 26 Hawaii SNFs. More hours mean more direct care. The national average is about 3.5 hrs; below 3.0 is a red flag.
This facility Hawaii avg (4h 12m per day)
vs Hawaii avg
-5%

5 of 6 metrics below state avg

Standout metric LPN / LVN is +19% above state avg
Staff type Hours / day vs state avg
Registered Nurse (RN) Info RNs hold the highest nursing license and can assess residents, interpret test results, and direct care plans. More RN hours per day often signals stronger clinical oversight and faster response to health changes. 1h 20m per day ▼ 18% State avg: 1h 38m per day · National avg: 41m per day
LPN / LVN Info Licensed Practical Nurses (LPNs) or Licensed Vocational Nurses (LVNs) deliver routine hands-on care — medication administration, wound dressing, and monitoring vital signs. They work under RN supervision and make up a large share of daily bedside care. 25m per day ▲ 19% State avg: 21m per day · National avg: 52m per day
Nurse Aide Info Certified Nurse Aides (CNAs) provide the most direct day-to-day assistance: bathing, dressing, feeding, and mobility. Nurse aide hours are typically the largest staffing category and directly affect residents' quality of life. 2h 27m per day ▼ 10% State avg: 2h 44m per day · National avg: 2h 21m per day
Total Nursing (Weekend) Info Combined nursing hours (RN + LPN + Nurse Aide) per resident per day on weekends. Staffing often drops on weekends — this figure reveals whether the facility maintains adequate coverage outside of weekday hours. 3h 34m per day ▼ 15% State avg: 4h 11m per day · National avg: 3h 26m per day
Physical Therapist Info Hours per resident per day provided by licensed Physical Therapists (PTs) or PT Assistants. PT services help residents recover mobility after injury or illness and are especially important for post-acute (short-stay) rehabilitation. 1m per day ▼ 80% State avg: 5m per day · National avg: 4m per day
RN (Weekend) Info Registered nurse hours specifically on weekends. Facilities sometimes reduce RN presence on Saturdays and Sundays — a low weekend RN figure compared to weekday hours can indicate reduced clinical oversight when most administrative staff are absent. 54m per day ▼ 27% State avg: 1h 14m per day · National avg: 29m per day

Capacity and availability

This home usually has availability

Occupancy lower than 85% suggests more openings may be available.

Higher occupancy than the Hawaii average: 74.2%
Occupancy rate 84.3% Rank #11 / 25Occupancy rate — state benchmarkedThis home is ranked 11th out of 25 homes in Hawaii.Shows this facility's occupancy rate versus the Hawaii average, with its statewide rank out of 25. Higher occupancy signals strong local demand and financial stability.
Avg. Length of Stay 246 days
Occupancy rate
84.3% Rank #11 / 25Occupancy rate — state benchmarkedThis home is ranked 11th out of 25 homes in Hawaii.Shows this facility's occupancy rate versus the Hawaii average, with its statewide rank out of 25. Higher occupancy signals strong local demand and financial stability.
Avg. Length of Stay
246 days

Who this home usually serves

TYPE OF STAY

Mix of rehab and long-term care

This home supports both short-term rehab and long-term care, with residents staying for a wide range of durations.

Breakdown by payment type

Medicare

19% of new residents, usually for short-term rehab.

Typical stay 20 days

Private pay

58% of new residents, often for short stays.

Typical stay 1 - 2 months

Medicaid

23% of new residents, often for long-term daily care.

Typical stay 1 - 2 years

Finances and operations

Privately-owned community
Operated by a business corporation.
Home revenue
$13.8M
Profit
$812.4K
Privately-owned community Operated by a business corporation.
Home revenue
$13.8M Rank #20 / 25Revenue — state benchmarkedThis home is ranked 20th out of 25 homes in Hawaii.Shows this facility's annual revenue compared to the Hawaii SNF average. Higher revenue generally means more resources for staffing and capital — read alongside Payroll %.
Profit
$812.4K
Payroll costs Info The portion of the home's budget spent on staff, including nurses, caregivers, and other employees who support care and operations. Rank #19 / 25Payroll — state benchmarkedThis home is ranked 19th out of 25 homes in Hawaii.Shows total annual staff payroll benchmarked to the Hawaii average. Higher payroll investment relative to peers often signals better staffing and less reliance on cheaper contract labor.
$5.7M
41.4% of revenue Rank #6 / 25Payroll % — state benchmarkedThis home is ranked 6th out of 25 homes in Hawaii.Shows payroll as a percentage of revenue versus the Hawaii average. Well-run SNFs often land around 55–65%. Below 25% may signal understaffing or heavy agency use — read with Staffing ratings.
Other operating costs Info All remaining costs needed to run the home, such as food, utilities, building maintenance, supplies and administrative expenses.
$7.3M
Total costs $13.0M
Walk Score
Walk Score: 81 / 100 Rank #6 / 28Walk Score — state benchmarkedThis home is ranked 6th out of 28 homes in Hawaii.Shows how walkable this facility's neighborhood is compared to the average Walk Score across Hawaii SNFs. Higher scores benefit residents, families, and staff.
Very walkable. Most errands can be accomplished on foot, and many essentials are within a short walk.

Contact Liliha Healthcare Center

Health Inspection History

Inspections
Total health inspections 5

Hawaii average 4.4


Last Health inspection on Jun 2025

Total health citations
52 Rank #23 / 27Health citations — state benchmarkedThis home is ranked 23rd out of 27 homes in Hawaii.Shows this facility's total health deficiency citations benchmarked to the Hawaii state average, with a ranking across all 27 HI SNFs. Lower citation counts earn a better rank.

Hawaii average 35.5

Citations per inspection
10.4

Hawaii average 8.23


Health citations are formal notices following inspections when they fail to comply with safety and care standards.

34 of 52 citations resulted from standard inspections; 9 of 52 resulted from complaint investigations; and 9 of 52 came from combined inspections (standard and complaint).

Breakdown of citation severity (last 3 years)
Critical Health citations More info
0 Rank #11 / 16Severe citations — state benchmarkedThis home is ranked 11th out of 16 homes in Hawaii.Shows citations where actual resident harm occurred, compared to the Hawaii average and ranked across 16 SNFs statewide. Even a single severe citation is significant — lower is always better.
100% better than Hawaii average

Hawaii average: 0.1


Serious Health citations More info 3
200% worse than Hawaii average

Hawaii average: 1

0 critical citations More info Hawaii average: 0.1

3 serious citations More info Hawaii average: 1

49 moderate citations More info Hawaii average: 34.2

0 minor citations More info Hawaii average: 0.1
Citations history (last 3 years)
Abuse/Neglect moderate citation Info Issues related to protecting resident's from harm, including abuse, neglect, or mistreatment. Jun 09, 2025
Corrected

Quality of Care moderate citation Info Issues related to how well residents receive appropriate treatment and support for their medical and daily care needs. Jun 09, 2025
Corrected

Quality of Care moderate citation Info Issues related to how well residents receive appropriate treatment and support for their medical and daily care needs. Jun 09, 2025
Corrected

Care Planning moderate citation Info Issues related to creating and updating personalized care plans for residents based on their needs and conditions. Jun 09, 2025
Corrected

Compare Nursing Homes around Honolulu The information below is reported by the Hawaii Department of Health, Office of Health Care Assurance.

5 facilities compared · CMS & HI Dept. of Health data · Updated Apr 2026

Filter by care type
Maunalani Nursing and Rehabilitation Center
NH

Nursing Home Licensed facility providing 24/7 skilled nursing care for residents with complex, ongoing medical needs. Staffed by RNs, LPNs, and CNAs. Inspected and star-rated annually by CMS. Accepts Medicare (short-term rehab) and Medicaid (long-term care).

AL

Assisted Living A licensed, long-term care setting for seniors or individuals with disabilities who need help with daily activities — like bathing, dressing, and medication management — but not 24-hour skilled nursing. Offers housing, meals, and around-the-clock support while aiming to maximize resident independence.

Honolulu (Kaimuki) 100 87.7% +18% 4.19 -23% 0% 2 21 4.2 2 92 - 11 The Maunalani Foundation $20.3M $8.7M 42.7% 125013
Islands Skilled Nursing and Rehab
NH

Nursing Home Licensed facility providing 24/7 skilled nursing care for residents with complex, ongoing medical needs. Staffed by RNs, LPNs, and CNAs. Inspected and star-rated annually by CMS. Accepts Medicare (short-term rehab) and Medicaid (long-term care).

AL

Assisted Living A licensed, long-term care setting for seniors or individuals with disabilities who need help with daily activities — like bathing, dressing, and medication management — but not 24-hour skilled nursing. Offers housing, meals, and around-the-clock support while aiming to maximize resident independence.

Honolulu (Mccully - Moiliili) 42 83.7% +13% 3.16 +20% -25% 1 64 12.8 1 31 - 96 Pacific Healthcare Ventures Llc $13.6M $6.7M 49.1% 125067
Liliha Healthcare Center
NH

Nursing Home Licensed facility providing 24/7 skilled nursing care for residents with complex, ongoing medical needs. Staffed by RNs, LPNs, and CNAs. Inspected and star-rated annually by CMS. Accepts Medicare (short-term rehab) and Medicaid (long-term care).

AL

Assisted Living A licensed, long-term care setting for seniors or individuals with disabilities who need help with daily activities — like bathing, dressing, and medication management — but not 24-hour skilled nursing. Offers housing, meals, and around-the-clock support while aiming to maximize resident independence.

Honolulu (Liliha - Kapalama) 92 84.3% +14% 4.00 -23% -5% 1 52 10.4 3 82 - 81 - $13.8M $5.7M 41.4% 125041
The Care Center of Honolulu
NH

Nursing Home Licensed facility providing 24/7 skilled nursing care for residents with complex, ongoing medical needs. Staffed by RNs, LPNs, and CNAs. Inspected and star-rated annually by CMS. Accepts Medicare (short-term rehab) and Medicaid (long-term care).

AL

Assisted Living A licensed, long-term care setting for seniors or individuals with disabilities who need help with daily activities — like bathing, dressing, and medication management — but not 24-hour skilled nursing. Offers housing, meals, and around-the-clock support while aiming to maximize resident independence.

Honolulu (Liliha - Kapalama) 254 66.6% -10% 3.31 0% -21% 1 47 9.4 1 171 A+ 71 Darley, Suzanne $40.4M $14.0M 34.7% 125019
Hale Ho Aloha -
NH

Nursing Home Licensed facility providing 24/7 skilled nursing care for residents with complex, ongoing medical needs. Staffed by RNs, LPNs, and CNAs. Inspected and star-rated annually by CMS. Accepts Medicare (short-term rehab) and Medicaid (long-term care).

AL

Assisted Living A licensed, long-term care setting for seniors or individuals with disabilities who need help with daily activities — like bathing, dressing, and medication management — but not 24-hour skilled nursing. Offers housing, meals, and around-the-clock support while aiming to maximize resident independence.

Honolulu (Nuuanu - Punchbowl) - - - - - - - - - 0 0 0.0 0 - A+ 3 - - - - -

Financial Assistance for
Nursing Home in Hawaii

Get Financial aid guidance

QUEST Integration

Hawaii Medicaid QUEST Integration

Age 65+ or disabled
General Hawaii resident, Medicaid-eligible, long-term care need.
Income Limits (2025) ~$2,829/month 300% FBR, individual
Asset Limits $2,000 (individual), $3,000 (couple).
HI

High cost of living adjustments.

Benefits
In-home care (6-8 hours/day) Nursing home Respite (240 hours/year) Medical services

Kupuna Care

Hawaii Kupuna Care

Age 60+
General Hawaii resident, unable to perform 2+ ADLs.
Income Limits No strict limit; prioritizes low-income.
Asset Limits Not applicable.
HI

Limited funding; island-specific delivery.

Benefits
In-home care (3-5 hours/week) Adult day care (~$70/day) Transportation (~5 trips/month)

Program of All-Inclusive Care for the Elderly (PACE)

Hawaii Medicaid PACE

Age 55+
General Hawaii resident, nursing home-level care need, safe with PACE support.
Income Limits (2025) ~$2,829/month 300% FBR
Asset Limits $2,000 (individual), $3,000 (couple).
HI

Limited to Oahu (e.g., Maluhia in Honolulu); few providers.

Benefits
Personal care (5-7 hours/day) Medical care Meals Transportation Therapy Respite

Medicare Savings Program (MSP)

Hawaii Medicare Savings Program

Age 65+ or disabled
General Hawaii resident, Medicare Part A/B.
Income Limits (2025) ~$2,510/month (QMB), ~$3,380/month (SLMB), ~$3,598/month (QI)—individual, adjusted annually.
Asset Limits $9,430 (individual), $14,130 (couple).
HI

Three tiers; no waitlist.

Benefits
Covers Part B premiums ($174.70/month) Deductibles ($240/year) Copays (~20%)

Senior Community Service Employment Program (SCSEP)

Hawaii SCSEP (Federally Funded, State-Administered)

Age 55+
General unemployed, low-income, Hawaii resident.
Income Limits (2025) ~$1,983/month 125% FPL
Asset Limits Not specified; income-focused.
HI

~800 slots; prioritizes veterans, rural residents.

Benefits
Paid training (~20 hours/week at ~$7.25/hour) Job placement

National Family Caregiver Support Program (NFCSP) Respite

Hawaii NFCSP Respite Care

Age
General Caregivers of 60+ needing care or 55+ caregivers of others; Hawaii resident; functional needs (2+ ADLs).
Income Limits (2025) Prioritizes ~$24,980/year (individual); no strict cap.
Asset Limits Not assessed; need-based.
HI

Four county AAAs; prioritizes low-income.

Benefits
Respite (4-6 hours/week or 5 days/year) Adult day care ($80/day) Counseling

VA Aid and Attendance (A&A) and Housebound Benefits

Hawaii VA Aid and Attendance/Housebound

Age 65+ or disabled veteran/surviving spouse
General Hawaii resident, wartime service, need for aid with ADLs (A&A) or homebound status.
Income Limits (2025) Net income < ~$1,984/month (veteran with dependent, A&A); pension offsets income.
Asset Limits ~$155,356 2025 net worth limit
HI

Applies statewide; high demand due to veteran population.

Benefits
Cash (~$1,433-$2,642/month veteran, ~$951-$1,318 spouse) for care costs (e.g., in-home, assisted living)

Senior Companion Program (SCP)

Hawaii Senior Companion Program

Age
General Volunteers: 55+, low-income, Hawaii resident, able to work 20 hours/week. Recipients: Frail elders needing companionship.
Income Limits (2025) Volunteers: ~$24,980/year (200% FPL); recipients: no limit.
Asset Limits Not specified for volunteers; need-based for recipients.
HI

Statewide; managed by DHS Social Services.

Benefits
Volunteers paid ~$4/hour for companionship (~20 hours/week); recipients get free support (~4-6 hours/week)

Places of interest near Liliha Healthcare Center

Address 1.0 miles from city center Info Estimated distance in miles from Honolulu's city center to Liliha Healthcare Center's address, calculated via Google Maps. — 0.13 miles to nearest hospital (Kuakini Medical Center)

Calculate Travel Distance to Liliha Healthcare Center

Add your location

Address

Staffing Data (Q2 2025)

This data corresponds to Q2 2025 and is based on CMS Payroll-Based Journal.

Total staff 120
Employees 65
Contractors 55
Staff to resident ratio 1.43:1
13% worse than Hawaii average

Hawaii average ratio: 1.64:1

Avg staff/day 48
Average shift 7.6 hours
0% compared with Hawaii average

Hawaii average: 7.8 hours

Total staff hours (quarter) 33,188
Nursing staff breakdown
Registered Nurse

Manages medical care and health needs.

Total count 19
Average shift length Info Average shift length. Calculated as total hours divided by days worked and average staff per day. 8.9 hours

This role is partially covered by contractors.

Licensed Practical Nurse

Assists with medical care and medications.

Total count 7
Average shift length Info Average shift length. Calculated as total hours divided by days worked and average staff per day. 7.7 hours

No contractors work on this role.

Certified Nursing Assistant

Helps with daily care and mobility.

Total count 42
Average shift length Info Average shift length. Calculated as total hours divided by days worked and average staff per day. 8.1 hours

This role is partially covered by contractors.

Contractor staffing

Total hours from contractors

12.5%

4,140 contractor hours this quarter

Physical Therapy Aide: 9 Certified Nursing Assistant: 9 Registered Nurse: 7 Speech Language Pathologist: 7 Respiratory Therapy Technician: 7 Physical Therapy Assistant: 5 Qualified Social Worker: 4 Occupational Therapy Assistant: 3 Diagnostic X-ray Services Staff: 2 Other Physician: 1 Medical Director: 1
Staff by category
Certified Nursing Assistant 33 9 42 17,190 91 100% 8.1
Registered Nurse 12 7 19 6,746 91 100% 8.9
Licensed Practical Nurse 7 0 7 2,618 91 100% 7.7
Clinical Nurse Specialist 5 0 5 1,986 84 92% 6.6
Other Dietary Services Staff 4 0 4 1,643 85 93% 8.1
Speech Language Pathologist 0 7 7 783 67 74% 5.9
Administrator 1 0 1 512 64 70% 8
RN Director of Nursing 1 0 1 470 61 67% 7.7
Occupational Therapy Aide 1 0 1 348 47 52% 7.4
Physical Therapy Aide 0 9 9 335 62 68% 4.9
Respiratory Therapy Technician 0 7 7 189 67 74% 2.1
Physical Therapy Assistant 0 5 5 162 52 57% 2.8
Occupational Therapy Assistant 0 3 3 58 28 31% 1.6
Qualified Social Worker 0 4 4 52 29 32% 1.8
Dental Services Staff 1 0 1 48 6 7% 8
Other Physician 0 1 1 24 24 26% 1
Diagnostic X-ray Services Staff 0 2 2 18 6 7% 3
Medical Director 0 1 1 7 7 8% 1
42 Certified Nursing Assistant
% of Days 100%
19 Registered Nurse
% of Days 100%
7 Licensed Practical Nurse
% of Days 100%
5 Clinical Nurse Specialist
% of Days 92%
4 Other Dietary Services Staff
% of Days 93%
7 Speech Language Pathologist
% of Days 74%
1 Administrator
% of Days 70%
1 RN Director of Nursing
% of Days 67%
1 Occupational Therapy Aide
% of Days 52%
9 Physical Therapy Aide
% of Days 68%
7 Respiratory Therapy Technician
% of Days 74%
5 Physical Therapy Assistant
% of Days 57%
3 Occupational Therapy Assistant
% of Days 31%
4 Qualified Social Worker
% of Days 32%
1 Dental Services Staff
% of Days 7%
1 Other Physician
% of Days 26%
2 Diagnostic X-ray Services Staff
% of Days 7%
1 Medical Director
% of Days 8%

Facility Characteristics

Source: CMS Long-Term Care Facility Characteristics (Data as of Jan 2026)

Total residents 84
Medicare
11
13.1% of residents
Medicaid
62
73.8% of residents
Private pay or other
11
13.1% of residents
Programs & Services
Residents Group

Residents meet regularly to discuss policies, care quality, and activities

Family Member Group

Family members meet regularly to discuss policies, care quality, and activities

Nurse Aide Training

State-approved Nurse Aide Training and Competency Evaluation Program on-site

Active Family Council

Organized group of family members that meets regularly to discuss facility policies, resident care, and activities.

Active Resident Council

Organized group of residents that meets regularly to discuss facility policies, quality of life, and activities.

Quality of care over time

These measures show how residents usually do over time at this home, based on health outcomes and preventive care.

High-risk clinical events score Info A composite score based on pressure ulcers, falls with injury, weight loss, walking ability decline, and activities of daily living decline. 12.1
19% worse than Hawaii average

Hawaii average: 10.2

Functional decline score Info A composite score based on activities of daily living decline, walking ability decline, and incontinence. 21.8
9% worse than Hawaii average

Hawaii average: 20.0

Long-stay resident measures
Above average Hawaii avg: 4.4 Info CMS star rating based on long-stay quality measure performance. 5 stars = significantly above average, 1 star = significantly below average.
Need for Help with Daily Activities Increased Info Percent of long-stay residents whose need for help with daily activities has increased 24.0%
36% worse than Hawaii average

Hawaii average: 17.6%

Walking Ability Worsened Info Percent of long-stay residents whose ability to move independently worsened 24.3%
6% better than Hawaii average

Hawaii average: 25.8%

Low Risk Residents with Bowel/Bladder Incontinence Info Percent of low risk long-stay residents who lose control of their bowels or bladder 17.1%
7% better than Hawaii average

Hawaii average: 18.3%

Falls with Major Injury Info Percent of long-stay residents experiencing one or more falls with major injury 4.1%
93% worse than Hawaii average

Hawaii average: 2.1%

High Risk Residents with Pressure Ulcers Info Percent of long-stay high risk residents with pressure ulcers 5.0%
36% worse than Hawaii average

Hawaii average: 3.6%

Urinary Tract Infection Info Percent of long-stay residents with a urinary tract infection 2.4%
In line with Hawaii average

Hawaii average: 2.4%

Lost Too Much Weight Info Percent of long-stay residents who lose too much weight 3.4%
28% better than Hawaii average

Hawaii average: 4.7%

Depressive Symptoms Info Percent of long-stay residents who have depressive symptoms 0.0%
100% better than Hawaii average

Hawaii average: 1.5%

Antipsychotic Use Info Percent of long-stay residents who received an antipsychotic medication 16.2%
61% worse than Hawaii average

Hawaii average: 10.1%

Pneumococcal Vaccine Info Percent of long-stay residents assessed and appropriately given the pneumococcal vaccine 100.0%
In line with Hawaii average

Hawaii average: 96.3%

Influenza Vaccine Info Percent of long-stay residents assessed and appropriately given the seasonal influenza vaccine 100.0%
5% better than Hawaii average

Hawaii average: 95.4%

Short-stay resident measures
Significantly above average Hawaii avg: 3.0 Info CMS star rating based on short-stay quality measure performance. 5 stars = much above average, 1 star = much below average.
Pneumococcal Vaccine Info Percent of short-stay residents assessed and appropriately given the pneumococcal vaccine 91.3%
10% better than Hawaii average

Hawaii average: 83.4%

Antipsychotic medication increase Info Percent of short-stay residents who newly received an antipsychotic medication 0.4%
67% better than Hawaii average

Hawaii average: 1.2%

Influenza Vaccine Info Percent of short-stay residents assessed and appropriately given the seasonal influenza vaccine 94.9%
12% better than Hawaii average

Hawaii average: 84.7%

Re-hospitalized after SNF stay Info Percentage of short-stay residents who were re-hospitalized after their nursing home admission. 22.4%
14% worse than Hawaii average

Hawaii average: 19.6%

Emergency department visits Info Percentage of short-stay residents who had an outpatient emergency department visit. 4.9%
55% better than Hawaii average

Hawaii average: 10.9%

Falls with major injury Info Percentage of SNF residents who experience falls with major injury during their stay. 0.0%
100% better than Hawaii average

Hawaii average: 0.8%

Ability to care for self at discharge Info Percentage of residents at or above expected ability to care for themselves at discharge. 27.8%
48% worse than Hawaii average

Hawaii average: 53.7%

Successful return to home or community Info Rate of successful return to home or community from a skilled nursing facility. 60.8%
20% better than Hawaii average

Hawaii average: 50.6%

Penalties and fines

Federal penalties imposed by CMS for regulatory violations, including civil money penalties (fines) and denials of payment for new Medicare/Medicaid admissions.

Source: CMS Penalties Database (Data as of Jan 2026)

Total fines amount $11K
70% lower than Hawaii average

Hawaii average: $38K

Number of fines 1 Rank #1 / 15Federal fines — state benchmarkedThis home is ranked 1st out of 15 homes in Hawaii.Shows this facility's CMS fine count alongside the Hawaii average, and where it ranks among all 15 skilled nursing facilities in the state. Fewer fines mean a better rank.
34% fewer fines than Hawaii average

Hawaii average: 1.5

Payment Denials Info Serious action where Medicare and/or Medicaid temporarily stops payments for new residents until issues are fixed. 0
100% fewer payment denials than Hawaii average

Hawaii average: 0.1

Fines amount comparison
This facility $11K
Hawaii average $38K
Penalty History

Penalties are imposed by CMS for violations of federal nursing home regulations.

Civil Money Penalty Info Fines imposed for noncompliance, which can be assessed per day or per instance of violation. Jun 30, 2023
$11K

Last updated: Jan 2026

Guides for Better Senior Living

Care Cost Calculator: See Prices in Your Area

Nursing Home Data Explorer

Don’t Wait Too Long: 7 Red Flag Signs Your Parent Needs Assisted Living Now

The True Cost of Assisted Living in 2025 – And How Families Are Paying For It

Understanding Senior Living Costs: Pricing Models, Discounts & Financial Assistance

Tour Icon
Planning a tour? Check our touring checklist.
Chat Icon
Thinking of living here? We can help you speak to a current resident
Explore Open Rooms
1 Contact details
2 What type of senior care service are you looking for?
3 What budget do you have in mind for senior care?
4 How soon do you need to find care?
5 Additional details

Thank you for your interest!

Our team will be in touch shortly to help with next steps.