


Total health inspections
5
Hawaii average 4.4
Last Health inspection on Aug 2024
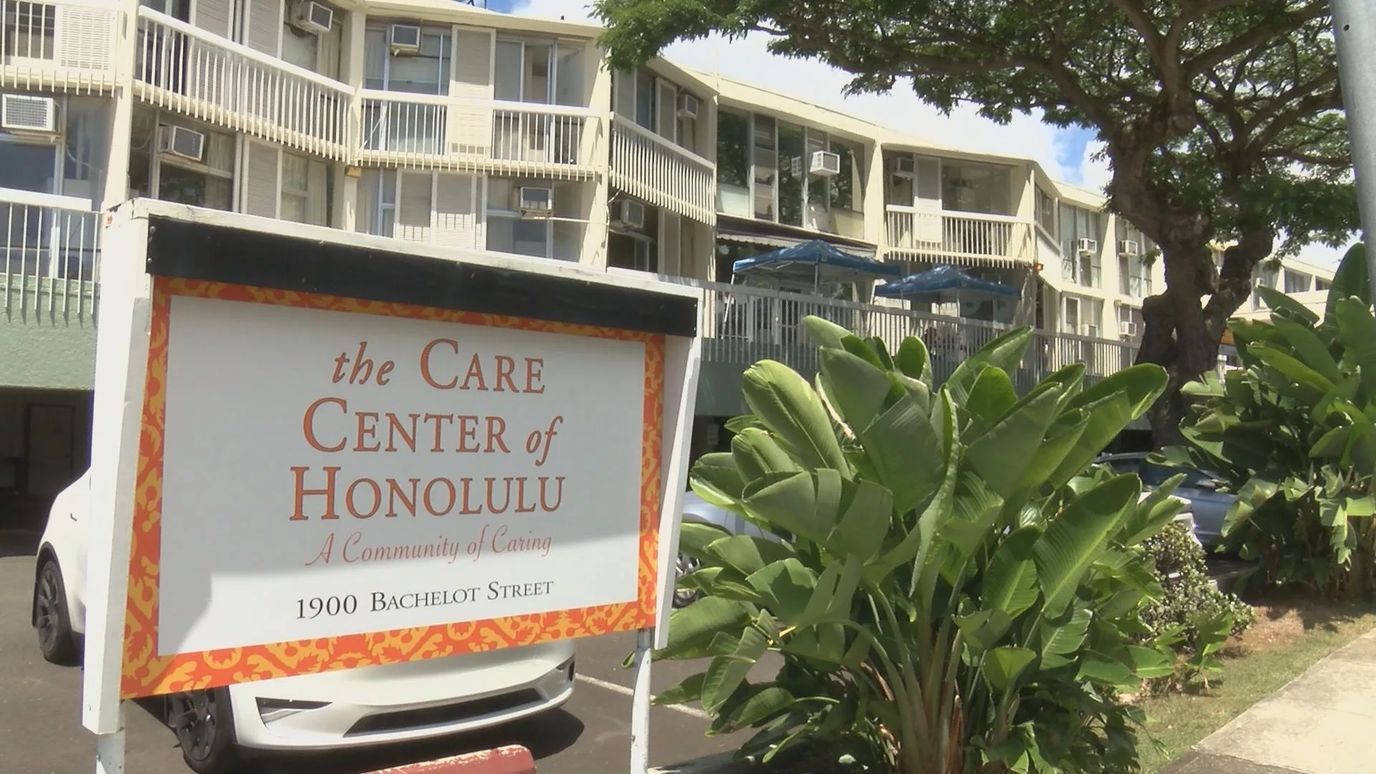
The Care Center of Honolulu offers respiratory care, skilled nursing, and rehabilitation care; its atmosphere provides graceful living for short-term or long-term residents. The dedicated team of care staff assures residents of all kinds of living options that they receive supportive assistance for everyday living with enriching activities that contribute to a high success rate for recovery. The Care Center boasts its compassionate approach to an enhanced quality of life for all seniors.
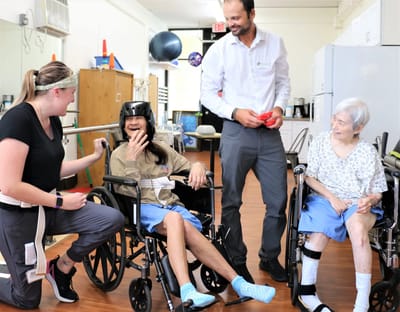
The Care Center offers a range of long-term and short-term rehabilitative services such as wound care, diagnostic radiology, dialysis, therapy (occupational, physical, speech), ventilator service– all being provided with 24-hour nursing.
| Staff type | Hours / Day / Resident | vs state avg |
|---|---|---|
|
Registered Nurse (RN)
| 1h 34m per day | ▼ 4% State avg: 1h 38m per day · National avg: 41m per day |
|
LPN / LVN
| 21m per day | ■ Avg State avg: 21m per day · National avg: 52m per day |
|
Nurse Aide
| 2h 45m per day | ■ Avg State avg: 2h 44m per day · National avg: 2h 21m per day |
|
Weekend Total Nursing
| 4h 3m per day | ▼ 3% State avg: 4h 11m per day · National avg: 3h 26m per day |
|
Physical Therapist
| 4m per day | ▼ 29% State avg: 5m per day · National avg: 4m per day |
|
Weekend RN
| 1h 12m per day | ▼ 3% State avg: 1h 14m per day · National avg: 29m per day |
Key information about the people who lead and staff this community.
In Hawaii, the Department of Health, Office of Health Care Assurance performs regular inspections and unannounced surveys to verify that healthcare facilities maintain high standards of resident care.
Deficiencies
| This Facility | HI Average | vs. HI Avg |
|---|---|---|---|
|
Total deficiencies
| 52 | 25 | This facility has 108% more total deficiencies than a typical Hawaii nursing home (52 vs. HI avg 25).↑ 108% worse |
Hawaii average 4.4
Last Health inspection on Aug 2024
Hawaii average 35.5
Hawaii average 8.23
Health citations are formal notices following inspections when they fail to comply with safety and care standards.
36 of 47 citations resulted from standard inspections; 4 of 47 resulted from complaint investigations; and 7 of 47 came from combined inspections (standard and complaint).
Hawaii average: 0.1
Hawaii average: 1
Reporting period: October 1 – December 31, 2025 (Q4 2025). Source: CMS Payroll-Based Journal report.
Manages medical care and health needs.
Assists with medical care and medications.
Helps with daily care and mobility.
Total hours from contractors
6,855 contractor hours this quarter
| Certified Nursing Assistant | 106 | 9 | 115 | 41,321 | 92 | 100% | 8 |
| Registered Nurse | 47 | 0 | 47 | 19,479 | 92 | 100% | 8.5 |
| Qualified Activities Professional | 19 | 2 | 21 | 6,829 | 92 | 100% | 9.3 |
| Licensed Practical Nurse | 13 | 0 | 13 | 4,568 | 92 | 100% | 8.7 |
| Clinical Nurse Specialist | 15 | 0 | 15 | 4,538 | 92 | 100% | 7.5 |
| Other Dietary Services Staff | 10 | 0 | 10 | 3,531 | 92 | 100% | 7.9 |
| Nurse Aide in Training | 5 | 0 | 5 | 1,519 | 89 | 97% | 8.1 |
| Dental Services Staff | 5 | 0 | 5 | 1,314 | 75 | 82% | 7.7 |
| Speech Language Pathologist | 0 | 6 | 6 | 1,208 | 77 | 84% | 7.4 |
| Physical Therapy Aide | 0 | 3 | 3 | 1,048 | 75 | 82% | 7.4 |
| Physical Therapy Assistant | 0 | 3 | 3 | 936 | 87 | 95% | 8.5 |
| Respiratory Therapy Technician | 0 | 3 | 3 | 923 | 64 | 70% | 8 |
| RN Director of Nursing | 2 | 0 | 2 | 856 | 65 | 71% | 8 |
| Occupational Therapy Aide | 3 | 0 | 3 | 680 | 63 | 68% | 7.7 |
| Qualified Social Worker | 0 | 4 | 4 | 523 | 57 | 62% | 7.6 |
| Administrator | 1 | 0 | 1 | 496 | 63 | 68% | 7.9 |
| Nurse Practitioner | 1 | 0 | 1 | 496 | 62 | 67% | 8 |
| Mental Health Service Worker | 1 | 0 | 1 | 491 | 60 | 65% | 8.2 |
| Occupational Therapy Assistant | 0 | 1 | 1 | 80 | 11 | 12% | 7.3 |
| Medical Director | 0 | 2 | 2 | 22 | 32 | 35% | 0.7 |
| Other Physician | 0 | 1 | 1 | 2 | 1 | 1% | 2 |
Includes penalties issued in 2024
Federal penalties imposed by CMS for regulatory violations, including civil money penalties (fines) and denials of payment for new Medicare/Medicaid admissions.
Source: CMS Penalties Database (Data as of Jan 2026)
Hawaii average: $38K
Hawaii average: 1.5
Hawaii average: 0.1
Penalties are imposed by CMS for violations of federal nursing home regulations.
1 penalty in the past 3 years
Aug 15, 2024 · $8K
Last updated: Jan 2026
These measures show how residents usually do over time at this home, based on health outcomes and preventive care.
Hawaii average: 10.2
Hawaii average: 20.0
Hawaii average: 17.6%
Hawaii average: 25.8%
Hawaii average: 18.3%
Hawaii average: 2.1%
Hawaii average: 3.6%
Hawaii average: 2.4%
Hawaii average: 4.7%
Hawaii average: 1.5%
Hawaii average: 10.1%
Hawaii average: 96.3%
Hawaii average: 95.4%
Hawaii average: 1.34
Hawaii average: 0.89
Hawaii average: 83.4%
Hawaii average: 1.2%
Hawaii average: 84.7%
Hawaii average: 19.6%
Hawaii average: 10.9%
Hawaii average: 0.8%
Hawaii average: 53.7%
Hawaii average: 50.6%
Quality measures are calculated from Minimum Data Set (MDS) assessments. For most measures, lower percentages indicate better care quality.
23% of new residents, usually for short-term rehab.
56% of new residents, often for short stays.
21% of new residents, often for long-term daily care.
Source: CMS Long-Term Care Facility Characteristics (Data as of Jan 2026)
Residents meet regularly to discuss policies, care quality, and activities
Organized group of residents that meets regularly to discuss facility policies, quality of life, and activities.
Data sourced from CMS Long-Term Care Facility Characteristics quarterly report. Payer mix reflects the current resident census by primary payment source.
Historical financial and operational data for The Care Center of Honolulu from 2012–2024, based on CMS SNF Cost Reports.
Key figures below are for fiscal year ending in 02/2024.
Based on CMS SNF Cost Report for fiscal year ending in 02/2024.
This home supports both short-term rehab and long-term care, with residents staying for a wide range of durations.
Most new residents arrive under private pay (56% of admissions), and a typical private pay stay runs around 1 - 2 months.
Coverage residents most often arrive under.
Coverage residents most often leave under.
![]() 0.9 miles from city center
0.9 miles from city center
![]() Estimated distance in miles from Honolulu's city center to The Care Center of Honolulu's address, calculated via Google Maps.
— 0.1 miles to nearest hospital (Kuakini Medical Center)
Estimated distance in miles from Honolulu's city center to The Care Center of Honolulu's address, calculated via Google Maps.
— 0.1 miles to nearest hospital (Kuakini Medical Center)
Add your location
The information below is reported by the Hawaii Department of Health, Office of Health Care Assurance.
| Maunalani Nursing and Rehabilitation Center | NH PC SNF | Honolulu (Kaimuki) | 100
Facility
100
HI AVG
43
Rank
#13 / 84 |
90.0%
Facility
90.0%
HI AVG
84.1
Rank
#7 / 23 | +7% | 4.19
Facility
4.19
HI AVG
4.20
Rank
#14 / 30 | -71% | 0% | $32.1k
Facility
$32.1k
HI AVG
$43.4k
Rank
#25 / 31 | 21
Facility
21
HI AVG
35.5
Rank
#3 / 31 | 4.2
Facility
4.2
HI AVG
8.2
Rank
#3 / 31 | 2 | 90 | - |
11
Facility
11
HI AVG
49
Rank
#152 / 177 | The Maunalani Foundation | $18.6MFiscal year ending 06/2024
Facility
$18.6MFiscal year ending 06/2024
HI AVG
$20.8M
Rank
#10 / 27 | $10.4MFiscal year ending 06/2024
Facility
$10.4MFiscal year ending 06/2024
HI AVG
$7.1M
Rank
#7 / 27 | 56%Fiscal year ending 06/2024
Facility
56%Fiscal year ending 06/2024
HI AVG
38.9%
Rank
#7 / 27 | 125013 | ||||
| Arcadia Retirement Residence | NH ADC HC IL SNF | Honolulu (Makiki/Lower/ Punchbowl/Tantalus) | 91
Facility
91
HI AVG
43
Rank
#18 / 84 |
93.7%
Facility
93.7%
HI AVG
84.1
Rank
#2 / 23 | +11% | 5.08
Facility
5.08
HI AVG
4.20
Rank
#5 / 30 | +26% | +21% | $12.9k
Facility
$12.9k
HI AVG
$43.4k
Rank
#21 / 31 | 36
Facility
36
HI AVG
35.5
Rank
#17 / 31 | 9.0
Facility
9.0
HI AVG
8.2
Rank
#24 / 31 | 2 | 85 | A+ |
86
Facility
86
HI AVG
49
Rank
#27 / 177 | Kathleen Yokouchi | $14.6MFiscal year ending 12/2023
Facility
$14.6MFiscal year ending 12/2023
HI AVG
$20.8M
Rank
#13 / 27 | $7.5MFiscal year ending 12/2023
Facility
$7.5MFiscal year ending 12/2023
HI AVG
$7.1M
Rank
#10 / 27 | 51.1%Fiscal year ending 12/2023
Facility
51.1%Fiscal year ending 12/2023
HI AVG
38.9%
Rank
#13 / 27 | 125014 | ||||
| 15 Craigside | NH ADC AL HC IL SNF | Honolulu (Nuuanu - Punchbowl) | 45
Facility
45
HI AVG
43
Rank
#25 / 84 |
98.9%
Facility
98.9%
HI AVG
84.1
Rank
#1 / 23 | +18% | 5.04
Facility
5.04
HI AVG
4.20
Rank
#6 / 30 | +1% | +20% | $0
Facility
$0
HI AVG
$43.4k
Rank
#1 / 31 | 5
Facility
5
HI AVG
35.5
Rank
#1 / 31 | 2.5
Facility
2.5
HI AVG
8.2
Rank
#1 / 31 | - | 45 | A+ |
50
Facility
50
HI AVG
49
Rank
#85 / 177 | Bree Komagome | $7.7MFiscal year ending 12/2023
Facility
$7.7MFiscal year ending 12/2023
HI AVG
$20.8M
Rank
#25 / 27 | $5.2MFiscal year ending 12/2023
Facility
$5.2MFiscal year ending 12/2023
HI AVG
$7.1M
Rank
#22 / 27 | 67.8%Fiscal year ending 12/2023
Facility
67.8%Fiscal year ending 12/2023
HI AVG
38.9%
Rank
#1 / 27 | 125063 | ||||
| Kalākaua Gardens | NH AL IL MC RC SNF | Honolulu (Ala Moana) | 49
Facility
49
HI AVG
43
Rank
#23 / 84 |
84.7%
Facility
84.7%
HI AVG
84.1
Rank
#14 / 23 | +1% | 0.37
Facility
0.37
HI AVG
4.20
Rank
#30 / 30 | -3% | -91% | $55.7k
Facility
$55.7k
HI AVG
$43.4k
Rank
#27 / 31 | 35
Facility
35
HI AVG
35.5
Rank
#16 / 31 | 5.8
Facility
5.8
HI AVG
8.2
Rank
#8 / 31 | 3 | 42 | - |
98
Facility
98
HI AVG
49
Rank
#3 / 177 | 1723 Kalakaua LLC | $21.3MFiscal year ending 12/2023
Facility
$21.3MFiscal year ending 12/2023
HI AVG
$20.8M
Rank
#9 / 27 | $9.5MFiscal year ending 12/2023
Facility
$9.5MFiscal year ending 12/2023
HI AVG
$7.1M
Rank
#8 / 27 | 44.8%Fiscal year ending 12/2023
Facility
44.8%Fiscal year ending 12/2023
HI AVG
38.9%
Rank
#18 / 27 | 125066 | ||||
| The Care Center of Honolulu | NH SNF | Honolulu (Liliha - Kapalama) | 182
Facility
182
HI AVG
43
Rank
#3 / 84 |
93.1%
Facility
93.1%
HI AVG
84.1
Rank
#4 / 23 | +11% | 3.31
Facility
3.31
HI AVG
4.20
Rank
#27 / 30 | -13% | -21% | $8.0k
Facility
$8.0k
HI AVG
$43.4k
Rank
#18 / 31 | 47
Facility
47
HI AVG
35.5
Rank
#26 / 31 | 9.4
Facility
9.4
HI AVG
8.2
Rank
#25 / 31 | 1 | 170 | A+ |
71
Facility
71
HI AVG
49
Rank
#46 / 177 | Suzanne Darley | $38.4MFiscal year ending 02/2024
Facility
$38.4MFiscal year ending 02/2024
HI AVG
$20.8M
Rank
#5 / 27 | $18.2MFiscal year ending 02/2024
Facility
$18.2MFiscal year ending 02/2024
HI AVG
$7.1M
Rank
#2 / 27 | 47.6%Fiscal year ending 02/2024
Facility
47.6%Fiscal year ending 02/2024
HI AVG
38.9%
Rank
#17 / 27 | 125019 |
The Care Center of Honolulu is located in Honolulu, Hawaii.
Here are the financial assistance programs available to residents in Hawaii.
The Care Center of Honolulu is in the Liliha - Kapalama neighborhood of Honolulu.
The Care Center of Honolulu has a walk score of 71. Very walkable. Most errands can be accomplished on foot, and many essentials are within a short walk.
The Care Center of Honolulu's occupancy is 66.6%.
No, The Care Center of Honolulu has a no-pet policy.
The Care Center of Honolulu is registered as a for-profit in HI.
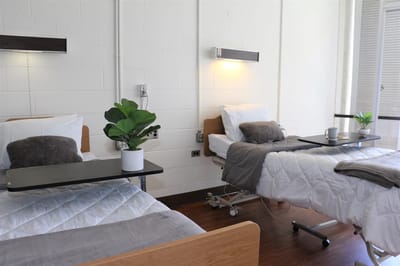
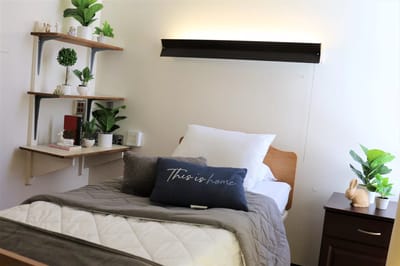
Yes — there are 5 photos of The Care Center of Honolulu in the photo gallery on this page.
The Care Center of Honolulu is located at 1900 Bachelot St, Honolulu, HI 96817.
Care Cost Calculator: See Prices in Your Area
Nursing Home Data Explorer
Don’t Wait Too Long: 7 Red Flag Signs Your Parent Needs Assisted Living Now
The True Cost of Assisted Living in 2025 – And How Families Are Paying For It
Understanding Senior Living Costs: Pricing Models, Discounts & Financial Assistance


