Meadow Grove Transitional Care
Nursing Home · Grove City, OH
CMS overall rating Info The Overall CMS Rating is scored from 1 to 5 stars and combines results from health inspections, staffing levels, and quality measures. Health inspections carry the most weight. Staffing and quality scores can increase or decrease the final rating based on performance compared to state and national standards.

Meadow Grove Transitional Care

Nursing Home · Grove City, OH
CMS overall rating Info The Overall CMS Rating is scored from 1 to 5 stars and combines results from health inspections, staffing levels, and quality measures. Health inspections carry the most weight. Staffing and quality scores can increase or decrease the final rating based on performance compared to state and national standards.
Calculator: See prices in your area
Meadow Grove Transitional Care accepts Medicare, Medicaid, and private pay.

Overview of Meadow Grove Transitional Care

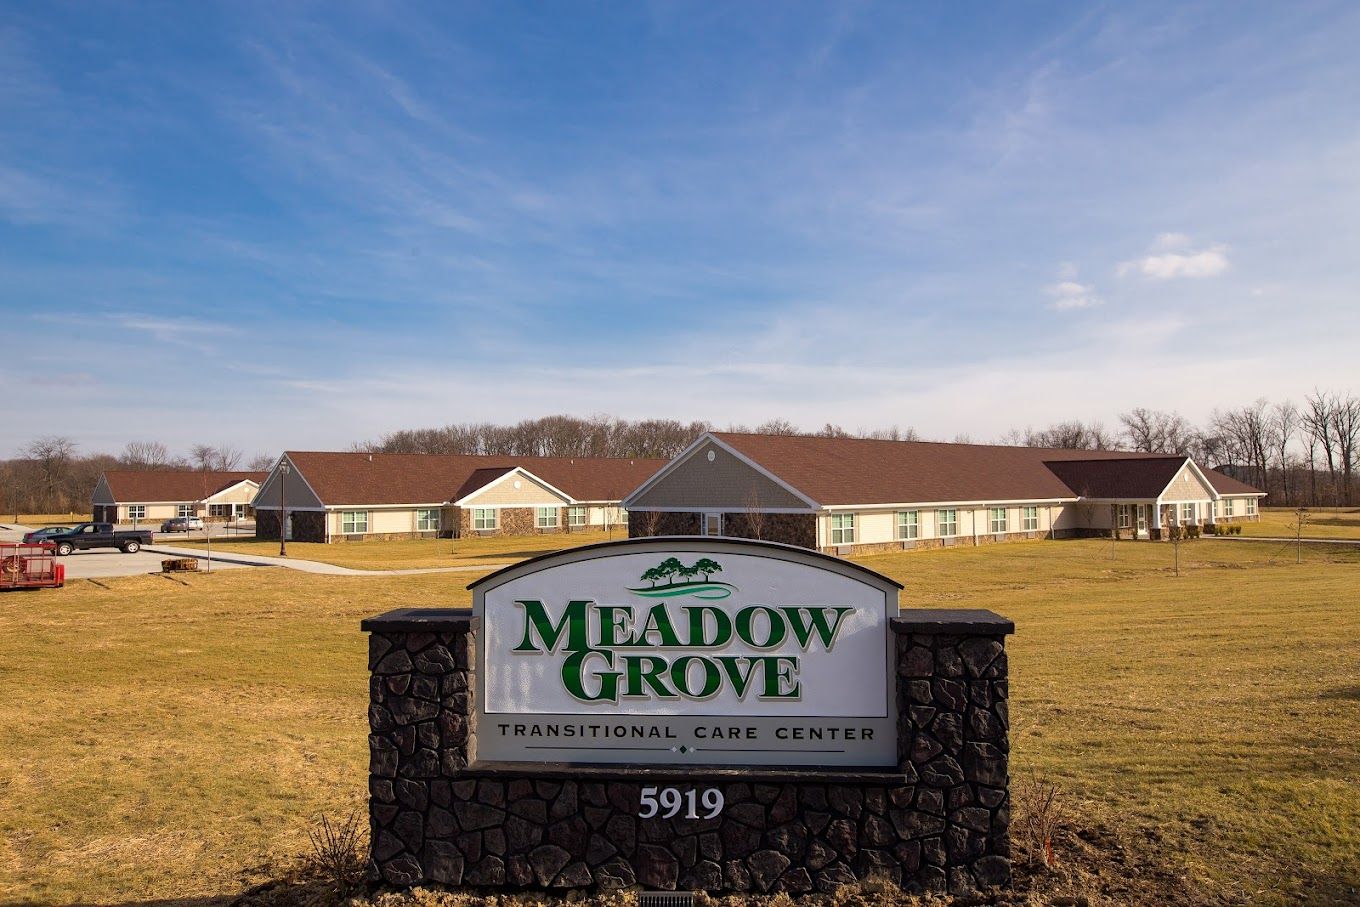
Tucked away in the serene area of Grove City, OH, Meadow Grove Transitional Care is a reliable senior living community, offering state-of-the-art rehabilitation, skilled nursing, respite care, and hospice care. The community features 99 well-designed units tailored to accommodate residents’ unique safety and care needs. A team of highly trained registered nurses are available 24 hours a day, 7 days a week to attend to residents’ emergencies and needs, making sure they are comfortable and well-cared for.

With access to physical, speech, and occupational therapy services, residents are guaranteed to maintain the functionality they need to preserve their independence for as long as possible. Residents also have access to a compassionate hospice team that provides comfort to them and their families during end-of-life care, ensuring their peace, comfort, and dignity in every stage of life. At Meadow Grove Transitional Care, residents are well-supported throughout their retirement years.

(614) 594-1600

Quality ratings

Measured by Centers for Medicare & Medicaid Services (CMS)

Overall rating Info The Overall CMS Rating combines results from health inspections, staffing levels and quality measures. Health inspections carry the most weight. Staffing and quality scores can increase or decrease the final rating based on performance compared to state and national standards.
▲ 17.6% Above OH avg. ▲ 17.6% Above OH avg.Click the badge to see the full State ranking.Click here to see the full State ranking.
Health Inspection Info Based on the results of the facility's three most recent standard inspections and any complaint investigations. CMS reviews the number, scope, and severity of deficiencies, with more recent findings weighted more heavily.
▲ 38.9% Above OH avg. ▲ 38.9% Above OH avg.Click the badge to see the full State ranking.Click here to see the full State ranking.
Staffing Info Measures average nursing staff hours per resident per day, including Registered Nurses (RNs) and total nursing staff. Ratings are adjusted based on the level of care residents require and are compared to state and national benchmarks.
▼ 29.8% Below OH avg. ▼ 29.8% Below OH avg.Click the badge to see the full State ranking.Click here to see the full State ranking.
Quality Measures Info Based on clinical and physical health indicators reported to CMS, such as hospital readmissions, falls, pressure ulcers, and improvements in mobility. These measures reflect how well residents' health needs are being managed.
▼ 9.5% Below OH avg. ▼ 9.5% Below OH avg.Click the badge to see the full State ranking.Click here to see the full State ranking.

Staffing hours breakdown

Info Daily nursing hours per resident by staff type, reported to CMS. Higher is generally better — compare this facility to state and national averages to see where staffing stands.

Hours per resident per day — compared to Ohio state averages

Total nursing care / resident Info This home is ranked 171st out of 203 homes in Ohio. Total adjusted nursing hours per resident per day, combining RN, LPN, and aide time. CMS adjusts this for case-mix so facilities can be fairly compared.
2h 59m per day
Rank #171 / 203Nurse hours — State benchmarkedThis home is ranked 171st out of 203 homes in Ohio. Shows adjusted nurse hours per resident per day benchmarked to the Ohio average, with a ranking across 203 Ohio SNFs. More hours mean more direct care. The national average is about 3.5 hrs; below 3.0 is a red flag.Click the rank badge to see the full State ranking.Click here to see the full State ranking.
This facility Ohio avg (3h 50m per day)
vs Ohio avg
-22%

3 of 6 metrics below state avg

Standout metric Weekend Total Nursing is +3% above state avg
Staff typeHours / Day / Residentvs state avg
Registered Nurse (RN) Info RNs hold the highest nursing license and can assess residents, interpret test results, and direct care plans. More RN hours per day often signals stronger clinical oversight and faster response to health changes. 34m per day ▼ 11% State avg: 38m per day · National avg: 41m per day
LPN / LVN Info Licensed Practical Nurses (LPNs) or Licensed Vocational Nurses (LVNs) deliver routine hands-on care — medication administration, wound dressing, and monitoring vital signs. They work under RN supervision and make up a large share of daily bedside care. 54m per day ▼ 7% State avg: 58m per day · National avg: 52m per day
Nurse Aide Info Certified Nurse Aides (CNAs) provide the most direct day-to-day assistance: bathing, dressing, feeding, and mobility. Nurse aide hours are typically the largest staffing category and directly affect residents' quality of life. 2h 9m per day ■ Avg State avg: 2h 8m per day · National avg: 2h 21m per day
Weekend Total Nursing Info Combined nursing hours (RN + LPN + Nurse Aide) per resident per day on weekends. Staffing often drops on weekends — this figure reveals whether the facility maintains adequate coverage outside of weekday hours. 3h 23m per day ▲ 3% State avg: 3h 17m per day · National avg: 3h 26m per day
Physical Therapist Info Hours per resident per day provided by licensed Physical Therapists (PTs) or PT Assistants. PT services help residents recover mobility after injury or illness and are especially important for post-acute (short-stay) rehabilitation. 3m per day ■ Avg State avg: 3m per day · National avg: 4m per day
Weekend RN Info Registered nurse hours specifically on weekends. Facilities sometimes reduce RN presence on Saturdays and Sundays — a low weekend RN figure compared to weekday hours can indicate reduced clinical oversight when most administrative staff are absent. 23m per day ▼ 8% State avg: 25m per day · National avg: 29m per day

Types of Care at Meadow Grove Transitional Care

Nursing Home

Capacity and availability

This home is often near full

Occupancy higher than 95% suggests steady demand, but availability may be limited.

Higher occupancy than the Ohio average: 78.7%
Occupancy rate 96% Rank #9 / 204Occupancy rate — State benchmarkedThis home is ranked 9th out of 204 homes in Ohio. Shows this facility's occupancy rate versus the Ohio average, with its Statewide rank out of 204. Higher occupancy signals strong local demand and financial stability.Click the rank badge to see the full State ranking.Click here to see the full State ranking.
Avg. Length of Stay 93 days
Occupancy rate
96% Rank #9 / 204Occupancy rate — State benchmarkedThis home is ranked 9th out of 204 homes in Ohio. Shows this facility's occupancy rate versus the Ohio average, with its Statewide rank out of 204. Higher occupancy signals strong local demand and financial stability.Click the rank badge to see the full State ranking.Click here to see the full State ranking.
Avg. Length of Stay
93 days
Years in operation
13 years in operation Rank #85 / 133Years in operation — State benchmarkedThis home is ranked 85th out of 133 homes in Ohio. Shows how long this facility has been in operation compared to other Ohio SNFs. Longer operating histories may benefit residents, families, and staff.Click the rank badge to see the full State ranking.Click here to see the full State ranking.
A community with a solid operating history and experience delivering ongoing care.
Walk Score
Walk Score: 1 / 100 Rank #675 / 706Walk Score — State benchmarkedThis home is ranked 675th out of 706 homes in Ohio. Shows how walkable this facility's neighborhood is compared to the average Walk Score across Ohio SNFs. Higher scores benefit residents, families, and staff.Click the rank badge to see the full State ranking.Click here to see the full State ranking.
Car-dependent. Most errands require a car, with limited nearby walkable options.
BBB Rating
BBB Rating: A+ (Not Accredited)
An independent rating from the Better Business Bureau based on factors such as complaint history, transparency, and business practices.
How BBB ratings work

About this community

License Details

CMS Certification Number366446

Staffing

Key information about the people who lead and staff this community.

Leadership

ContactMs. Lura Sandy, Administrator

Therapy & Rehabilitation

2 services
Rehabilitation Services
Respite Care

Staffing & Medical

1 service
24-Hour Staffing

Amenities & Lifestyle

In-House Salon
Fine Dining
Outdoor Activities
Wellness Therapies
Spacious Rooms
Strong Community
ActivitiesA variety of activities including fitness classes, arts and crafts, social events, and outings are offered.
Specific ProgramsPhysical Therapy, Occupational Therapy, Speech Therapy, Hospice & Palliative Care

Dining & Nutrition

Food DescriptionFine dining available with meals served in a communal setting.

Contact Meadow Grove Transitional Care

Inspection History

In Ohio, the Department of Health, Bureau of Survey and Certification conducts unannounced onsite inspections to evaluate the quality of care and environment in all licensed facilities.

Since 2020 · 6 years of data 24 citations

Inspection Scorecard Info This scorecard compares key inspection, citation, and complaint metrics at this facility against the Ohio state average. Metrics rated ≥15% worse than average are highlighted in red; those ≥15% better are highlighted in green.

Since 2020 vs. Ohio state average
Overall vs. OH average 2 Worse Metrics worse than Ohio average:
• Total citations (1100% above)
• Citations per year (1233% above)
0 Better No metrics in this bucket.
Latest Inspection March 24, 2025 Complaint Investigation

Citations Info Citations are formal regulatory issues recorded during state inspections.

This FacilityOH Averagevs. OH Avg
Total citations Info Formal regulatory issues recorded by inspectors across all inspection types. 242 This facility has 1100% more total citations than a typical Ohio nursing home (24 vs. OH avg 2).↑ 1100% worse
Citations per year Info Average citations per year since 2020. 40.3 This facility has 1233% more citations per year than a typical Ohio nursing home (4 vs. OH avg 0.3).↑ 1233% worse

Inspection Reports Summary Info An editor-reviewed summary of the themes and findings across this facility's recent inspection reports.

The most recent inspection on March 24, 2025, identified deficiencies related to monitoring resident fluid restrictions, nutritional status, and weight documentation. Earlier inspections also cited issues with resident care, including assistance with daily living activities, medication management, wound care, and communication with physicians. Complaint investigations found substantiated deficiencies involving delayed physician notifications, incomplete documentation, and wound treatment delays, but no enforcement actions or fines were listed in the available reports. Most complaints were substantiated, and the facility consistently showed challenges in monitoring and documentation practices. The inspection history indicates ongoing issues with resident care processes, with no clear pattern of improvement or worsening over time.

Read the full inspection reports for this facility, including detailed findings and corrective actions.

Show Inspection Reports

Health Inspection History

Inspections since 2020
Total health inspections 5

Ohio average 6.7


Last Health inspection on Mar 2025

Total health citations
20 Rank #62 / 203Health citations — State benchmarkedThis home is ranked 62nd out of 203 homes in Ohio. Shows this facility's total health deficiency citations benchmarked to the Ohio State average, with a ranking across all 203 OH SNFs. Lower citation counts earn a better rank.Click the rank badge to see the full State ranking.Click here to see the full State ranking.

Ohio average 30.9

Citations per inspection
4 Rank #93 / 203Citations per inspection — State benchmarkedThis home is ranked 93rd out of 203 homes in Ohio. Shows average deficiency citations per CMS inspection for this facility versus the Ohio mean across 203 SNFs with citation data. Lower is better.Click the rank badge to see the full State ranking.Click here to see the full State ranking.

Ohio average 4.59


Health citations are formal notices following inspections when they fail to comply with safety and care standards.

15 of 20 citations resulted from standard inspections; 4 of 20 resulted from complaint investigations; and 1 of 20 came from combined inspections (standard and complaint).

Breakdown of citation severity (last 6 years)
Critical Health citations
0
100% better than Ohio average

Ohio average: 0.3


Serious Health citations
0
100% better than Ohio average

Ohio average: 0.9

0 critical citations Ohio average: 0.3

0 serious citations Ohio average: 0.9

20 moderate citations Ohio average: 29

0 minor citations Ohio average: 0.7
Citations history (last 6 years)
Infection Control moderate citation Mar 24, 2025
Corrected

Nutrition moderate citation Mar 24, 2025
Corrected

Pharmacy moderate citation Mar 24, 2025
Corrected

Quality of Care moderate citation Mar 24, 2025
Corrected

Staffing Data

Reporting period: October 1 – December 31, 2025 (Q4 2025). Source: CMS Payroll-Based Journal report.

Total staff 115
Employees 98
Contractors 17
Staff to resident ratio 1.21:1
41% worse than Ohio average
Ohio average ratio: 2.04:1 Ohio average ratio: 2.04:1See full Ohio ranking
Avg staff/day 39
Average shift 9.8 hours
21% better than Ohio average
Ohio average: 8.1 hours Ohio average shift: 8.1 hoursSee full Ohio ranking
Total staff hours (quarter) 35,337

Nursing staff breakdown

Q4 2025 · Oct 1 – Dec 31 More info This data comes from the CMS Payroll-Based Journal report covering October 1 – December 31, 2025.
Registered Nurse

Manages medical care and health needs.

RN Staff 11
Average shift length Info Average shift length. Calculated as total hours divided by days worked and average staff per day. 11.5 hours

No contractors work on this role.

Licensed Practical Nurse

Assists with medical care and medications.

LPN Staff 15
Average shift length Info Average shift length. Calculated as total hours divided by days worked and average staff per day. 11.9 hours

No contractors work on this role.

Certified Nursing Assistant

Helps with daily care and mobility.

CNA Staff 50
Average shift length Info Average shift length. Calculated as total hours divided by days worked and average staff per day. 11.2 hours

No contractors work on this role.

Contractor staffing

Q4 2025 · Oct 1 – Dec 31 More info This data comes from the CMS Payroll-Based Journal report covering October 1 – December 31, 2025.

Total hours from contractors

7.8%

2,758 contractor hours this quarter

Speech Language Pathologist: 4 Physical Therapy Aide: 3 Qualified Social Worker: 3 Physical Therapy Assistant: 2 Occupational Therapy Assistant: 2 Respiratory Therapy Technician: 1 Therapeutic Recreation Specialist: 1 Medical Director: 1

Staff by category

Q4 2025 · Oct 1 – Dec 31 More info This data comes from the CMS Payroll-Based Journal report covering October 1 – December 31, 2025.
Certified Nursing Assistant5005017,09192100%11.2
Licensed Practical Nurse150156,32192100%11.9
Registered Nurse110112,9458693%11.5
RN Director of Nursing4041,3126571%7.9
Clinical Nurse Specialist6061,2468997%9
Dental Services Staff2021,0546571%8.5
Physical Therapy Aide0338457582%6.6
Other Dietary Services Staff4046288188%4.9
Dietitian1015335762%9.3
Administrator1014806065%8
Nurse Practitioner1014806065%8
Speech Language Pathologist0444716672%7.1
Occupational Therapy Aide2024325358%8
Respiratory Therapy Technician0113967480%5.4
Qualified Social Worker0333776874%5.5
Physical Therapy Assistant0223547379%4.9
Therapeutic Recreation Specialist0112486065%4.1
Nurse Aide in Training1015855%11.6
Occupational Therapy Assistant0223467%5.6
Medical Director0113367%5.5
50 Certified Nursing Assistant
% of Days 100%
15 Licensed Practical Nurse
% of Days 100%
11 Registered Nurse
% of Days 93%
4 RN Director of Nursing
% of Days 71%
6 Clinical Nurse Specialist
% of Days 97%
2 Dental Services Staff
% of Days 71%
3 Physical Therapy Aide
% of Days 82%
4 Other Dietary Services Staff
% of Days 88%
1 Dietitian
% of Days 62%
1 Administrator
% of Days 65%
1 Nurse Practitioner
% of Days 65%
4 Speech Language Pathologist
% of Days 72%
2 Occupational Therapy Aide
% of Days 58%
1 Respiratory Therapy Technician
% of Days 80%
3 Qualified Social Worker
% of Days 74%
2 Physical Therapy Assistant
% of Days 79%
1 Therapeutic Recreation Specialist
% of Days 65%
1 Nurse Aide in Training
% of Days 5%
2 Occupational Therapy Assistant
% of Days 7%
1 Medical Director
% of Days 7%

Penalties and fines

Federal penalties imposed by CMS for regulatory violations, including civil money penalties (fines) and denials of payment for new Medicare/Medicaid admissions.

Source: CMS Penalties Database

No penalties in the past 3 years

No civil money penalties or payment denials were reported in the last 3 years.

Quality of care over time

These measures show how residents usually do over time at this home, based on health outcomes and preventive care.

High-risk clinical events score Info A composite score based on pressure ulcers, falls with injury, weight loss, walking ability decline, and activities of daily living decline. 4.7
19% better than Ohio average

Ohio average: 5.8

Functional decline score Info A composite score based on activities of daily living decline, walking ability decline, and incontinence. 9.1
28% better than Ohio average

Ohio average: 12.7

Long-stay resident measures
Significantly above average Ohio avg: 4.7 Info CMS star rating based on long-stay quality measure performance. 5 stars = significantly above average, 1 star = significantly below average.
Need for Help with Daily Activities Increased Info Percent of long-stay residents whose need for help with daily activities has increased 2.0%
70% better than Ohio average

Ohio average: 6.8%

Walking Ability Worsened Info Percent of long-stay residents whose ability to move independently worsened 2.8%
68% better than Ohio average

Ohio average: 8.9%

Low Risk Residents with Bowel/Bladder Incontinence Info Percent of low risk long-stay residents who lose control of their bowels or bladder 22.5%
In line with Ohio average

Ohio average: 22.0%

Falls with Major Injury Info Percent of long-stay residents experiencing one or more falls with major injury 7.0%
103% worse than Ohio average

Ohio average: 3.4%

High Risk Residents with Pressure Ulcers Info Percent of long-stay high risk residents with pressure ulcers 4.9%
26% worse than Ohio average

Ohio average: 3.9%

Urinary Tract Infection Info Percent of long-stay residents with a urinary tract infection 0.0%
100% better than Ohio average

Ohio average: 0.5%

Lost Too Much Weight Info Percent of long-stay residents who lose too much weight 6.9%
11% worse than Ohio average

Ohio average: 6.2%

Depressive Symptoms Info Percent of long-stay residents who have depressive symptoms 32.3%
35% worse than Ohio average

Ohio average: 24.0%

Antipsychotic Use Info Percent of long-stay residents who received an antipsychotic medication 3.7%
56% better than Ohio average

Ohio average: 8.4%

Pneumococcal Vaccine Info Percent of long-stay residents assessed and appropriately given the pneumococcal vaccine 89.1%
In line with Ohio average

Ohio average: 92.4%

Influenza Vaccine Info Percent of long-stay residents assessed and appropriately given the seasonal influenza vaccine 100.0%
6% better than Ohio average

Ohio average: 94.5%

Short-stay resident measures
Average Ohio avg: 2.4 Info CMS star rating based on short-stay quality measure performance. 5 stars = much above average, 1 star = much below average.
Pneumococcal Vaccine Info Percent of short-stay residents assessed and appropriately given the pneumococcal vaccine 97.2%
25% better than Ohio average

Ohio average: 78.0%

Antipsychotic medication increase Info Percent of short-stay residents who newly received an antipsychotic medication 0.2%
81% better than Ohio average

Ohio average: 1.3%

Influenza Vaccine Info Percent of short-stay residents assessed and appropriately given the seasonal influenza vaccine 91.7%
21% better than Ohio average

Ohio average: 75.6%

Re-hospitalized after SNF stay Info Percentage of short-stay residents who were re-hospitalized after their nursing home admission. 19.8%
21% better than Ohio average

Ohio average: 25.1%

Emergency department visits Info Percentage of short-stay residents who had an outpatient emergency department visit. 14.5%
16% worse than Ohio average

Ohio average: 12.5%

Falls with major injury Info Percentage of SNF residents who experience falls with major injury during their stay. 0.0%
100% better than Ohio average

Ohio average: 0.8%

Ability to care for self at discharge Info Percentage of residents at or above expected ability to care for themselves at discharge. 32.7%
39% worse than Ohio average

Ohio average: 53.7%

Successful return to home or community Info Rate of successful return to home or community from a skilled nursing facility. 70.6%
40% better than Ohio average

Ohio average: 50.6%

Breakdown by payment type

Medicare

45% of new residents, usually for short-term rehab.

Typical stay 18 days

Private pay

53% of new residents, often for short stays.

Typical stay 4 - 5 months

Medicaid

2% of new residents, often for long-term daily care.

Typical stay 2 years

Facility Characteristics

Source: CMS Long-Term Care Facility Characteristics (Data as of Jan 2026)

Total residents 95
Medicare
8
8.4% of residents
Medicaid
64
67.4% of residents
Private pay or other
23
24.2% of residents
Programs & Services
Residents Group

Residents meet regularly to discuss policies, care quality, and activities

Active Resident Council

Organized group of residents that meets regularly to discuss facility policies, quality of life, and activities.

Finances and operations

Privately-owned community
Operated by a business corporation.
Home revenue
$13.4M
Profit
$1.5M
Privately-owned community Operated by a business corporation.
Home revenue
$13.4M Rank #69 / 203Revenue — State benchmarkedThis home is ranked 69th out of 203 homes in Ohio. Shows this facility's annual revenue compared to the Ohio SNF average. Higher revenue generally means more resources for staffing and capital — read alongside Payroll %.Click the rank badge to see the full State ranking.Click here to see the full State ranking.
Profit
$1.5M
Payroll costs Info The portion of the home's budget spent on staff, including nurses, caregivers, and other employees who support care and operations. Rank #78 / 203Payroll — State benchmarkedThis home is ranked 78th out of 203 homes in Ohio. Shows total annual staff payroll benchmarked to the Ohio average. Higher payroll investment relative to peers often signals better staffing and less reliance on cheaper contract labor.Click the rank badge to see the full State ranking.Click here to see the full State ranking.
$6.1M
45.2% of revenue Rank #155 / 203Payroll % — State benchmarkedThis home is ranked 155th out of 203 homes in Ohio. Shows payroll as a percentage of revenue versus the Ohio average. Well-run Ohio SNFs typically land around 54–64% — the top third Statewide. Below 25% may signal understaffing or heavy agency use — read with Staffing ratings.Click the rank badge to see the full State ranking.Click here to see the full State ranking.
Other operating costs Info All remaining costs needed to run the home, such as food, utilities, building maintenance, supplies and administrative expenses.
$5.8M
Total costs $11.9M

What does this home offer?

Total residents icon

Total Residents: 99 Residents

Housing options icon

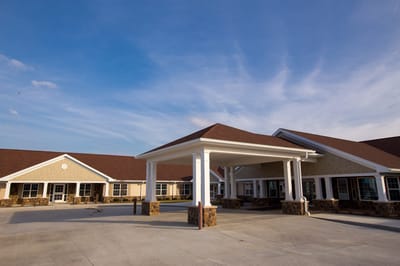
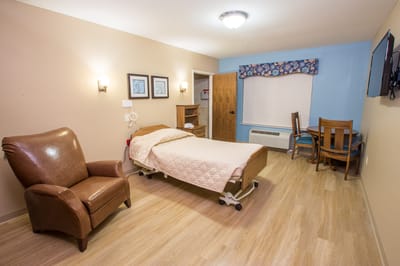
Housing Options: Private / Semi-Private Rooms

Building type icon
Building type icon

Building Type: Single-story

Who this home usually serves

TYPE OF STAY

Mix of rehab and long-term care

This home supports both short-term rehab and long-term care, with residents staying for a wide range of durations.

Places of interest near Meadow Grove Transitional Care

Address 5.2 miles from city center Info Estimated distance in miles from Grove City's city center to Meadow Grove Transitional Care's address, calculated via Google Maps.

Calculate Travel Distance to Meadow Grove Transitional Care

Add your location

Address

Financial Assistance for
Nursing Home in Ohio

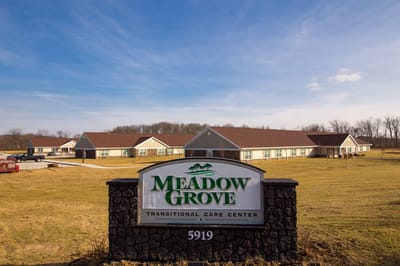
Meadow Grove Transitional Care is located in Grove City, Ohio.
Here are the financial assistance programs available to residents in Ohio.

Get Financial aid guidance

PASSPORT Waiver

Ohio Medicaid PASSPORT

Age 60+
General Ohio resident, Medicaid-eligible, nursing home-level care need.
Income Limits (2025) ~$2,829/month 300% FBR, individual
Asset Limits $2,000 (individual), $3,000 (couple).
OH

Administered through regional agencies; waitlists possible.

Benefits
Personal care (5-7 hours/day) Respite (240 hours/year) Adult day care ($65/day) Home modifications ($1,500 avg.)

Ohio Home Care Program (non-Medicaid)

OH HCP

Age 60+
General Ohio resident, at risk of decline.
Income Limits ~$2,000/month individual, varies
Asset Limits $5,000 individual
OH

Limited funding; regional variation.

Benefits
In-home care (3-5 hours/week) Respite (up to 10 days/year) Transportation (~5 trips/month)

Assisted Living Waiver (ALW)

Ohio Assisted Living Waiver

Age 21+ (65+ prioritized)
General OH resident, Medicaid-eligible, NFLOC.
Income Limits (2025) ~$2,829/month (individual); QIT required.
Asset Limits $2,000 (individual), $3,000 (couple).
OH

Covers ~300 facilities; room/board not included (separate cost).

Benefits
Personal care Meals Medication management Transportation (~$3,000-$4,000/month value)

Program of All-Inclusive Care for the Elderly (PACE)

Ohio PACE (e.g., McGregor PACE)

Age 55+
General OH resident (specific counties), NFLOC, safe with PACE support.
Income Limits (2025) ~$2,829/month (Medicaid-eligible); private pay option available.
Asset Limits $2,000 (individual), $3,000 (couple) for Medicaid enrollees.
OH

Available in 9 counties (e.g., Cuyahoga, Franklin); expanding via Healthy Aging Grants.

Benefits
Personal care (5-7 hours/day) Medical care Meals Transportation Respite Therapies

Medicare Savings Program (MSP)

Ohio Medicare Savings Program

Age 65+ or disabled
General OH resident, Medicare Part A/B.
Income Limits (2025) ~$2,510/month (QMB), ~$3,380/month (SLMB), ~$3,598/month (QI)—individual.
Asset Limits $9,430 (individual), $14,130 (couple).
OH

Three tiers; includes Extra Help for Part D; no waitlist.

Benefits
Covers Part B premiums ($174.70/month) Deductibles ($240/year) Copays (~20%)

Home Energy Assistance Program (HEAP)

Ohio HEAP

Age 60+ prioritized
General OH resident, low-income household.
Income Limits (2025) ~$3,970/month individual, 185% FPL
Asset Limits Not assessed; income-focused.
OH

Covers gas, electric, oil; emergency aid via Winter/Summer Crisis Programs.

Benefits
Heating/cooling aid ($300-$1,000/season) Emergency aid ($500 max)

Family Caregiver Support Program (FCSP)

Ohio Family Caregiver Support Program

Age
General Caregivers of 60+ needing care or 55+ caregivers of others; OH resident; functional needs (2+ ADLs).
Income Limits (2025) Prioritizes ~$24,980/year (individual); no strict cap.
Asset Limits Not assessed; need-based.
OH

12 AAAs; rural/low-income priority; volunteer respite option.

Benefits
Respite (4-6 hours/week or 5 days/year) Adult day care ($60/day) Training Supplies (~$500/year)

VA Aid and Attendance (A&A) and Housebound Benefits

Ohio VA Aid and Attendance/Housebound

Age 65+ or disabled veteran/spouse
General OH resident, wartime service, need for ADL help (A&A) or homebound.
Income Limits (2025) Net income < ~$1,984/month (veteran with dependent, A&A); pension offsets income.
Asset Limits ~$155,356 net worth limit
OH

High veteran demand; supports care in multiple settings.

Benefits
Cash (~$1,433-$2,642/month veteran, ~$951-$1,318 spouse) for care costs (e.g., in-home, assisted living)

Homestead Exemption

Ohio Homestead Exemption

Age 65+ (or disabled)
General OH resident, homeowner, low-income.
Income Limits (2025) ~$38,500/year individual, adjusted annually
Asset Limits Not assessed; home ownership required.
OH

Reduces taxable value by $25,000; applies to primary residence.

Benefits
Tax reduction (~$400-$800/year avg., varies by county)

Save the Dream Ohio (Homeowner Assistance Fund)

Ohio Save the Dream

Age 60+ prioritized
General OH resident, homeowner, hardship post-Jan 21, 2020.
Income Limits (2025) ~$147,600/year family of 4, 150% AMI; varies by county
Asset Limits Not assessed; hardship-focused.
OH

Covers delinquent mortgages, utilities, taxes; max $25,000 mortgage aid.

Benefits
Mortgage aid ($25,000 max) Utility/property tax aid ($5,000 avg.)

Compare Nursing Home around Grove City

The information below is reported by the Ohio Department of Health, Bureau of Survey and Certification.

2 facilities compared · CMS & OH Dept. of Health data

Filter by care type
Meadow Grove Transitional Care
NH

Nursing Home Licensed facility providing 24/7 skilled nursing care for residents with complex, ongoing medical needs. Staffed by RNs, LPNs, and CNAs. Inspected and star-rated annually by CMS. Accepts Medicare (short-term rehab) and Medicaid (long-term care).

AL

Assisted Living A licensed, long-term care setting for seniors or individuals with disabilities who need help with daily activities — like bathing, dressing, and medication management — but not 24-hour skilled nursing. Offers housing, meals, and around-the-clock support while aiming to maximize resident independence.

IL

Independent Living Lifestyle-focused communities for older adults offering dining, activities, and transportation with minimal personal care. Best for active, independent seniors who want community without medical support.

MC

Memory Care Secured, specialized care for people living with Alzheimer's or dementia. Staff trained in cognitive impairment, with higher staff-to-resident ratios and an environment designed to reduce confusion and wandering risk.

Grove City (Blue Star Drive)99 92.6% +18%2.98 +4%-16%$0204.0-92A+ 1 Valerie Kettell$13.4M$6.1M45.2%366446
Monterey Health & Rehabilitation Center
NH

Nursing Home Licensed facility providing 24/7 skilled nursing care for residents with complex, ongoing medical needs. Staffed by RNs, LPNs, and CNAs. Inspected and star-rated annually by CMS. Accepts Medicare (short-term rehab) and Medicaid (long-term care).

AL

Assisted Living A licensed, long-term care setting for seniors or individuals with disabilities who need help with daily activities — like bathing, dressing, and medication management — but not 24-hour skilled nursing. Offers housing, meals, and around-the-clock support while aiming to maximize resident independence.

HC

Home Care Professional care delivered in the person's own home — from companionship and errands to skilled nursing and therapy. Allows seniors to age in place. Medicare covers skilled home health when medically necessary.

Grove City (Hoover Road)155 70.1% -11%3.15 +42%-11%$3.3k364.51111- 65 Macintosh Management Company LLC$15.2M$6.6M43.4%365077

Frequently Asked Questions about Meadow Grove Transitional Care

What neighborhood is Meadow Grove Transitional Care in?

Meadow Grove Transitional Care is in the Blue Star Drive neighborhood of Grove City.

Is Meadow Grove Transitional Care in a walkable area?

Meadow Grove Transitional Care has a walk score of 1. Car-dependent. Most errands require a car, with limited nearby walkable options.

What is the occupancy rate at Meadow Grove Transitional Care?

Meadow Grove Transitional Care's occupancy is 92.6%.

Are there photos of Meadow Grove Transitional Care?

Yes — there are 15 photos of Meadow Grove Transitional Care in the photo gallery on this page.

What is the address of Meadow Grove Transitional Care?

Meadow Grove Transitional Care is located at 5919 Blue Star Dr, Grove City, OH 43123, United States.

What is the phone number of Meadow Grove Transitional Care?

(614) 594-1600 will put you in contact with the team at Meadow Grove Transitional Care.

Is Meadow Grove Transitional Care Medicare or Medicaid certified?

Yes — Meadow Grove Transitional Care is a CMS-certified provider of Medicare and Medicaid.

Guides for Better Senior Living

Care Cost Calculator: See Prices in Your Area

Nursing Home Data Explorer

Don’t Wait Too Long: 7 Red Flag Signs Your Parent Needs Assisted Living Now

The True Cost of Assisted Living in 2025 – And How Families Are Paying For It

Understanding Senior Living Costs: Pricing Models, Discounts & Financial Assistance

Explore Open Rooms
1 Contact details
2 What type of senior care service are you looking for?
3 What budget do you have in mind for senior care?
4 How soon do you need to find care?
5 Additional details

Thank you for your interest!

Our team will be in touch shortly to help with next steps.