Monterey Health & Rehabilitation Center

Assisted Living in Grove City

CMS overall rating Info The Overall CMS Rating is scored from 1 to 5 stars and combines results from health inspections, staffing levels, and quality measures. Health inspections carry the most weight. Staffing and quality scores can increase or decrease the final rating based on performance compared to state and national standards.
Calculator: See prices in your area
Monterey Health & Rehabilitation Center accepts Medicare, Medicaid, and private pay.

Overview of Monterey Health & Rehabilitation Center

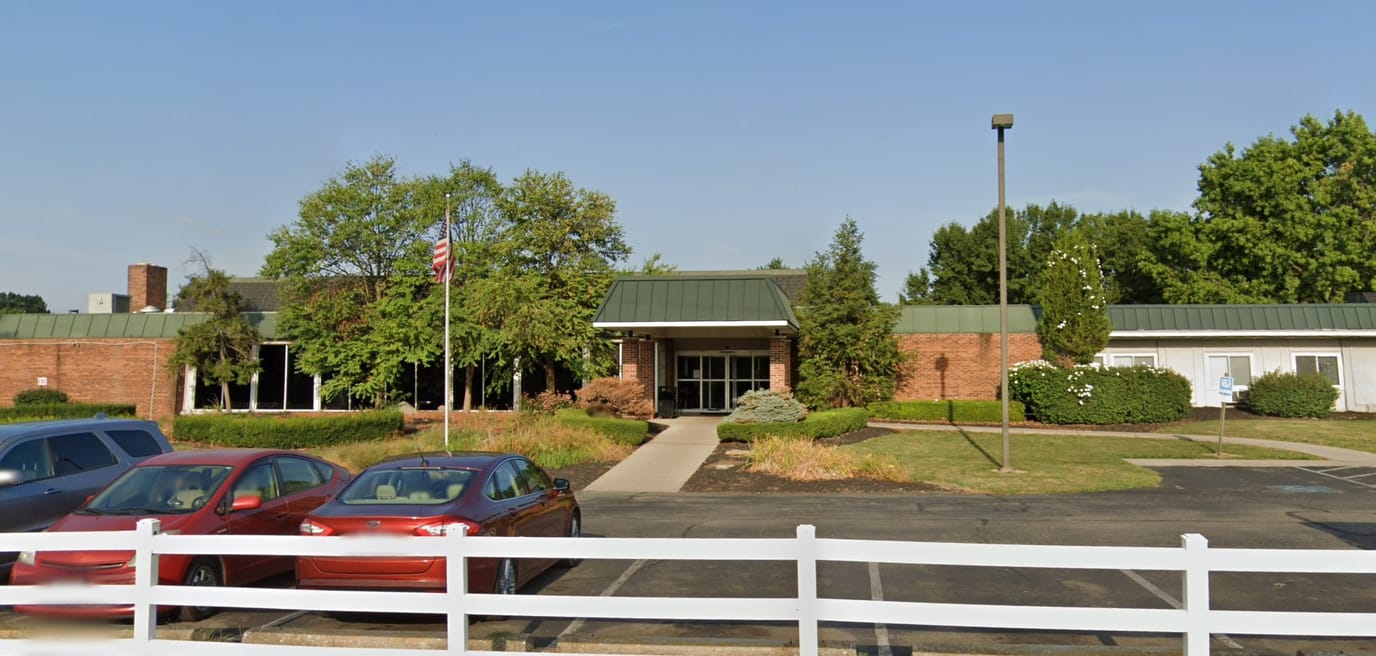
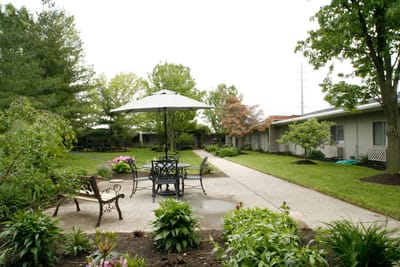
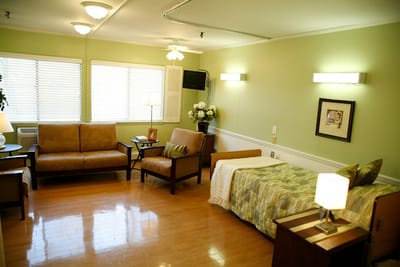
Monterey Health and Rehabilitation Center offers assisted living services for long-term care residents. The facility has an exceptional care staff committed to providing the best care possible for its residents. With a particular emphasis on post-acute rehabilitation, assisted living, and memory care services, seniors will find an efficient and results-driven approach to a fast recovery.

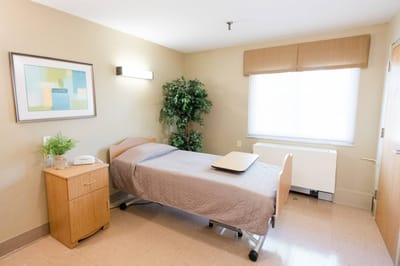
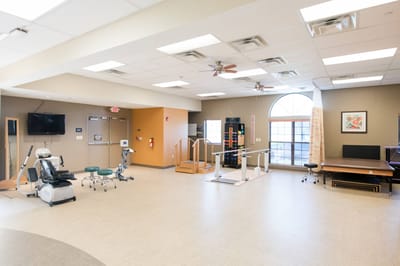
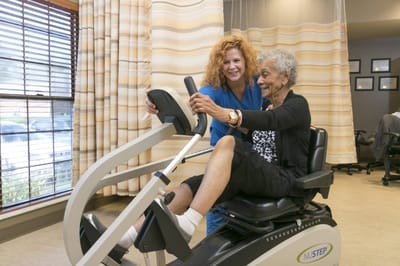
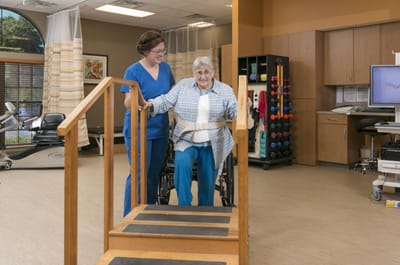
Monterey Health and Rehabilitation Center heeds a nurturing environment that cultivates definite solutions to individual needs for comfort and relaxation. Skilled nursing services include medication management, nutritional therapies, respite care, and hospice services. Rehabilitative programs include speech, occupational, and physical therapies.

(614) 875-7700

Quality ratings

Measured by Centers for Medicare & Medicaid Services (CMS)

Overall rating Info The Overall CMS Rating combines results from health inspections, staffing levels and quality measures. Health inspections carry the most weight. Staffing and quality scores can increase or decrease the final rating based on performance compared to state and national standards.
2/5 ▼ 1.2 Ohio average: 3.2/5
Health Inspection Info Based on the results of the facility's three most recent standard inspections and any complaint investigations. CMS reviews the number, scope, and severity of deficiencies, with more recent findings weighted more heavily.
1/5 ▼ 1.8 Ohio average: 2.8/5
Staffing Info Measures average nursing staff hours per resident per day, including Registered Nurses (RNs) and total nursing staff. Ratings are adjusted based on the level of care residents require and are compared to state and national benchmarks.
2/5 ▼ 0.4 Ohio average: 2.4/5
Quality Measures Info Based on clinical and physical health indicators reported to CMS, such as hospital readmissions, falls, pressure ulcers, and improvements in mobility. These measures reflect how well residents' health needs are being managed.
5/5 ▲ 0.6 Ohio average: 4.4/5

Staffing hours breakdown

Info Daily nursing hours per resident by staff type, reported to CMS. Higher is generally better — compare this facility to state and national averages to see where staffing stands.

Hours per resident per day — compared to Ohio state averages

Total nursing care / resident Info This home is ranked 130th out of 165 homes in Ohio.

Total adjusted nursing hours per resident per day, combining RN, LPN, and aide time. CMS adjusts this for case-mix so facilities can be fairly compared.
3h 9m per day
Rank #130 / 165Nurse hours — state benchmarkedThis home is ranked 130th out of 165 homes in Ohio.Shows adjusted nurse hours per resident per day benchmarked to the Ohio average, with a ranking across 165 Ohio SNFs. More hours mean more direct care. The national average is about 3.5 hrs; below 3.0 is a red flag.
This facility Ohio avg (3h 32m per day)
vs Ohio avg
-11%
Staff typeHours / dayvs state avg
Total Nursing (Weekend) Info Combined nursing hours (RN + LPN + Nurse Aide) per resident per day on weekends. Staffing often drops on weekends — this figure reveals whether the facility maintains adequate coverage outside of weekday hours. 3h 16m per day

Capacity and availability

This home usually has availability

Occupancy lower than 85% suggests more openings may be available.

Lower occupancy than the Ohio average: 78.7%
Occupancy rate 70.1% Rank #123 / 166Occupancy rate — state benchmarkedThis home is ranked 123rd out of 166 homes in Ohio.Shows this facility's occupancy rate versus the Ohio average, with its statewide rank out of 166. Higher occupancy signals strong local demand and financial stability.
Avg. Length of Stay 88 days
Occupancy rate
70.1% Rank #123 / 166Occupancy rate — state benchmarkedThis home is ranked 123rd out of 166 homes in Ohio.Shows this facility's occupancy rate versus the Ohio average, with its statewide rank out of 166. Higher occupancy signals strong local demand and financial stability.
Avg. Length of Stay
88 days

Who this home usually serves

TYPE OF STAY

Primarily long-term care, limited rehab

Most residents stay long-term, while a smaller portion are admitted for short-term rehab.

Breakdown by payment type

Medicare

13% of new residents, usually for short-term rehab.

Typical stay 1 - 2 months

Private pay

64% of new residents, often for short stays.

Typical stay 3 - 4 months

Medicaid

23% of new residents, often for long-term daily care.

Typical stay 2 months

Finances and operations

Privately-owned community
Operated by a business corporation.
Home revenue
$15.2M
Profit
$1.2M
Privately-owned community Operated by a business corporation.
Home revenue
$15.2M Rank #36 / 165Revenue — state benchmarkedThis home is ranked 36th out of 165 homes in Ohio.Shows this facility's annual revenue compared to the Ohio SNF average. Higher revenue generally means more resources for staffing and capital — read alongside Payroll %.
Profit
$1.2M
Payroll costs Info The portion of the home's budget spent on staff, including nurses, caregivers, and other employees who support care and operations. Rank #63 / 165Payroll — state benchmarkedThis home is ranked 63rd out of 165 homes in Ohio.Shows total annual staff payroll benchmarked to the Ohio average. Higher payroll investment relative to peers often signals better staffing and less reliance on cheaper contract labor.
$4.6M
30.1% of revenue Rank #144 / 165Payroll % — state benchmarkedThis home is ranked 144th out of 165 homes in Ohio.Shows payroll as a percentage of revenue versus the Ohio average. Well-run SNFs often land around 55–65%. Below 25% may signal understaffing or heavy agency use — read with Staffing ratings.
Other operating costs Info All remaining costs needed to run the home, such as food, utilities, building maintenance, supplies and administrative expenses.
$9.4M
Total costs $14.0M
Walk Score
Walk Score: 65 / 100 Rank #14 / 115Walk Score — state benchmarkedThis home is ranked 14th out of 115 homes in Ohio.Shows how walkable this facility's neighborhood is compared to the average Walk Score across Ohio SNFs. Higher scores benefit residents, families, and staff.
Moderately walkable. Some errands can be accomplished on foot, with a mix of nearby amenities.

About this community

Therapy & Rehabilitation

2 services
Rehabilitation Services
Respite Care

Staffing & Medical

2 services
Licensed Nurses/CNAs
24-Hour Staffing

Additional Services

2 services
Rehabilitation And Therapy
Skilled Nursing/Long-Term Care

Amenities & Lifestyle

In-Room Amenities
Including Individual Room Temperature Control
Flat-Screen Tv With Cable
Private Phone
And Wi-Fi
Attractive Gathering Spaces
Delicious And Flexible Dining Options
Full-Service Salon & Barbershop
Personal Laundry And Linen Service
Scheduled Activities And Outings
Transportation
Interdisciplinary Care Conferences
Visits From Dietary And Activities Staff Members
Financial Service Resource Coordinator
24-Hour Visitation
ActivitiesSocial and recreational activities every day of the week.
Specific ProgramsManaged Care

Dining & Nutrition

Food DescriptionMeals provide sustenance on many levels — physical, social, and emotional. Dining options include communal meals in dining rooms as well as room service, a beverage cart, snacks, guest meals, and coffee service.
Meals IncludedYes

What does this home offer?

Pets allowed icon
Pets allowed icon

Pets Allowed: Yes, Pets Allowed

Housing options icon

Housing Options: Private Rooms

Building type icon
Building type icon

Building Type: Single-storey

Transportation services icon

Transportation Services

Fitness and recreation icon

Fitness and Recreation

Types of Care at Monterey Health & Rehabilitation Center

Nursing Home Assisted Living Hospice Care

Contact Monterey Health & Rehabilitation Center

Health Inspection History

Inspections
Total health inspections 8

Ohio average 6.7


Last Health inspection on Jul 2025

Total health citations
36 Rank #112 / 166Health citations — state benchmarkedThis home is ranked 112th out of 166 homes in Ohio.Shows this facility's total health deficiency citations benchmarked to the Ohio state average, with a ranking across all 166 OH SNFs. Lower citation counts earn a better rank.

Ohio average 30.9

Citations per inspection
4.5 Rank #102 / 166Citations per inspection — state benchmarkedThis home is ranked 102nd out of 166 homes in Ohio.Shows average deficiency citations per CMS inspection for this facility versus the Ohio mean across 166 SNFs with citation data. Lower is better.

Ohio average 4.59


Health citations are formal notices following inspections when they fail to comply with safety and care standards.

27 of 36 citations resulted from standard inspections; and 9 of 36 resulted from complaint investigations.

Breakdown of citation severity (last 3 years)
Critical Health citations More info
0
100% better than Ohio average

Ohio average: 0.3


Serious Health citations More info 1
11% worse than Ohio average

Ohio average: 0.9

0 critical citations More info Ohio average: 0.3

1 serious citation More info Ohio average: 0.9

34 moderate citations More info Ohio average: 29

1 minor citation More info Ohio average: 0.7
Citations history (last 3 years)
Resident Rights moderate citation Info Issues related to resident's rights, including dignity, privacy, and the ability to make decisions about their care. Jul 09, 2025
Corrected

Quality of Care serious citation Info Issues related to how well residents receive appropriate treatment and support for their medical and daily care needs. Jun 10, 2025
Corrected

Nutrition moderate citation Info Issues related to food quality, meal service, and resident's nutritional needs. Apr 01, 2025
Corrected

Infection Control moderate citation Info Issues related to preventing and controlling infections, including hygiene practices and safety protocols. Nov 24, 2024
Corrected

Financial Assistance for
Assisted Living in Ohio

Monterey Health & Rehabilitation Center is located in Grove City, Ohio.
Here are the financial assistance programs available to residents in Ohio.

Get Financial aid guidance

PASSPORT Waiver

Ohio Medicaid PASSPORT

Age 60+
General Ohio resident, Medicaid-eligible, nursing home-level care need.
Income Limits (2025) ~$2,829/month 300% FBR, individual
Asset Limits $2,000 (individual), $3,000 (couple).
OH

Administered through regional agencies; waitlists possible.

Benefits
Personal care (5-7 hours/day) Respite (240 hours/year) Adult day care ($65/day) Home modifications ($1,500 avg.)

Ohio Home Care Program (non-Medicaid)

OH HCP

Age 60+
General Ohio resident, at risk of decline.
Income Limits ~$2,000/month individual, varies
Asset Limits $5,000 individual
OH

Limited funding; regional variation.

Benefits
In-home care (3-5 hours/week) Respite (up to 10 days/year) Transportation (~5 trips/month)

Assisted Living Waiver (ALW)

Ohio Assisted Living Waiver

Age 21+ (65+ prioritized)
General OH resident, Medicaid-eligible, NFLOC.
Income Limits (2025) ~$2,829/month (individual); QIT required.
Asset Limits $2,000 (individual), $3,000 (couple).
OH

Covers ~300 facilities; room/board not included (separate cost).

Benefits
Personal care Meals Medication management Transportation (~$3,000-$4,000/month value)

Program of All-Inclusive Care for the Elderly (PACE)

Ohio PACE (e.g., McGregor PACE)

Age 55+
General OH resident (specific counties), NFLOC, safe with PACE support.
Income Limits (2025) ~$2,829/month (Medicaid-eligible); private pay option available.
Asset Limits $2,000 (individual), $3,000 (couple) for Medicaid enrollees.
OH

Available in 9 counties (e.g., Cuyahoga, Franklin); expanding via Healthy Aging Grants.

Benefits
Personal care (5-7 hours/day) Medical care Meals Transportation Respite Therapies

Medicare Savings Program (MSP)

Ohio Medicare Savings Program

Age 65+ or disabled
General OH resident, Medicare Part A/B.
Income Limits (2025) ~$2,510/month (QMB), ~$3,380/month (SLMB), ~$3,598/month (QI)—individual.
Asset Limits $9,430 (individual), $14,130 (couple).
OH

Three tiers; includes Extra Help for Part D; no waitlist.

Benefits
Covers Part B premiums ($174.70/month) Deductibles ($240/year) Copays (~20%)

Home Energy Assistance Program (HEAP)

Ohio HEAP

Age 60+ prioritized
General OH resident, low-income household.
Income Limits (2025) ~$3,970/month individual, 185% FPL
Asset Limits Not assessed; income-focused.
OH

Covers gas, electric, oil; emergency aid via Winter/Summer Crisis Programs.

Benefits
Heating/cooling aid ($300-$1,000/season) Emergency aid ($500 max)

Family Caregiver Support Program (FCSP)

Ohio Family Caregiver Support Program

Age
General Caregivers of 60+ needing care or 55+ caregivers of others; OH resident; functional needs (2+ ADLs).
Income Limits (2025) Prioritizes ~$24,980/year (individual); no strict cap.
Asset Limits Not assessed; need-based.
OH

12 AAAs; rural/low-income priority; volunteer respite option.

Benefits
Respite (4-6 hours/week or 5 days/year) Adult day care ($60/day) Training Supplies (~$500/year)

Senior Community Service Employment Program (SCSEP)

Ohio SCSEP

Age 55+
General unemployed, low-income, OH resident.
Income Limits (2025) ~$1,983/month 125% FPL
Asset Limits Not specified; income-focused.
OH

Priority for veterans, rural residents; AARP partnership.

Benefits
Paid training (~20 hours/week at ~$7.25/hour) Job placement

VA Aid and Attendance (A&A) and Housebound Benefits

Ohio VA Aid and Attendance/Housebound

Age 65+ or disabled veteran/spouse
General OH resident, wartime service, need for ADL help (A&A) or homebound.
Income Limits (2025) Net income < ~$1,984/month (veteran with dependent, A&A); pension offsets income.
Asset Limits ~$155,356 net worth limit
OH

High veteran demand; supports care in multiple settings.

Benefits
Cash (~$1,433-$2,642/month veteran, ~$951-$1,318 spouse) for care costs (e.g., in-home, assisted living)

Homestead Exemption

Ohio Homestead Exemption

Age 65+ (or disabled)
General OH resident, homeowner, low-income.
Income Limits (2025) ~$38,500/year individual, adjusted annually
Asset Limits Not assessed; home ownership required.
OH

Reduces taxable value by $25,000; applies to primary residence.

Benefits
Tax reduction (~$400-$800/year avg., varies by county)

Save the Dream Ohio (Homeowner Assistance Fund)

Ohio Save the Dream

Age 60+ prioritized
General OH resident, homeowner, hardship post-Jan 21, 2020.
Income Limits (2025) ~$147,600/year family of 4, 150% AMI; varies by county
Asset Limits Not assessed; hardship-focused.
OH

Covers delinquent mortgages, utilities, taxes; max $25,000 mortgage aid.

Benefits
Mortgage aid ($25,000 max) Utility/property tax aid ($5,000 avg.)

Places of interest near Monterey Health & Rehabilitation Center

Address 1.6 miles from city center Info Estimated distance in miles from Grove City's city center to Monterey Health & Rehabilitation Center's address, calculated via Google Maps. — 0.72 miles to nearest hospital (OhioHealth Neighborhood Care)

Calculate Travel Distance to Monterey Health & Rehabilitation Center

Add your location

Address

Staffing Data (Q2 2025)

This data corresponds to Q2 2025 and is based on CMS Payroll-Based Journal.

Total staff 305
Employees 128
Contractors 177
Staff to resident ratio 2.82:1
32% better than Ohio average

Ohio average ratio: 2.14:1

Avg staff/day 55
Average shift 8.5 hours
5% better than Ohio average

Ohio average: 8.1 hours

Total staff hours (quarter) 42,375
Nursing staff breakdown
Registered Nurse

Manages medical care and health needs.

Total count 72
Average shift length Info Average shift length. Calculated as total hours divided by days worked and average staff per day. 8.6 hours

This role is partially covered by contractors.

Licensed Practical Nurse

Assists with medical care and medications.

Total count 67
Average shift length Info Average shift length. Calculated as total hours divided by days worked and average staff per day. 9.5 hours

This role is partially covered by contractors.

Certified Nursing Assistant

Helps with daily care and mobility.

Total count 112
Average shift length Info Average shift length. Calculated as total hours divided by days worked and average staff per day. 8.9 hours

This role is partially covered by contractors.

Contractor staffing

Total hours from contractors

16.4%

6,937 contractor hours this quarter

Registered Nurse: 60 Licensed Practical Nurse: 42 Certified Nursing Assistant: 41 Qualified Social Worker: 8 Physical Therapy Aide: 8 Physical Therapy Assistant: 7 Speech Language Pathologist: 7 Respiratory Therapy Technician: 4
Staff by category
Certified Nursing Assistant714111221,08991100%8.9
Licensed Practical Nurse2542677,08891100%9.5
Registered Nurse1260726,55191100%8.6
Speech Language Pathologist0771,0026875%6.2
Other Dietary Services Staff4047987785%7.2
Clinical Nurse Specialist3037456976%8.6
Physical Therapy Aide0886846673%5.1
Mental Health Service Worker2025135763%7.4
Dietitian1015126470%8
Physical Therapy Assistant0774756673%5.1
Administrator1014725965%8
RN Director of Nursing1014695965%7.9
Dental Services Staff6064655864%6.1
Nurse Practitioner1014405560%8
Occupational Therapy Aide1013844853%8
Respiratory Therapy Technician0443476976%4.4
Qualified Social Worker0883426774%4.9
112 Certified Nursing Assistant
% of Days 100%
67 Licensed Practical Nurse
% of Days 100%
72 Registered Nurse
% of Days 100%
7 Speech Language Pathologist
% of Days 75%
4 Other Dietary Services Staff
% of Days 85%
3 Clinical Nurse Specialist
% of Days 76%
8 Physical Therapy Aide
% of Days 73%
2 Mental Health Service Worker
% of Days 63%
1 Dietitian
% of Days 70%
7 Physical Therapy Assistant
% of Days 73%
1 Administrator
% of Days 65%
1 RN Director of Nursing
% of Days 65%
6 Dental Services Staff
% of Days 64%
1 Nurse Practitioner
% of Days 60%
1 Occupational Therapy Aide
% of Days 53%
4 Respiratory Therapy Technician
% of Days 76%
8 Qualified Social Worker
% of Days 74%

Facility Characteristics

Source: CMS Long-Term Care Facility Characteristics (Data as of Jan 2026)

Total residents 108
Medicare
10
9.3% of residents
Medicaid
89
82.4% of residents
Private pay or other
9
8.3% of residents
Programs & Services
Residents Group

Residents meet regularly to discuss policies, care quality, and activities

Active Resident Council

Organized group of residents that meets regularly to discuss facility policies, quality of life, and activities.

Quality of care over time

These measures show how residents usually do over time at this home, based on health outcomes and preventive care.

High-risk clinical events score Info A composite score based on pressure ulcers, falls with injury, weight loss, walking ability decline, and activities of daily living decline. 5.9
In line with Ohio average

Ohio average: 5.8

Functional decline score Info A composite score based on activities of daily living decline, walking ability decline, and incontinence. 9.3
26% better than Ohio average

Ohio average: 12.7

Long-stay resident measures
Need for Help with Daily Activities Increased Info Percent of long-stay residents whose need for help with daily activities has increased 1.9%
72% better than Ohio average

Ohio average: 6.8%

Walking Ability Worsened Info Percent of long-stay residents whose ability to move independently worsened 3.8%
57% better than Ohio average

Ohio average: 8.9%

Low Risk Residents with Bowel/Bladder Incontinence Info Percent of low risk long-stay residents who lose control of their bowels or bladder 22.2%
In line with Ohio average

Ohio average: 22.0%

Falls with Major Injury Info Percent of long-stay residents experiencing one or more falls with major injury 5.0%
46% worse than Ohio average

Ohio average: 3.4%

High Risk Residents with Pressure Ulcers Info Percent of long-stay high risk residents with pressure ulcers 13.0%
234% worse than Ohio average

Ohio average: 3.9%

Urinary Tract Infection Info Percent of long-stay residents with a urinary tract infection 0.5%
In line with Ohio average

Ohio average: 0.5%

Lost Too Much Weight Info Percent of long-stay residents who lose too much weight 5.7%
8% better than Ohio average

Ohio average: 6.2%

Depressive Symptoms Info Percent of long-stay residents who have depressive symptoms 45.0%
87% worse than Ohio average

Ohio average: 24.0%

Antipsychotic Use Info Percent of long-stay residents who received an antipsychotic medication 7.4%
12% better than Ohio average

Ohio average: 8.4%

Pneumococcal Vaccine Info Percent of long-stay residents assessed and appropriately given the pneumococcal vaccine 100.0%
8% better than Ohio average

Ohio average: 92.4%

Influenza Vaccine Info Percent of long-stay residents assessed and appropriately given the seasonal influenza vaccine 100.0%
6% better than Ohio average

Ohio average: 94.5%

Short-stay resident measures
Pneumococcal Vaccine Info Percent of short-stay residents assessed and appropriately given the pneumococcal vaccine 96.5%
24% better than Ohio average

Ohio average: 78.0%

Antipsychotic medication increase Info Percent of short-stay residents who newly received an antipsychotic medication 0.0%
100% better than Ohio average

Ohio average: 1.3%

Influenza Vaccine Info Percent of short-stay residents assessed and appropriately given the seasonal influenza vaccine 91.3%
21% better than Ohio average

Ohio average: 75.6%

Penalties and fines

Federal penalties imposed by CMS for regulatory violations, including civil money penalties (fines) and denials of payment for new Medicare/Medicaid admissions.

Source: CMS Penalties Database (Data as of Jan 2026)

Total fines amount $3K
95% lower than Ohio average

Ohio average: $69K

Number of fines 1
46% fewer fines than Ohio average

Ohio average: 1.9

Payment Denials Info Serious action where Medicare and/or Medicaid temporarily stops payments for new residents until issues are fixed. 0
100% fewer payment denials than Ohio average

Ohio average: 0.5

Fines amount comparison
This facility $3K
Ohio average $69K
Penalty History

Penalties are imposed by CMS for violations of federal nursing home regulations.

No penalties in the past 3 years

No civil money penalties or payment denials were reported in the last 3 years.

Compare Assisted Living around Grove City The information below is reported by the Ohio Department of Health, Bureau of Survey and Certification.

Filter by care type
Monterey Health & Rehabilitation Center
AL

Assisted Living A licensed, long-term care setting for seniors or individuals with disabilities who need help with daily activities — like bathing, dressing, and medication management — but not 24-hour skilled nursing. Offers housing, meals, and around-the-clock support while aiming to maximize resident independence.

HC

Home Care Professional care delivered in the person's own home — from companionship and errands to skilled nursing and therapy. Allows seniors to age in place. Medicare covers skilled home health when medically necessary.

NH

Nursing Home Licensed facility providing 24/7 skilled nursing care for residents with complex, ongoing medical needs. Staffed by RNs, LPNs, and CNAs. Inspected and star-rated annually by CMS. Accepts Medicare (short-term rehab) and Medicaid (long-term care).

Grove City (Hoover Road)155Yes 65 Private Rooms---0
Carriage Court of Grove City
AL

Assisted Living A licensed, long-term care setting for seniors or individuals with disabilities who need help with daily activities — like bathing, dressing, and medication management — but not 24-hour skilled nursing. Offers housing, meals, and around-the-clock support while aiming to maximize resident independence.

Grove City57Yes 49 Private RoomsA+-871
Brookdale Pinnacle
AL

Assisted Living A licensed, long-term care setting for seniors or individuals with disabilities who need help with daily activities — like bathing, dressing, and medication management — but not 24-hour skilled nursing. Offers housing, meals, and around-the-clock support while aiming to maximize resident independence.

MC

Memory Care Secured, specialized care for people living with Alzheimer's or dementia. Staff trained in cognitive impairment, with higher staff-to-resident ratios and an environment designed to reduce confusion and wandering risk.

Grove City-No 28 Private Rooms--960
Grove City Senior Living
AL

Assisted Living A licensed, long-term care setting for seniors or individuals with disabilities who need help with daily activities — like bathing, dressing, and medication management — but not 24-hour skilled nursing. Offers housing, meals, and around-the-clock support while aiming to maximize resident independence.

IL

Independent Living Lifestyle-focused communities for older adults offering dining, activities, and transportation with minimal personal care. Best for active, independent seniors who want community without medical support.

MC

Memory Care Secured, specialized care for people living with Alzheimer's or dementia. Staff trained in cognitive impairment, with higher staff-to-resident ratios and an environment designed to reduce confusion and wandering risk.

Grove City (Jackson Township)-Yes 22 Private Rooms---0
Hoover Haus
AL

Assisted Living A licensed, long-term care setting for seniors or individuals with disabilities who need help with daily activities — like bathing, dressing, and medication management — but not 24-hour skilled nursing. Offers housing, meals, and around-the-clock support while aiming to maximize resident independence.

Grove City (Brook Park)-Yes 50 Private RoomsA-Quinten Smith8111

Guides for Better Senior Living

Care Cost Calculator: See Prices in Your Area

Nursing Home Data Explorer

Don’t Wait Too Long: 7 Red Flag Signs Your Parent Needs Assisted Living Now

The True Cost of Assisted Living in 2025 – And How Families Are Paying For It

Understanding Senior Living Costs: Pricing Models, Discounts & Financial Assistance

Explore Open Rooms
1 Contact details
2 What type of senior care service are you looking for?
3 What budget do you have in mind for senior care?
4 How soon do you need to find care?
5 Additional details

Thank you for your interest!

Our team will be in touch shortly to help with next steps.