Explore Open Rooms

1 Contact details
2 What type of senior care service are you looking for?
3 What budget do you have in mind for senior care?
4 How soon do you need to find care?
5 Additional details

Thank you for your interest!

Our team will be in touch shortly to help with next steps.

Nursing Home

Medilodge of Ludington

Nursing Home

Medilodge of Ludington

1000 E Tinkham Ave, Ludington, MI 49431 View map
Overview of Medilodge of Ludington

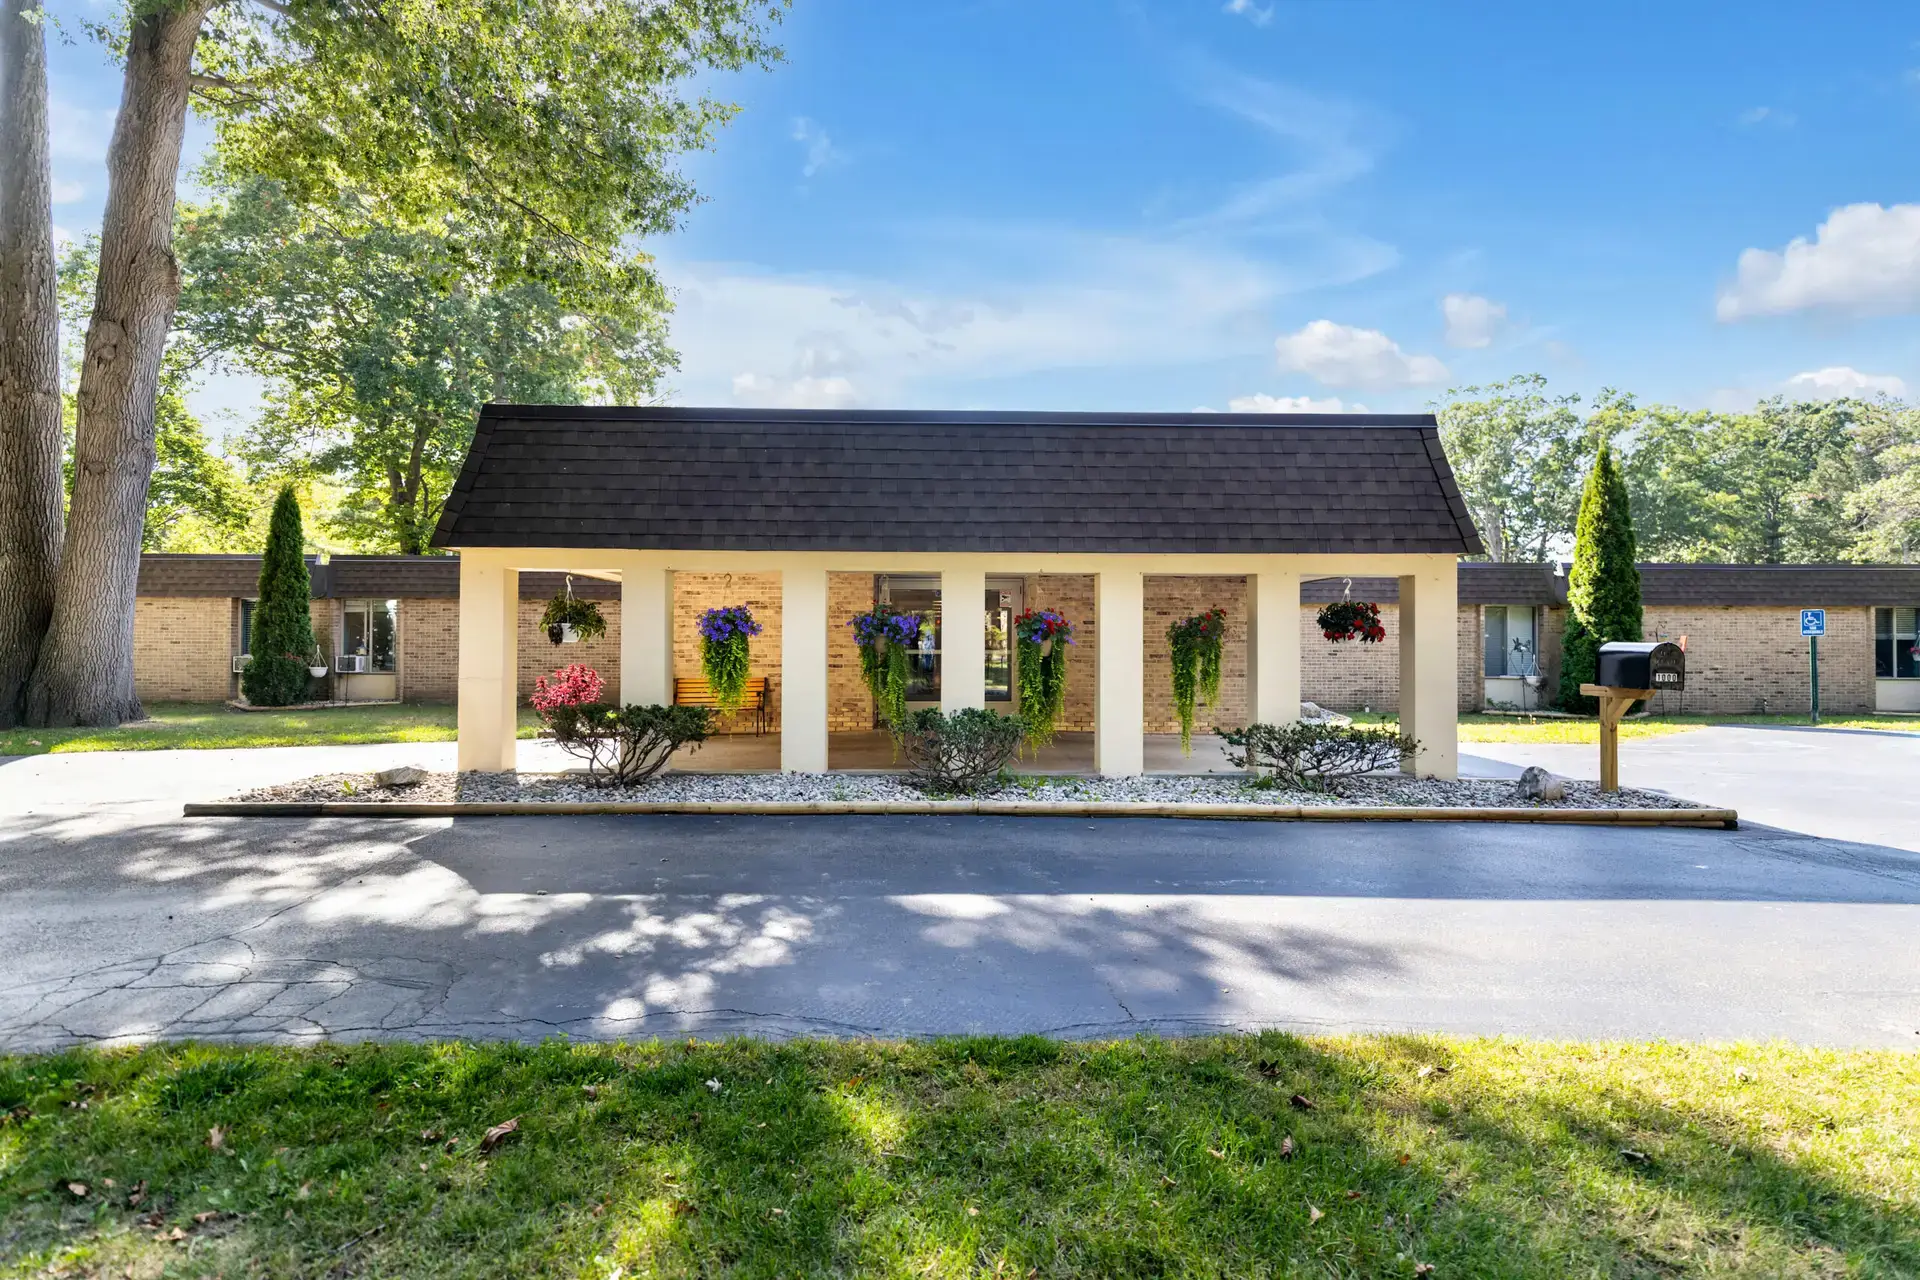
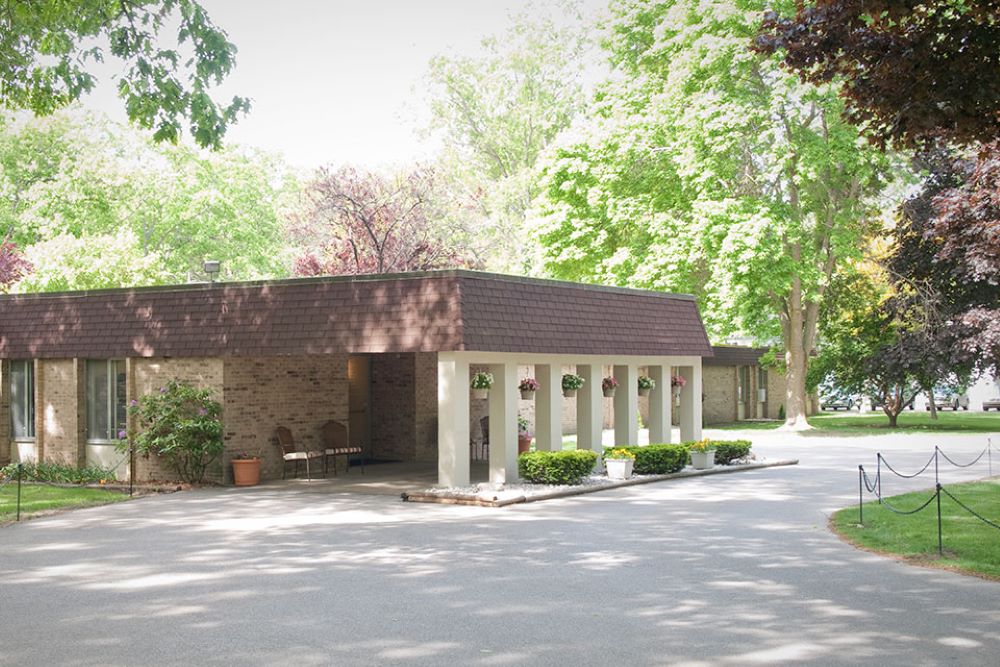
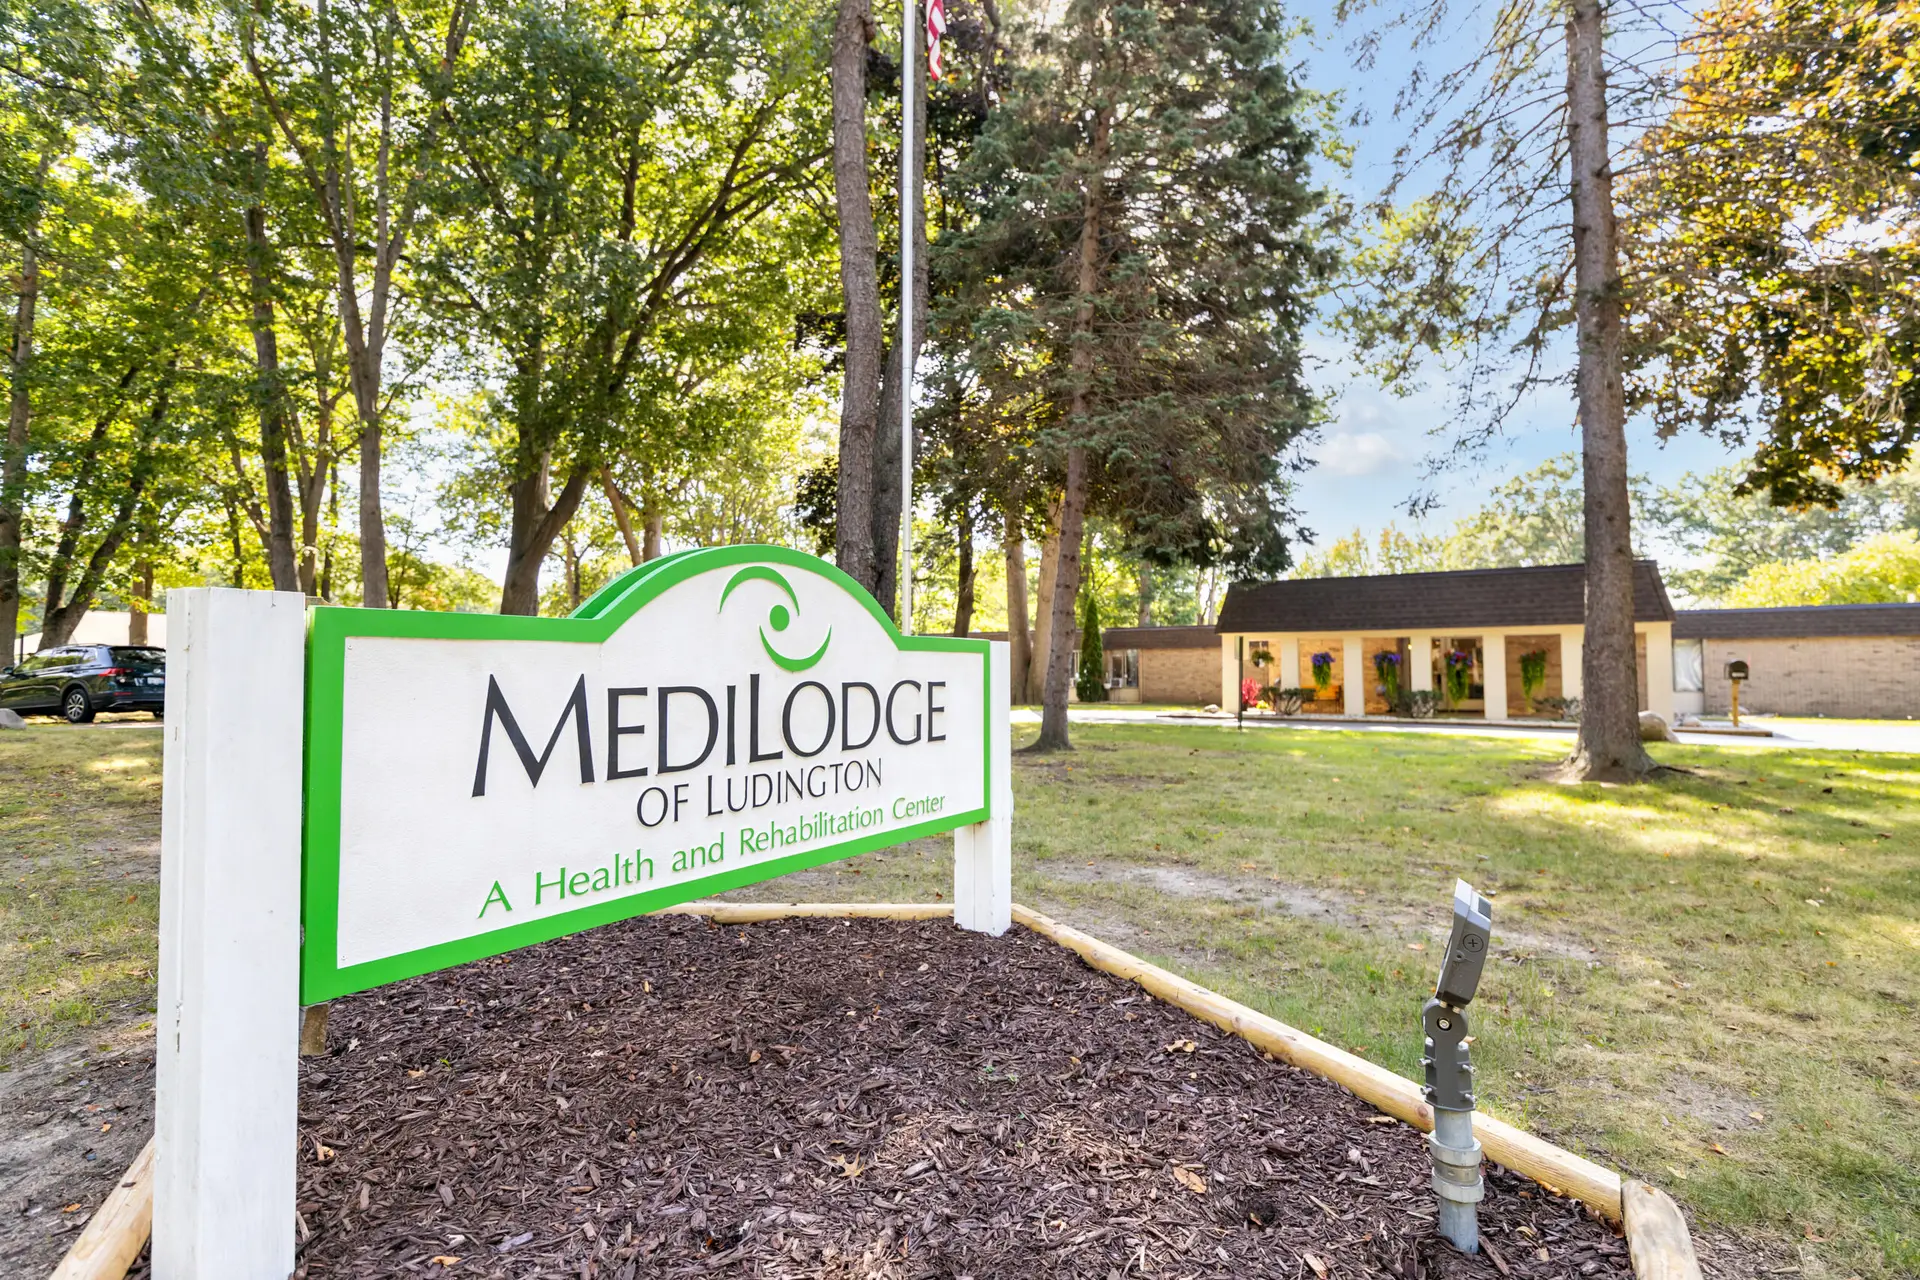
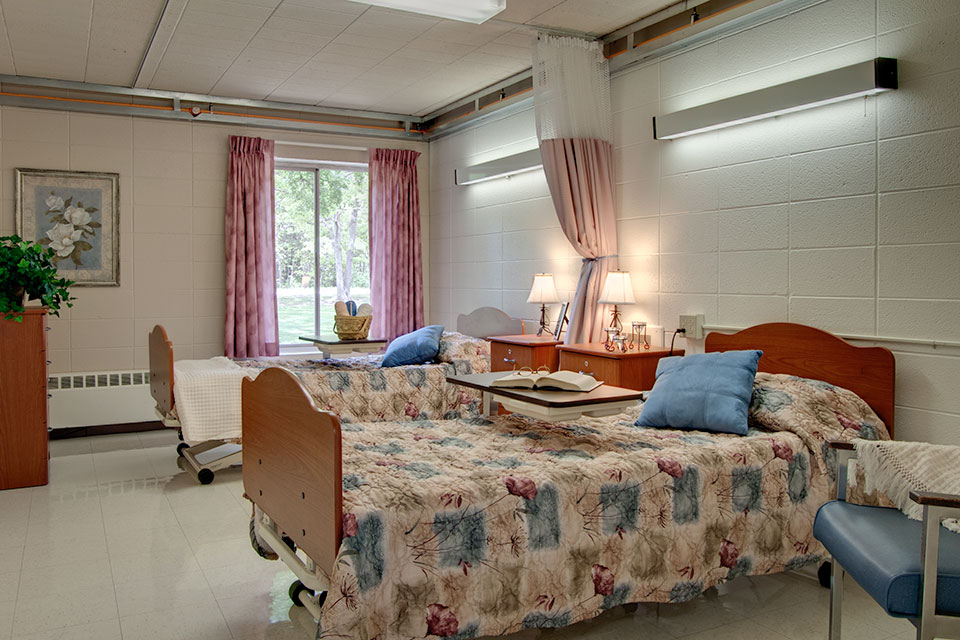
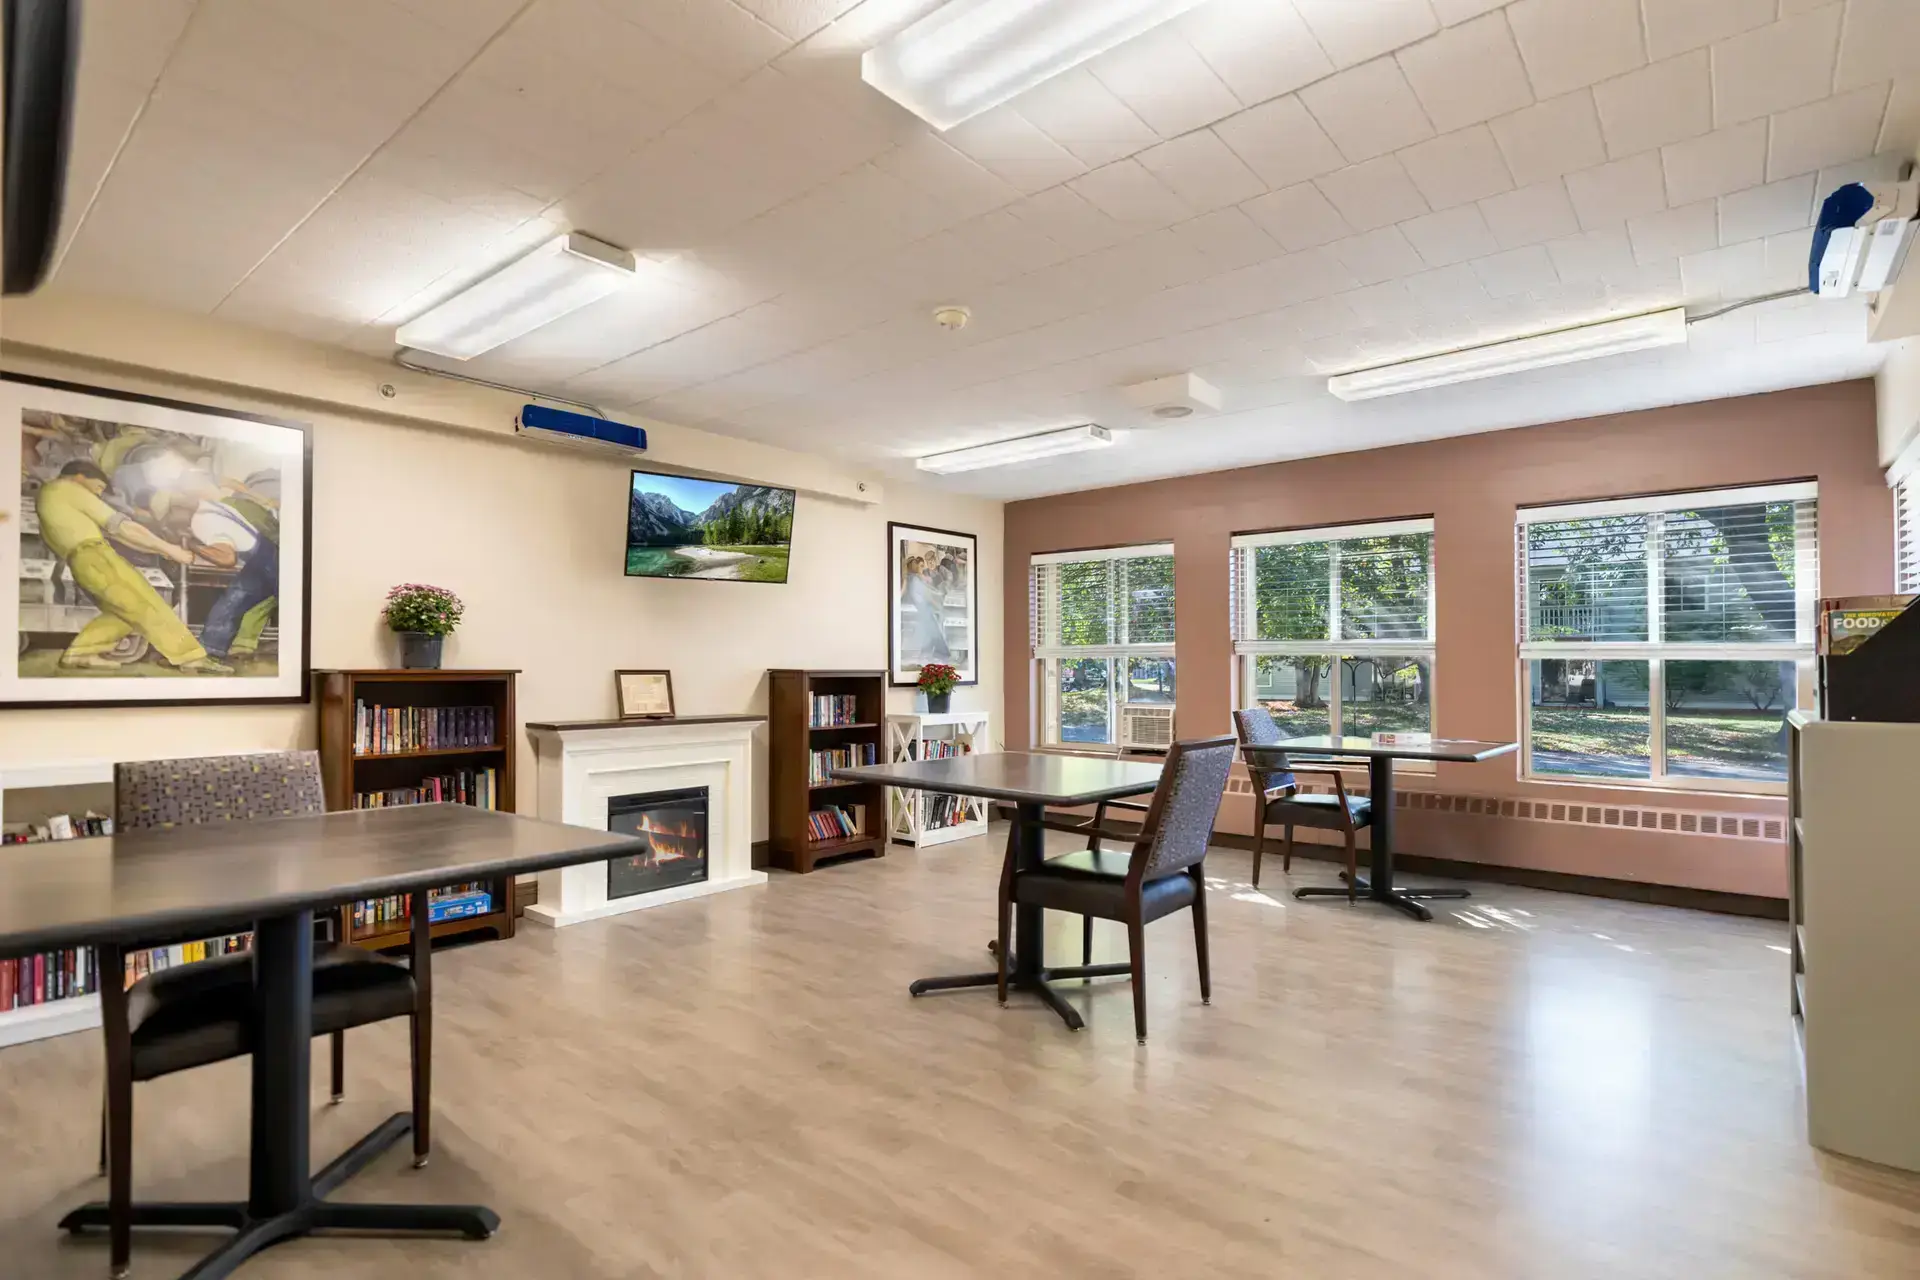
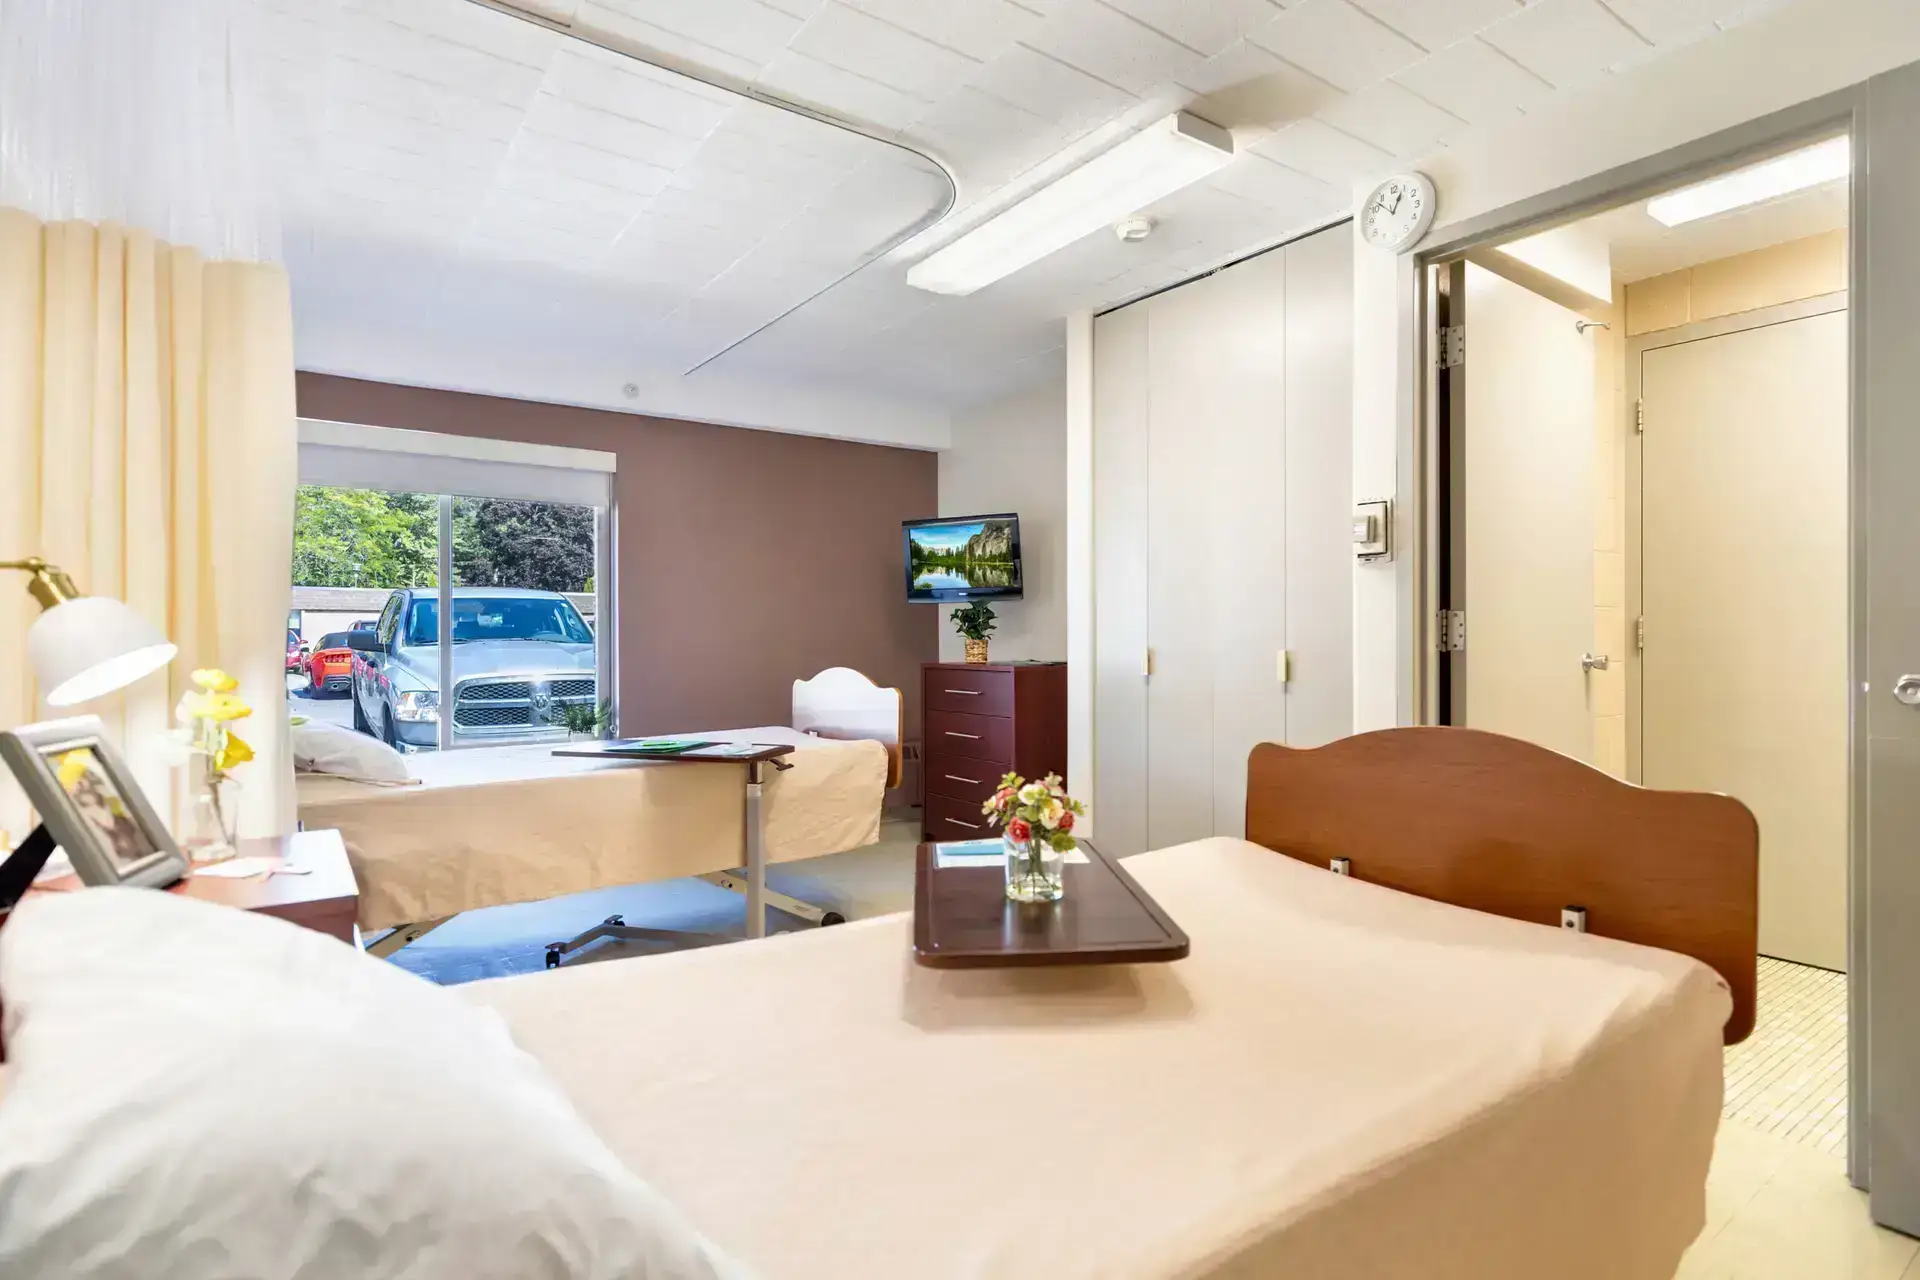
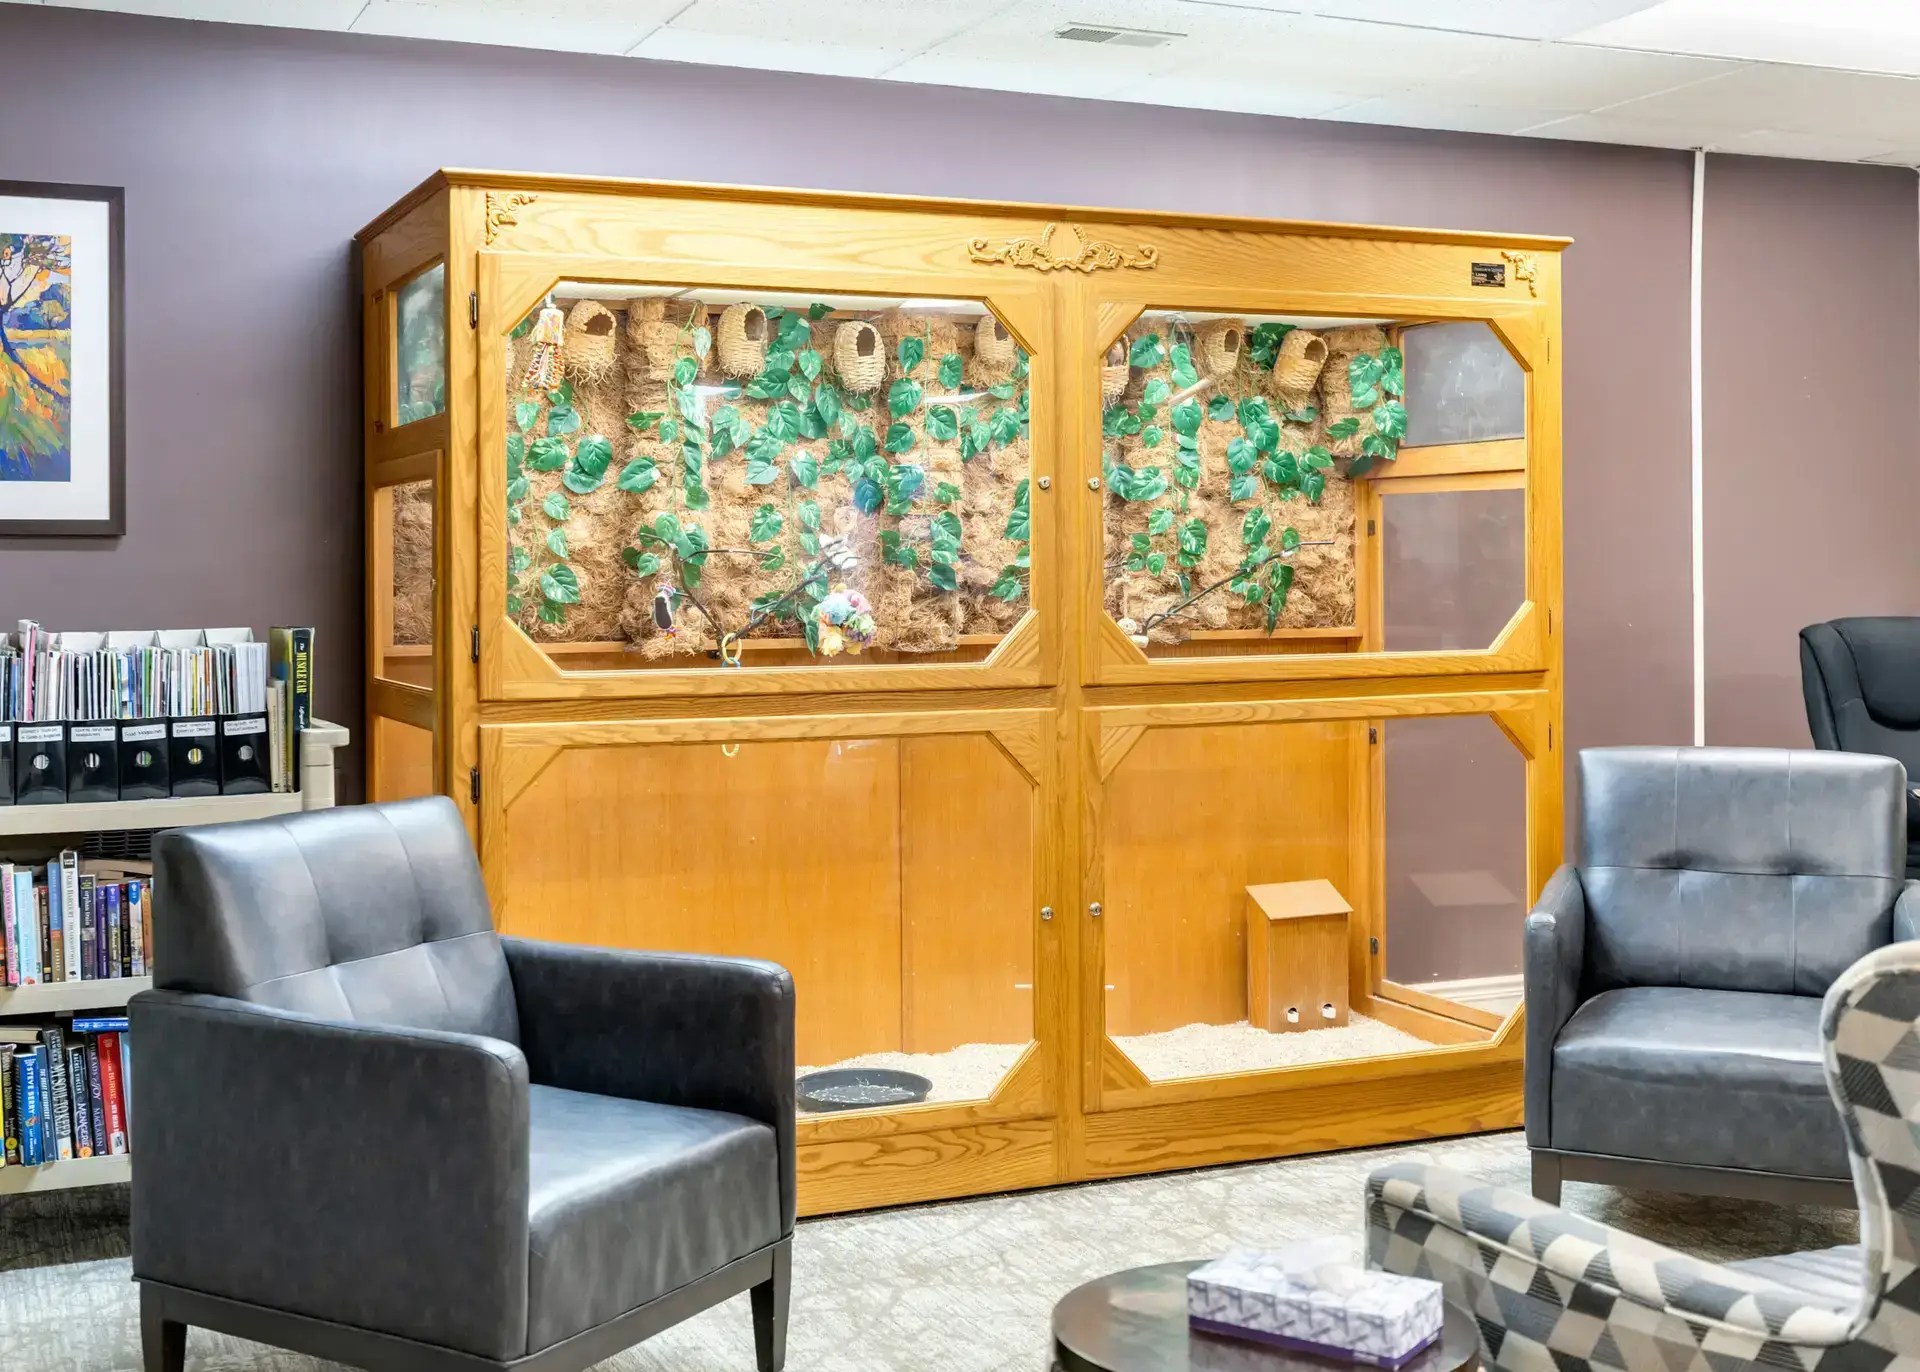
Set in the idyllic neighborhood of East Tinkham Avenue, Ludington, MI, is the distinguished senior living community of Medilodge of Ludington that focuses on long-term care and short-term rehabilitation services. With its comprehensive care services, the community ensures seniors can easily find the care and assistance they need and prefer without hassles. Moreover, families keep their peace of mind knowing a kind and reliable team handles their daily living activities 24/7.

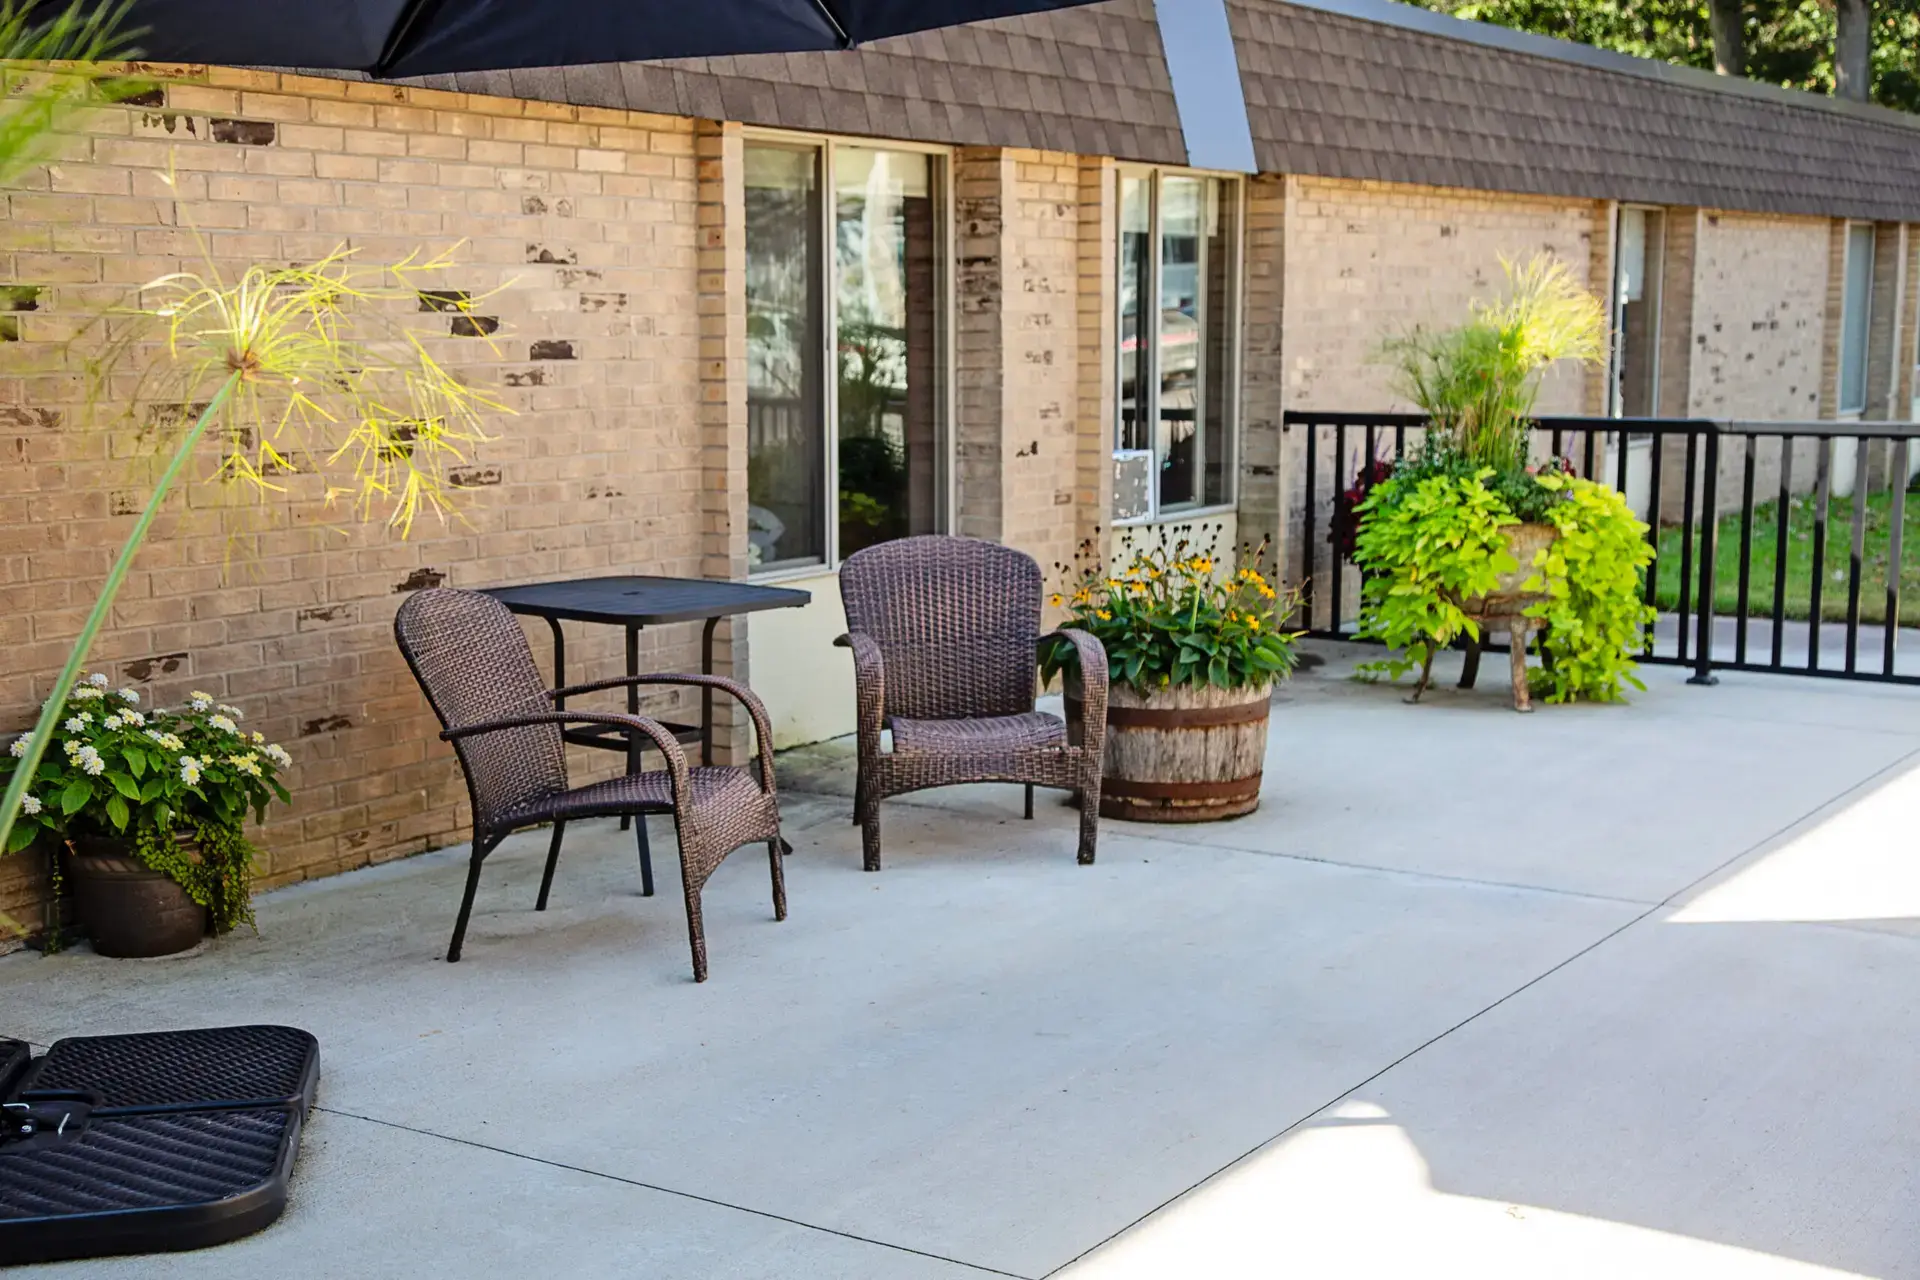
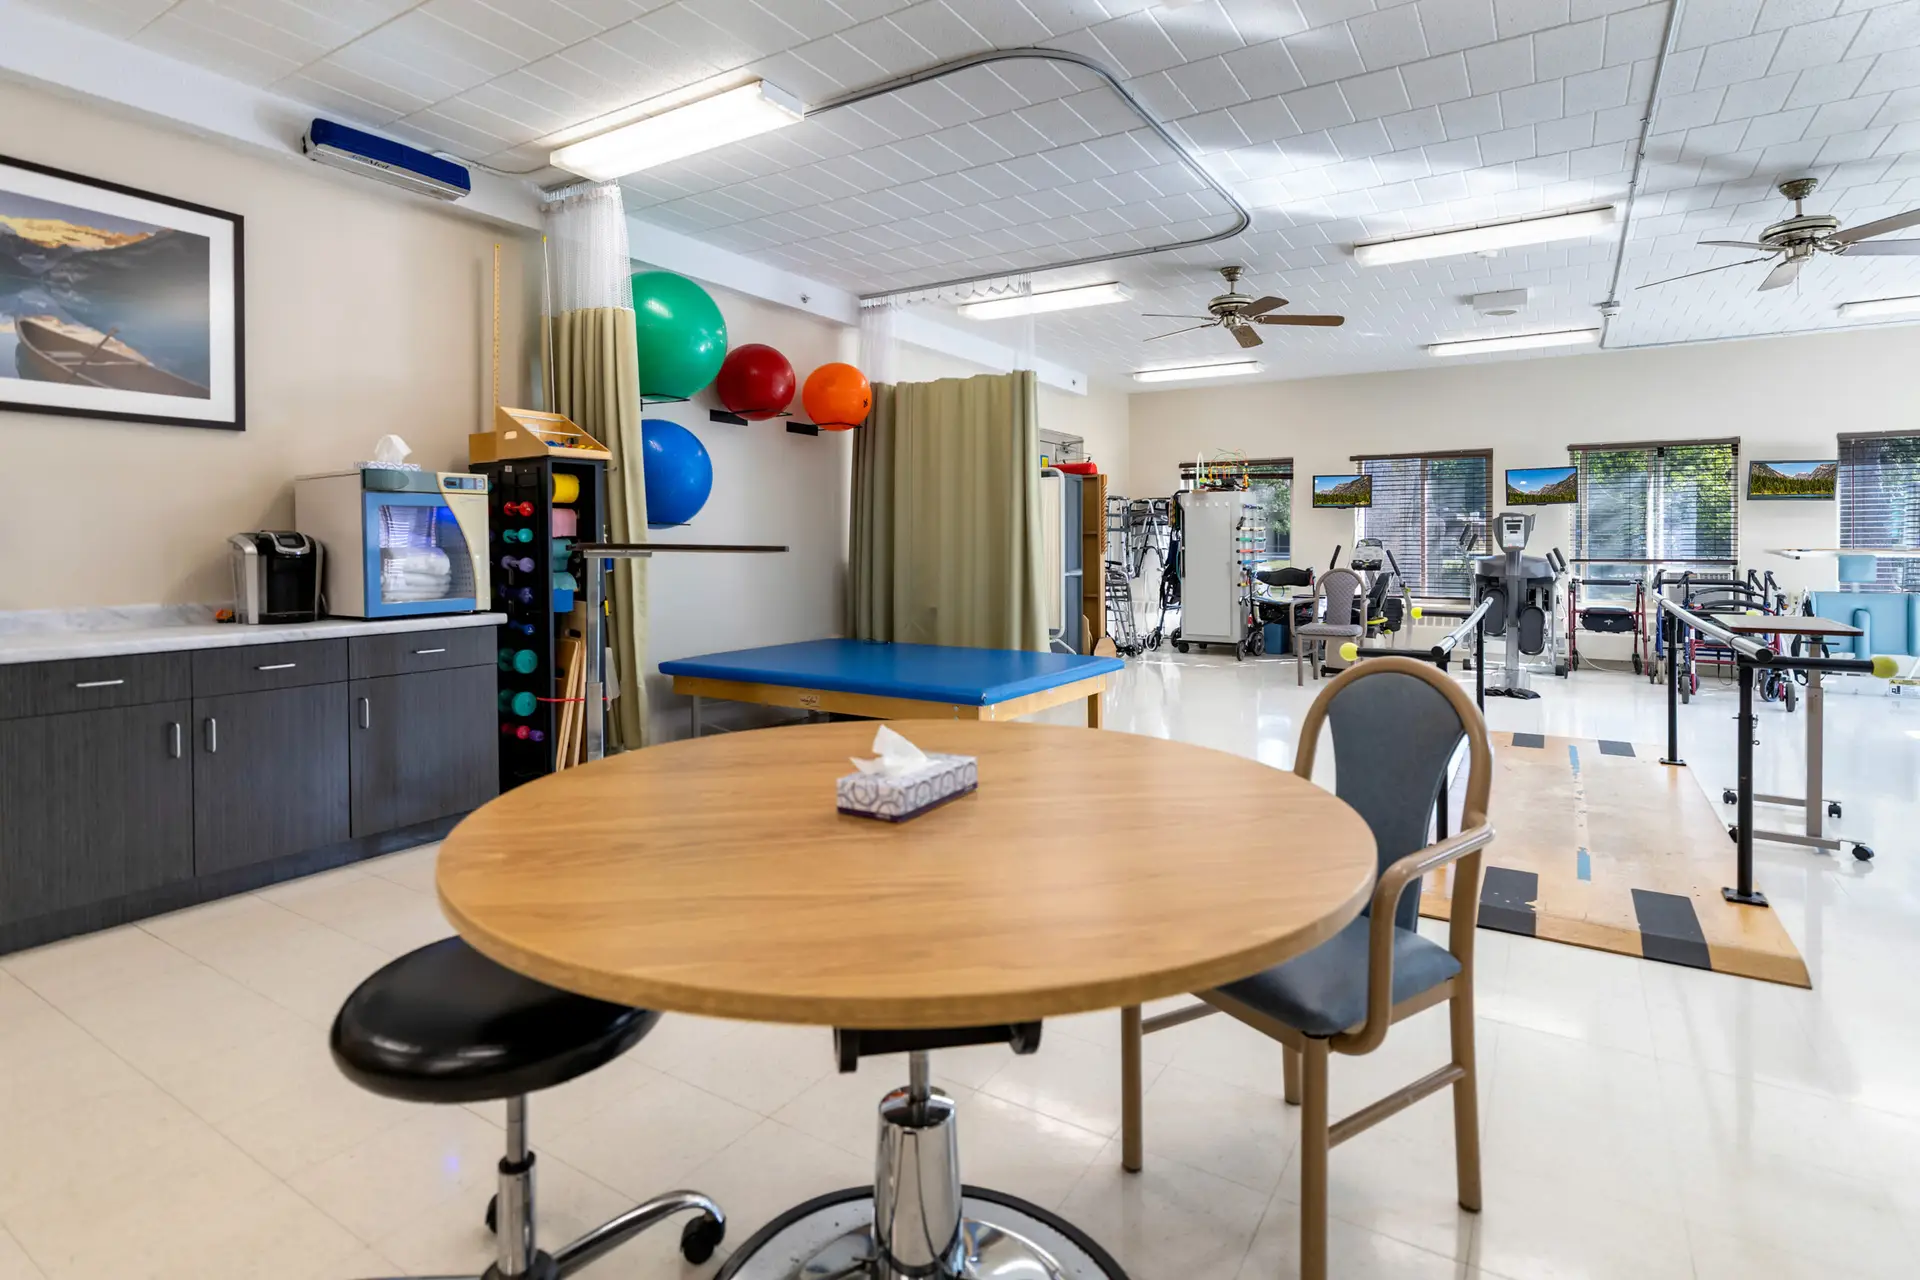
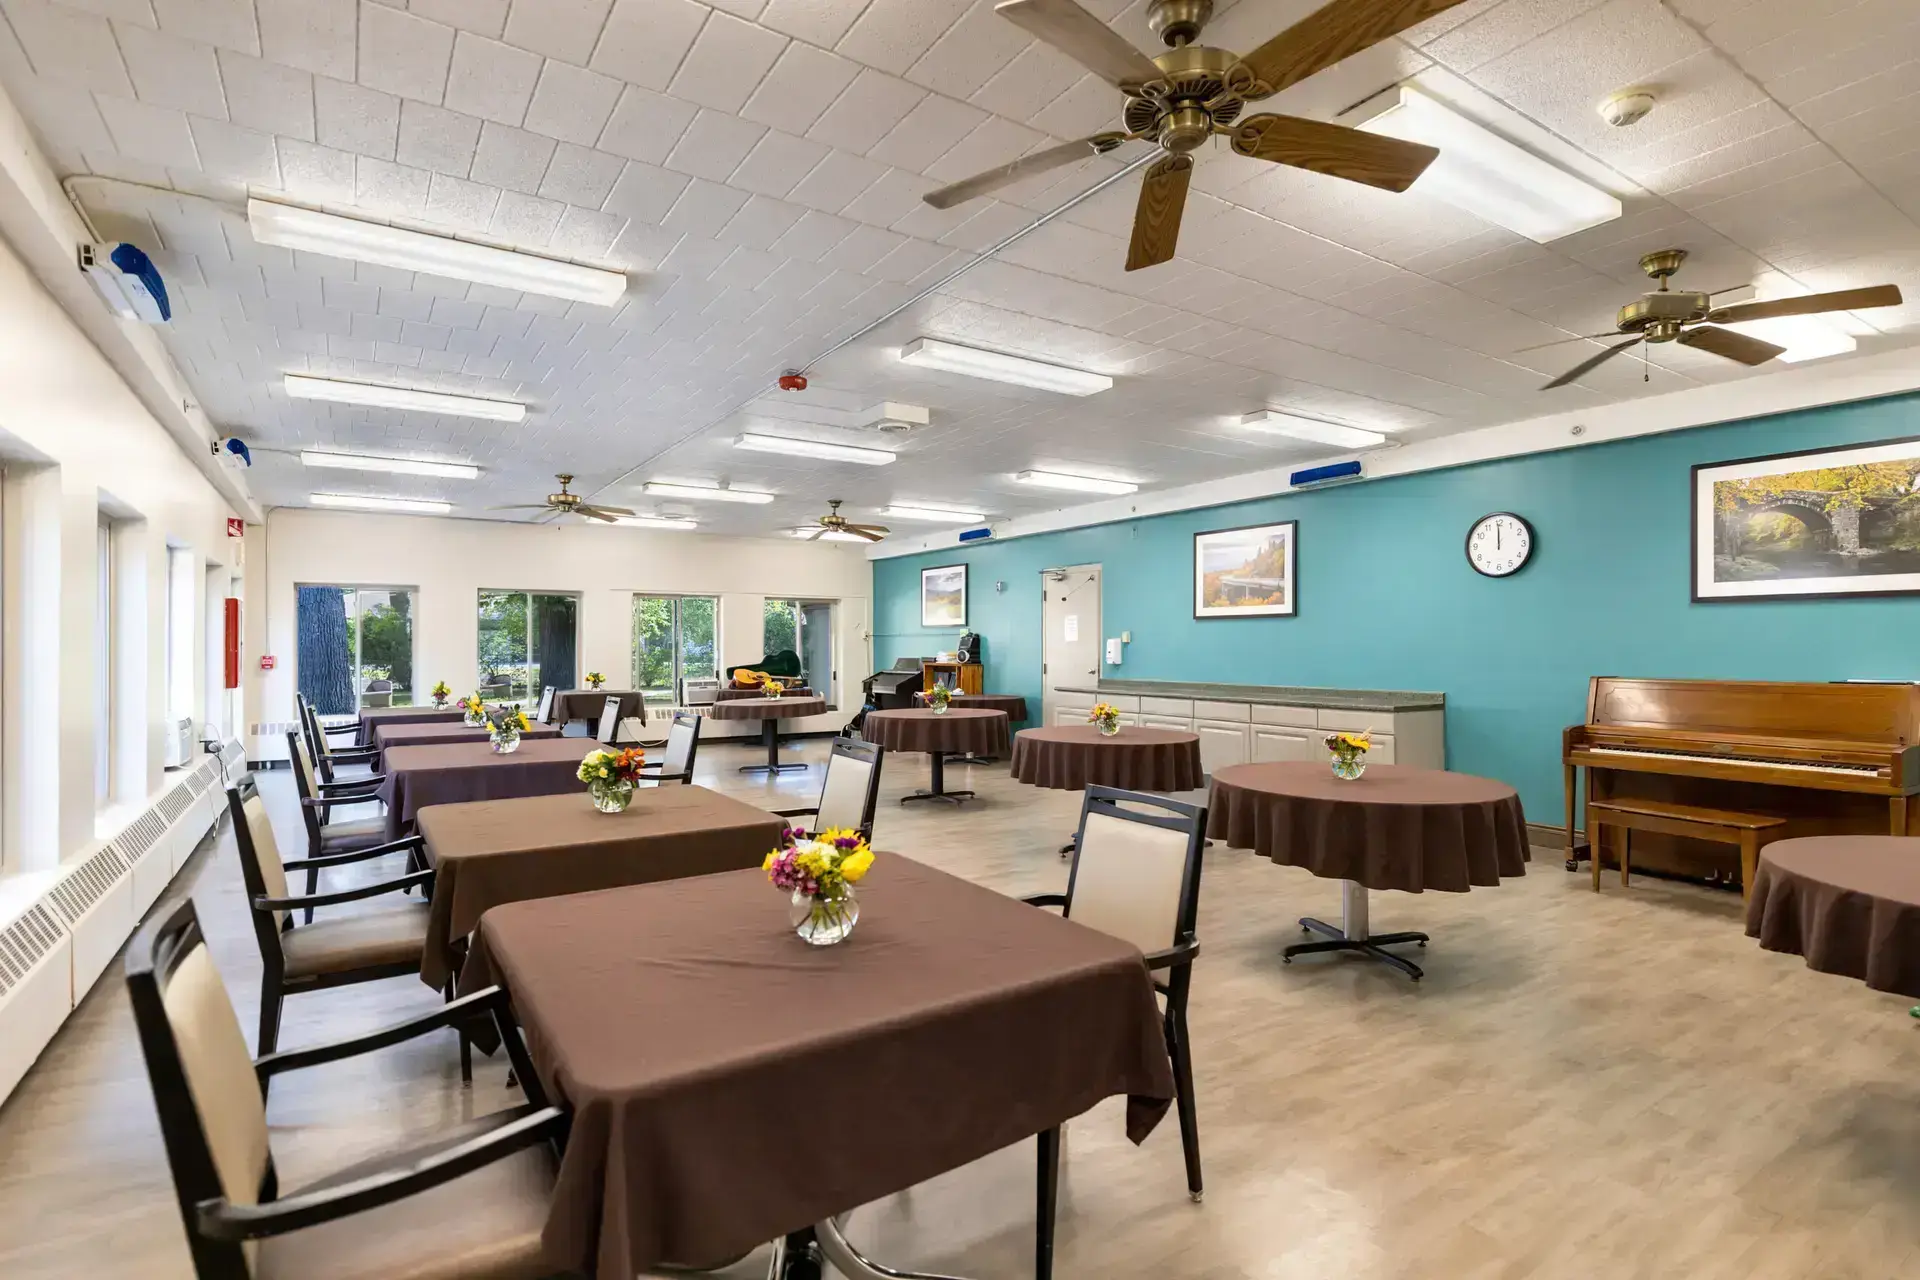
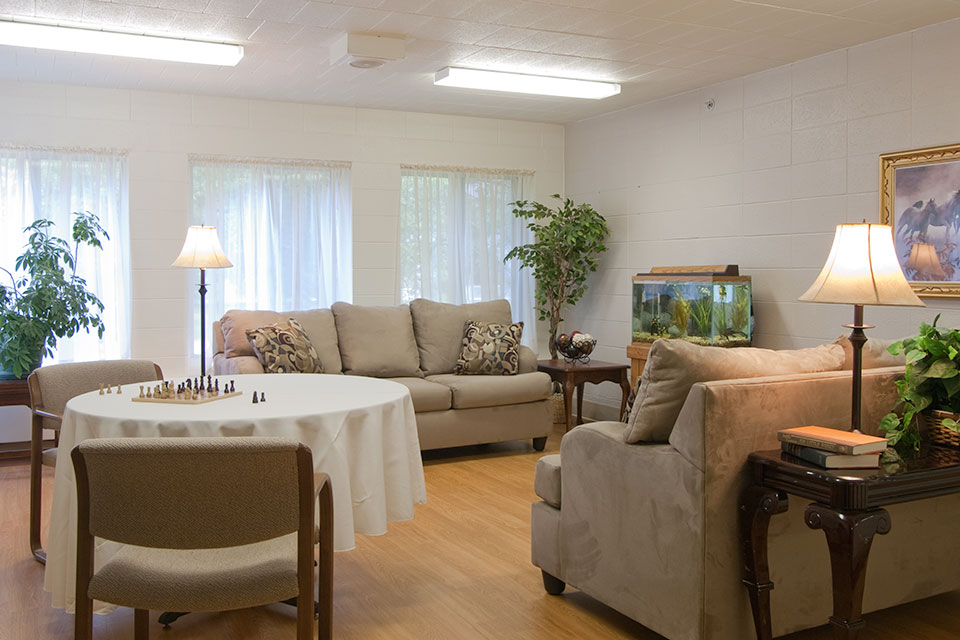
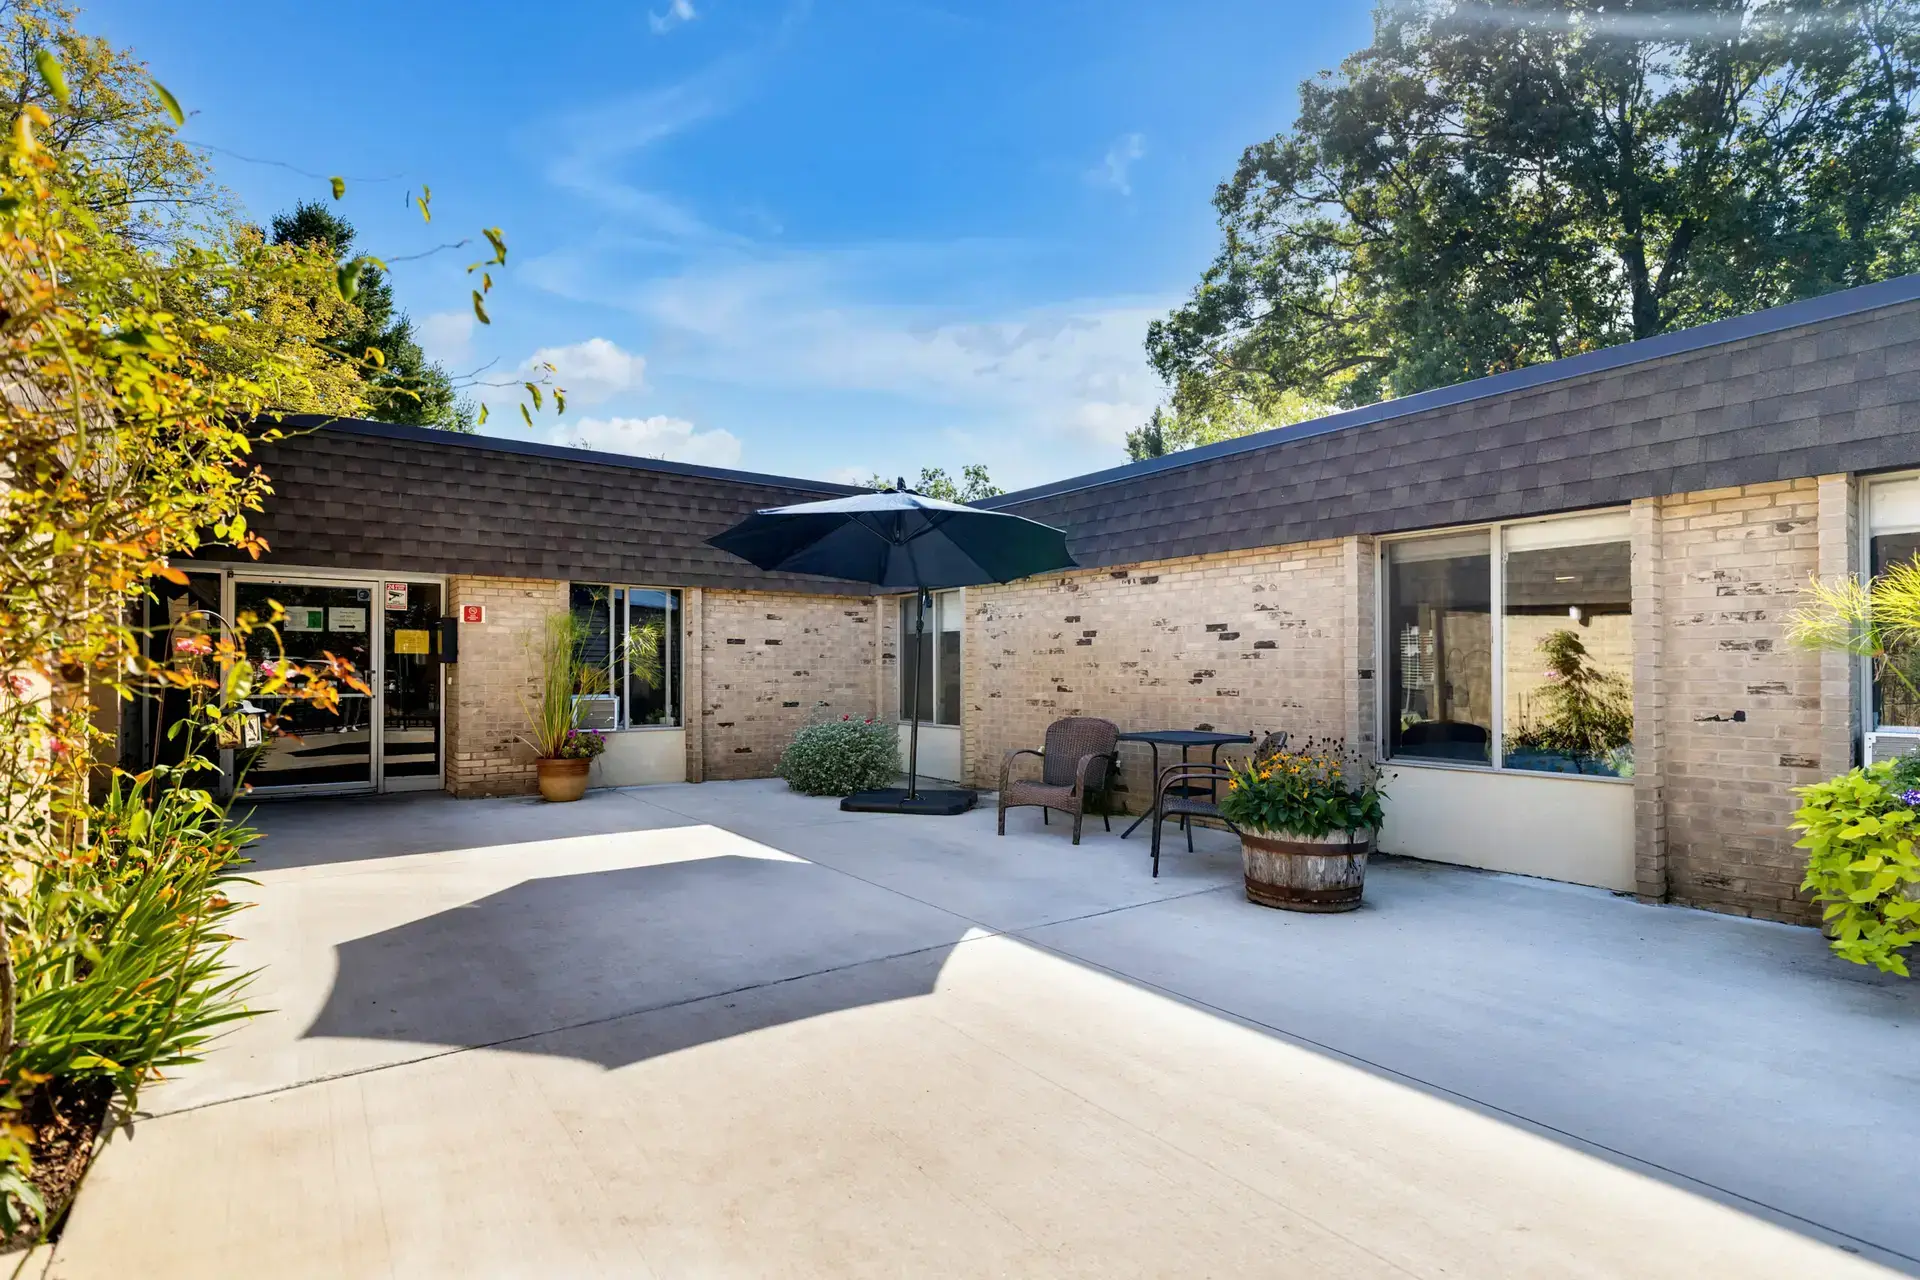
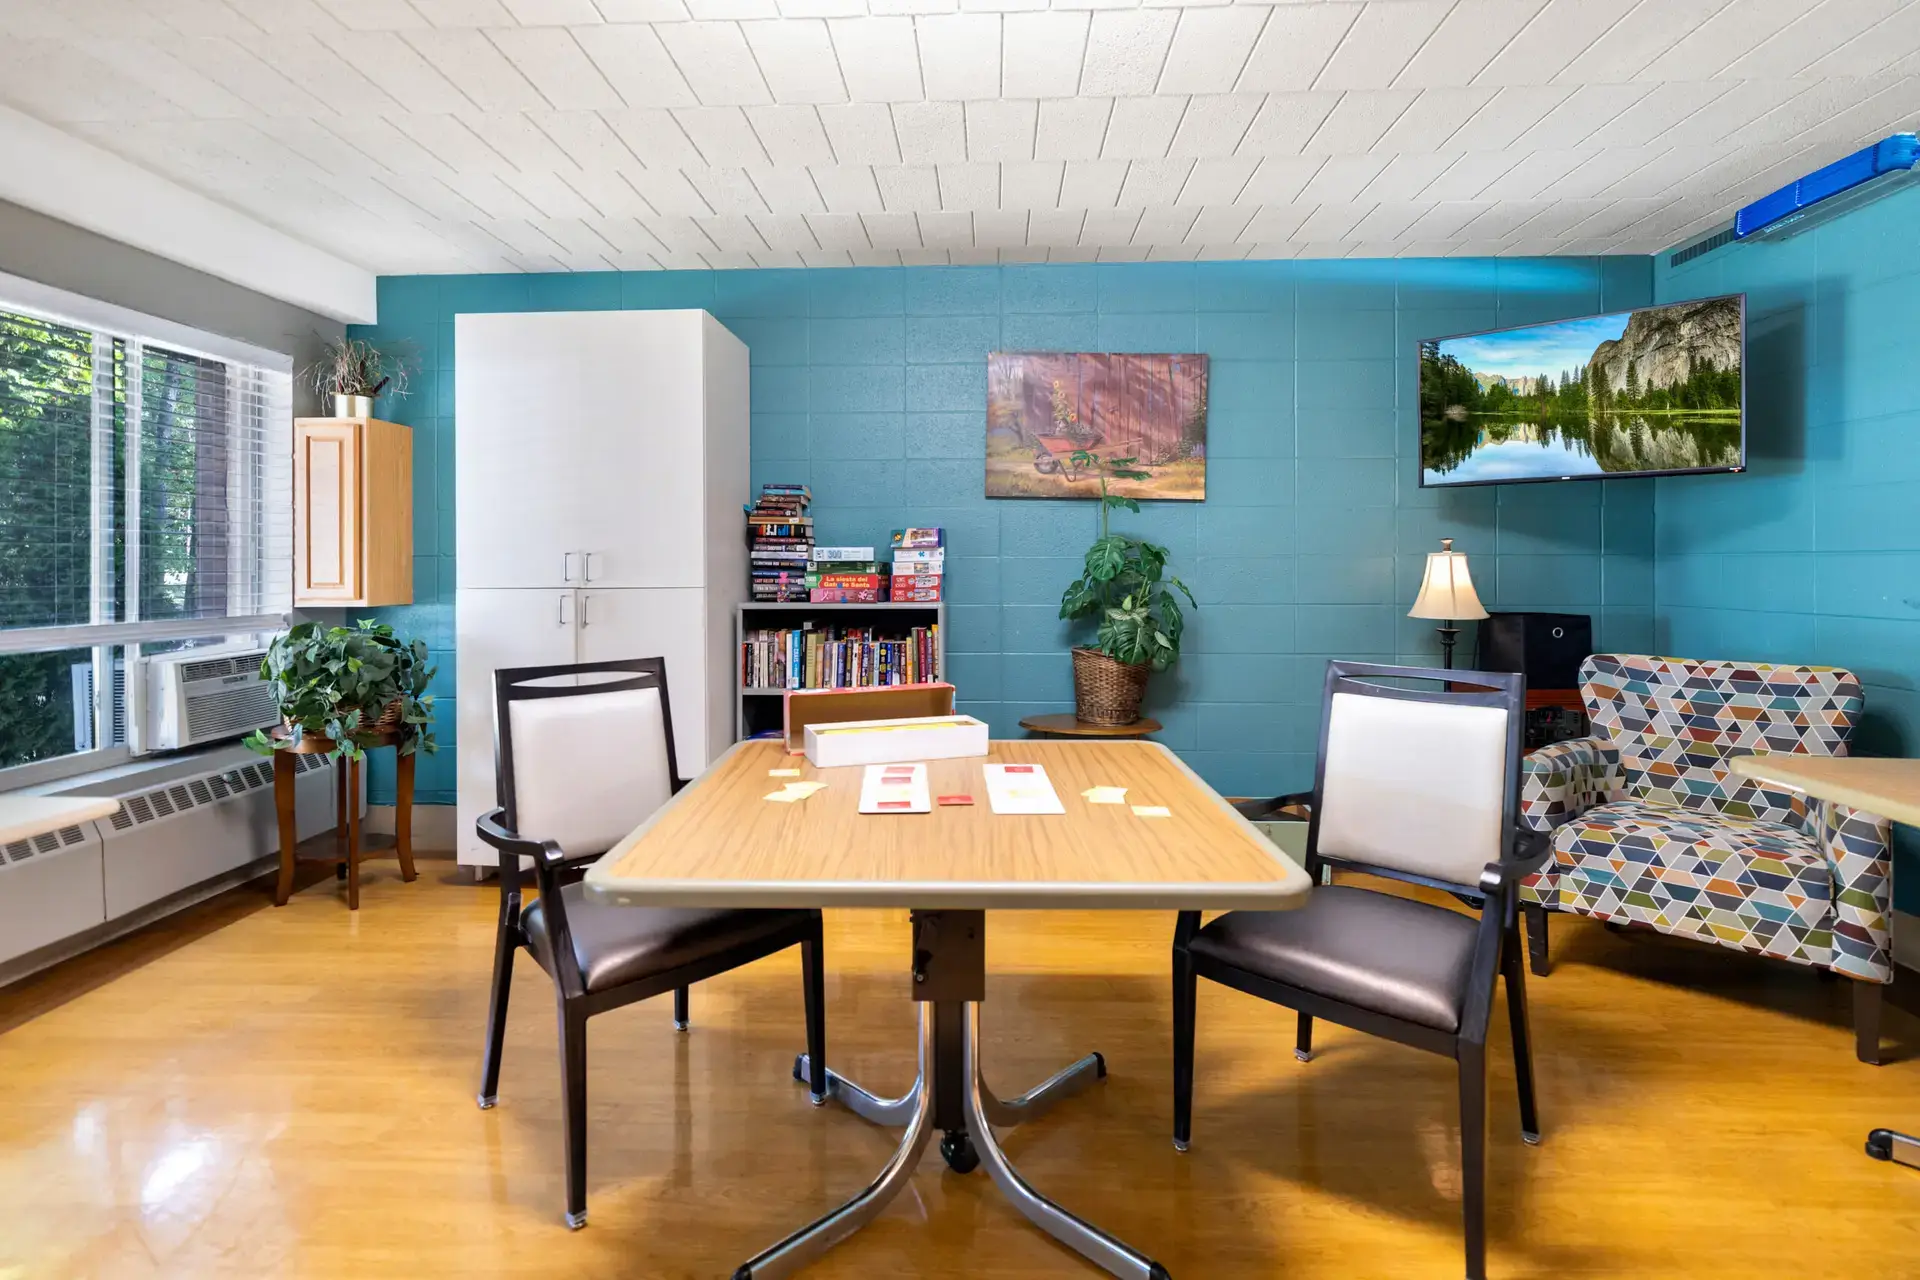
Aside from its specialized care programs, the community orchestrates a variety of enriching activities and engaging programs to maintain an active and blissful lifestyle. Its campus is purposely designed to foster comfort and convenience, ensuring residents adapt to their environment and mingle with various people.

(231) 845-6291

Quality ratings

Measured by Centers for Medicare & Medicaid Services (CMS)

Overall rating Info The Overall CMS Rating combines results from health inspections, staffing levels and quality measures. Health inspections carry the most weight. Staffing and quality scores can increase or decrease the final rating based on performance compared to state and national standards.
2/5
Michigan average: 3.6/5
Health Inspection Info Based on the results of the facility's three most recent standard inspections and any complaint investigations. CMS reviews the number, scope, and severity of deficiencies, with more recent findings weighted more heavily.
2/5
Michigan average: 3.3/5
Staffing Info Measures average nursing staff hours per resident per day, including Registered Nurses (RNs) and total nursing staff. Ratings are adjusted based on the level of care residents require and are compared to state and national benchmarks.
4/5
Michigan average: 3.4/5
Quality Measures Info Based on clinical and physical health indicators reported to CMS, such as hospital readmissions, falls, pressure ulcers, and improvements in mobility. These measures reflect how well residents' health needs are being managed.
2/5
Michigan average: 3.8/5

Nursing care per resident

Info This shows how many total hours of nursing staff time are available per resident each day. Higher numbers usually mean more staff support.
3h 47m per day

This home provides 11% less nursing time per resident than the Michigan average.

Michigan average: 4h 15m per day

Staffing hours breakdown

Info Hours of care per resident per day, broken down by staff type. Data from CMS Medicare.
Staff type Facility State avg National avg
Registered Nurse (RN) Info Registered nurse hours per resident per day. 1h 17m per day 46m per day 41m per day
Nurse Aide Info Nurse aide hours per resident per day. 2h 15m per day 2h 23m per day 2h 21m per day
Total Nursing (Weekend) Info Total number of nurse staff hours per resident per day on weekends. 2h 52m per day 3h 31m per day 3h 26m per day
Physical Therapist Info Physical therapist staff hours per resident per day. 3m per day 4m per day 4m per day
RN (Weekend) Info Registered nurse hours per resident per day on weekends. 46m per day 29m per day 29m per day

Capacity and availability

This home usually has availability

Lower occupancy suggests more openings may be available.

Lower demand than the Michigan average
Occupancy rate 71.1%
Residents per day 63
Occupancy rate
71.1%
Residents per day
63

Who this home usually serves

TYPE OF STAY

Mix of rehab and long-term care

This home supports both short-term rehab and long-term care, with residents staying for a wide range of durations.

Breakdown by payment type

Medicare

21% of new residents, usually for short-term rehab.

Typical stay 25 days

Private pay

59% of new residents, often for short stays.

Typical stay 29 days

Medicaid

19% of new residents, often for long-term daily care.

Typical stay 7 months

Finances and operations

Privately-owned community
Operated by a business corporation.
Home revenue
$12.4M
Profit
$887.6K
Privately-owned community Operated by a business corporation.
Home revenue
$12,364,231.00
Profit
$887,555.00
Payroll costs Info The portion of the home's budget spent on staff, including nurses, caregivers, and other employees who support care and operations.
$4.0M
32.5% of revenue
Other operating costs Info All remaining costs needed to run the home, such as food, utilities, building maintenance, supplies and administrative expenses.
$7.5M
Total costs $11.5M
Years in operation
33 years in operation
A longer operating history, which may indicate experience navigating regulations and delivering ongoing care.
Walk Score
Walk Score: 33 / 100
Somewhat walkable. A few nearby services may be reachable on foot, but most trips require transportation.
BBB Rating
BBB Rating: A+ (Not Accredited)
An independent rating from the Better Business Bureau based on factors such as complaint history, transparency, and business practices.
How BBB ratings work

About this community

Staffing

Key information about the people who lead and staff this community.

Leadership

Contact: Mr. Dan McKinnon, Co-Owner

Care Services

Nursing Services
Rehabilitation Services
Skilled Nursing

Amenities & Lifestyle

Rehabilitation / Therapy Center
On-Site Medical Director
On-Site Podiatrist
On-Site Dentist
On-Site Salon / Spa Services
On-Site Religious Services
State-of-the-Art Therapy Equipment
Pet Therapy
Wifi Accessibility
Fine Dining with Gourmet Menus
Warmly Decorated Private and Semi-Private Rooms
In-Room Free Cable Service
Private Phones
In-Room Phones (Arranged by Family)
Manicured Gardens
Outdoor Courtyard
Comfortable Family / Resident Lounge

Programs & Activities

Specific Programs
Short-Term Care, Renal Disease Services, Respiratory Services, Palliative Care Services, Infusion Therapies, Traditional/Long-Term Care, Post-Operative Care, Comprehensive Wound Care Therapies, Cancer Recovery Services, Digestive Disease Support
Religious Services
Yes

Dining & Nutrition

Food Description
Fine dining with gourmet menus.

What does this home offer?

Accepts Medicaid icon

Accept Medicaid: Yes, Accept

Total residents icon

Total Residents: 93 Residents

Housing options icon

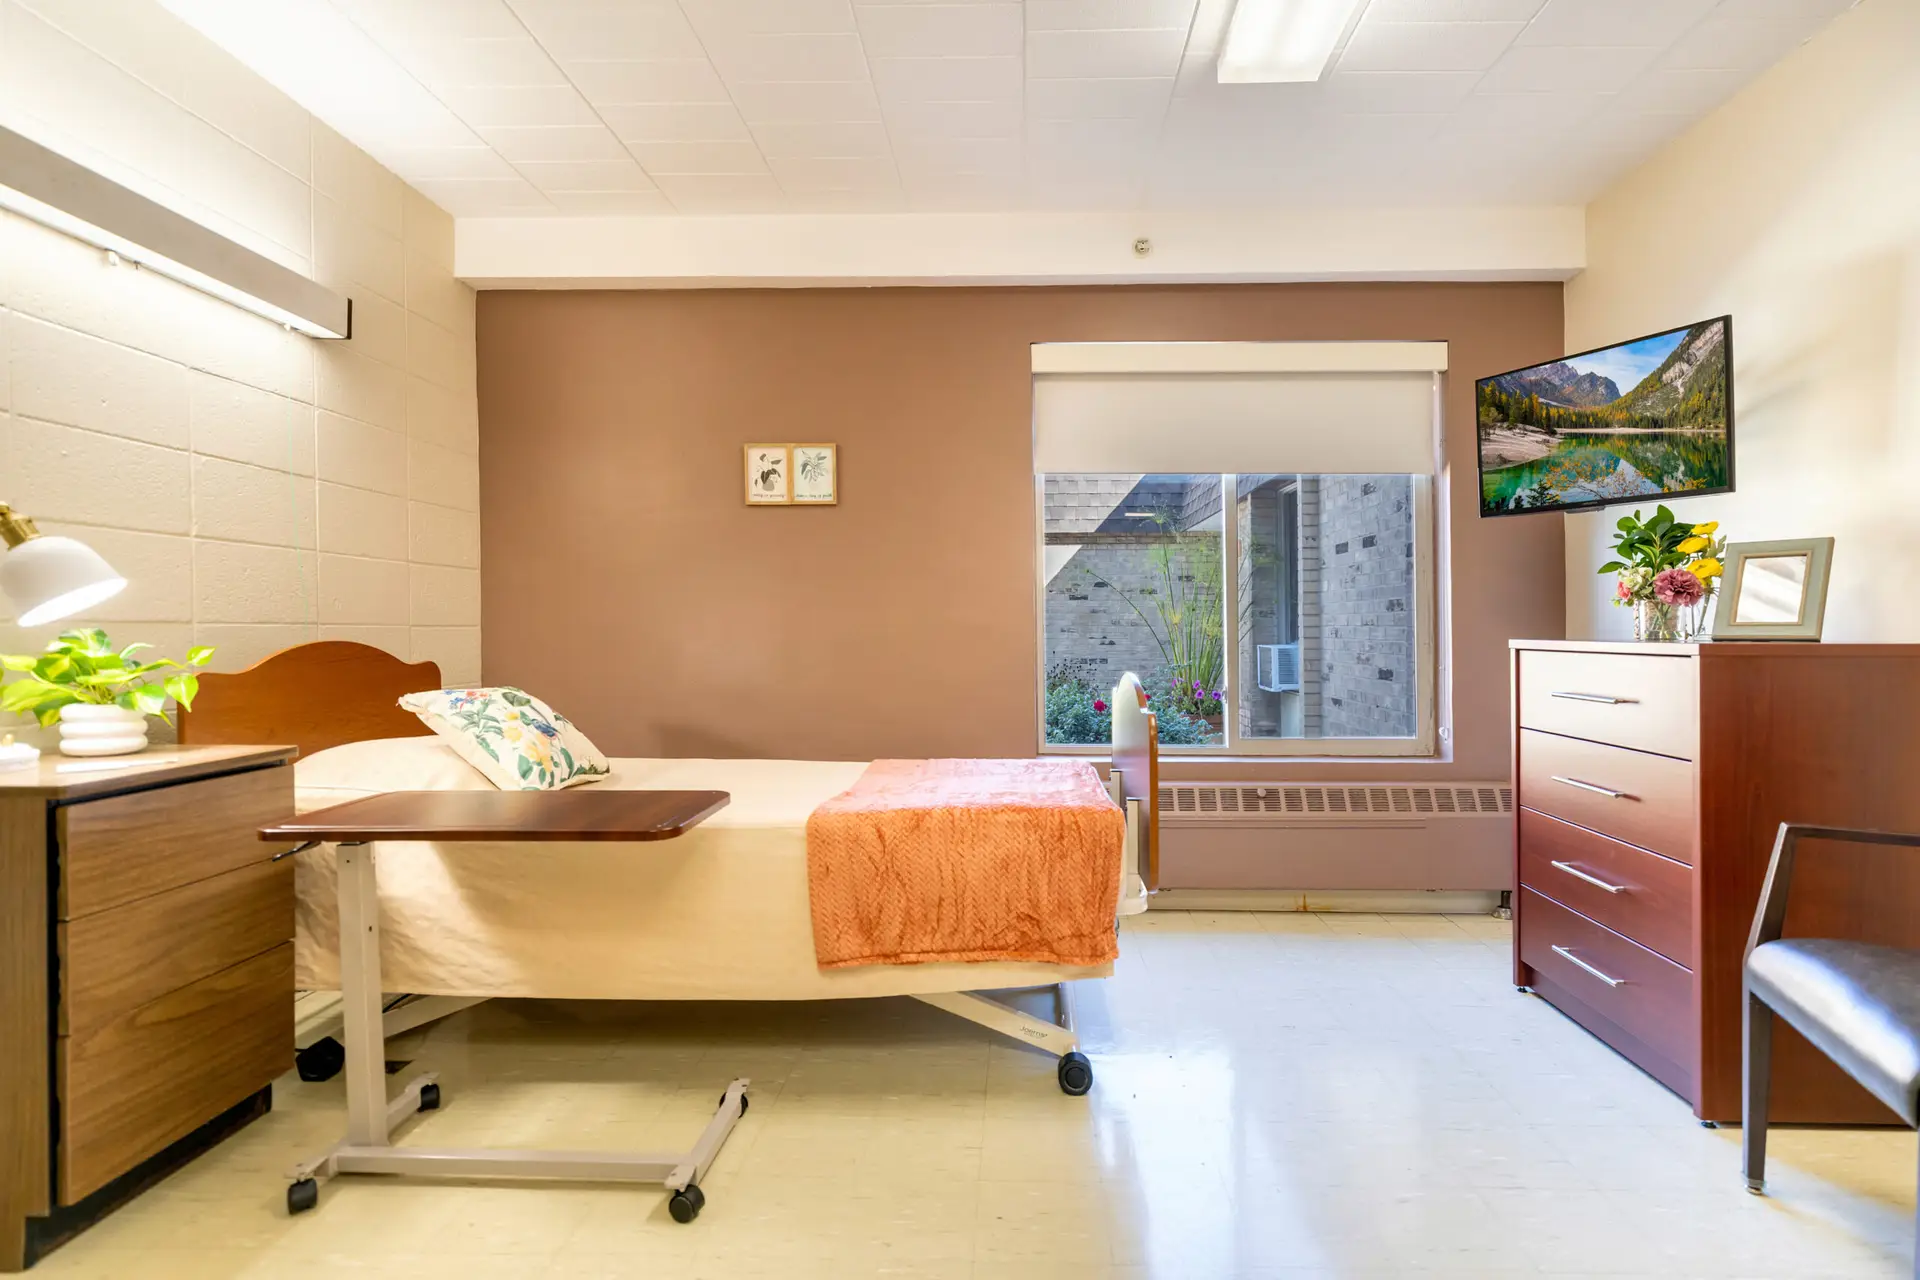
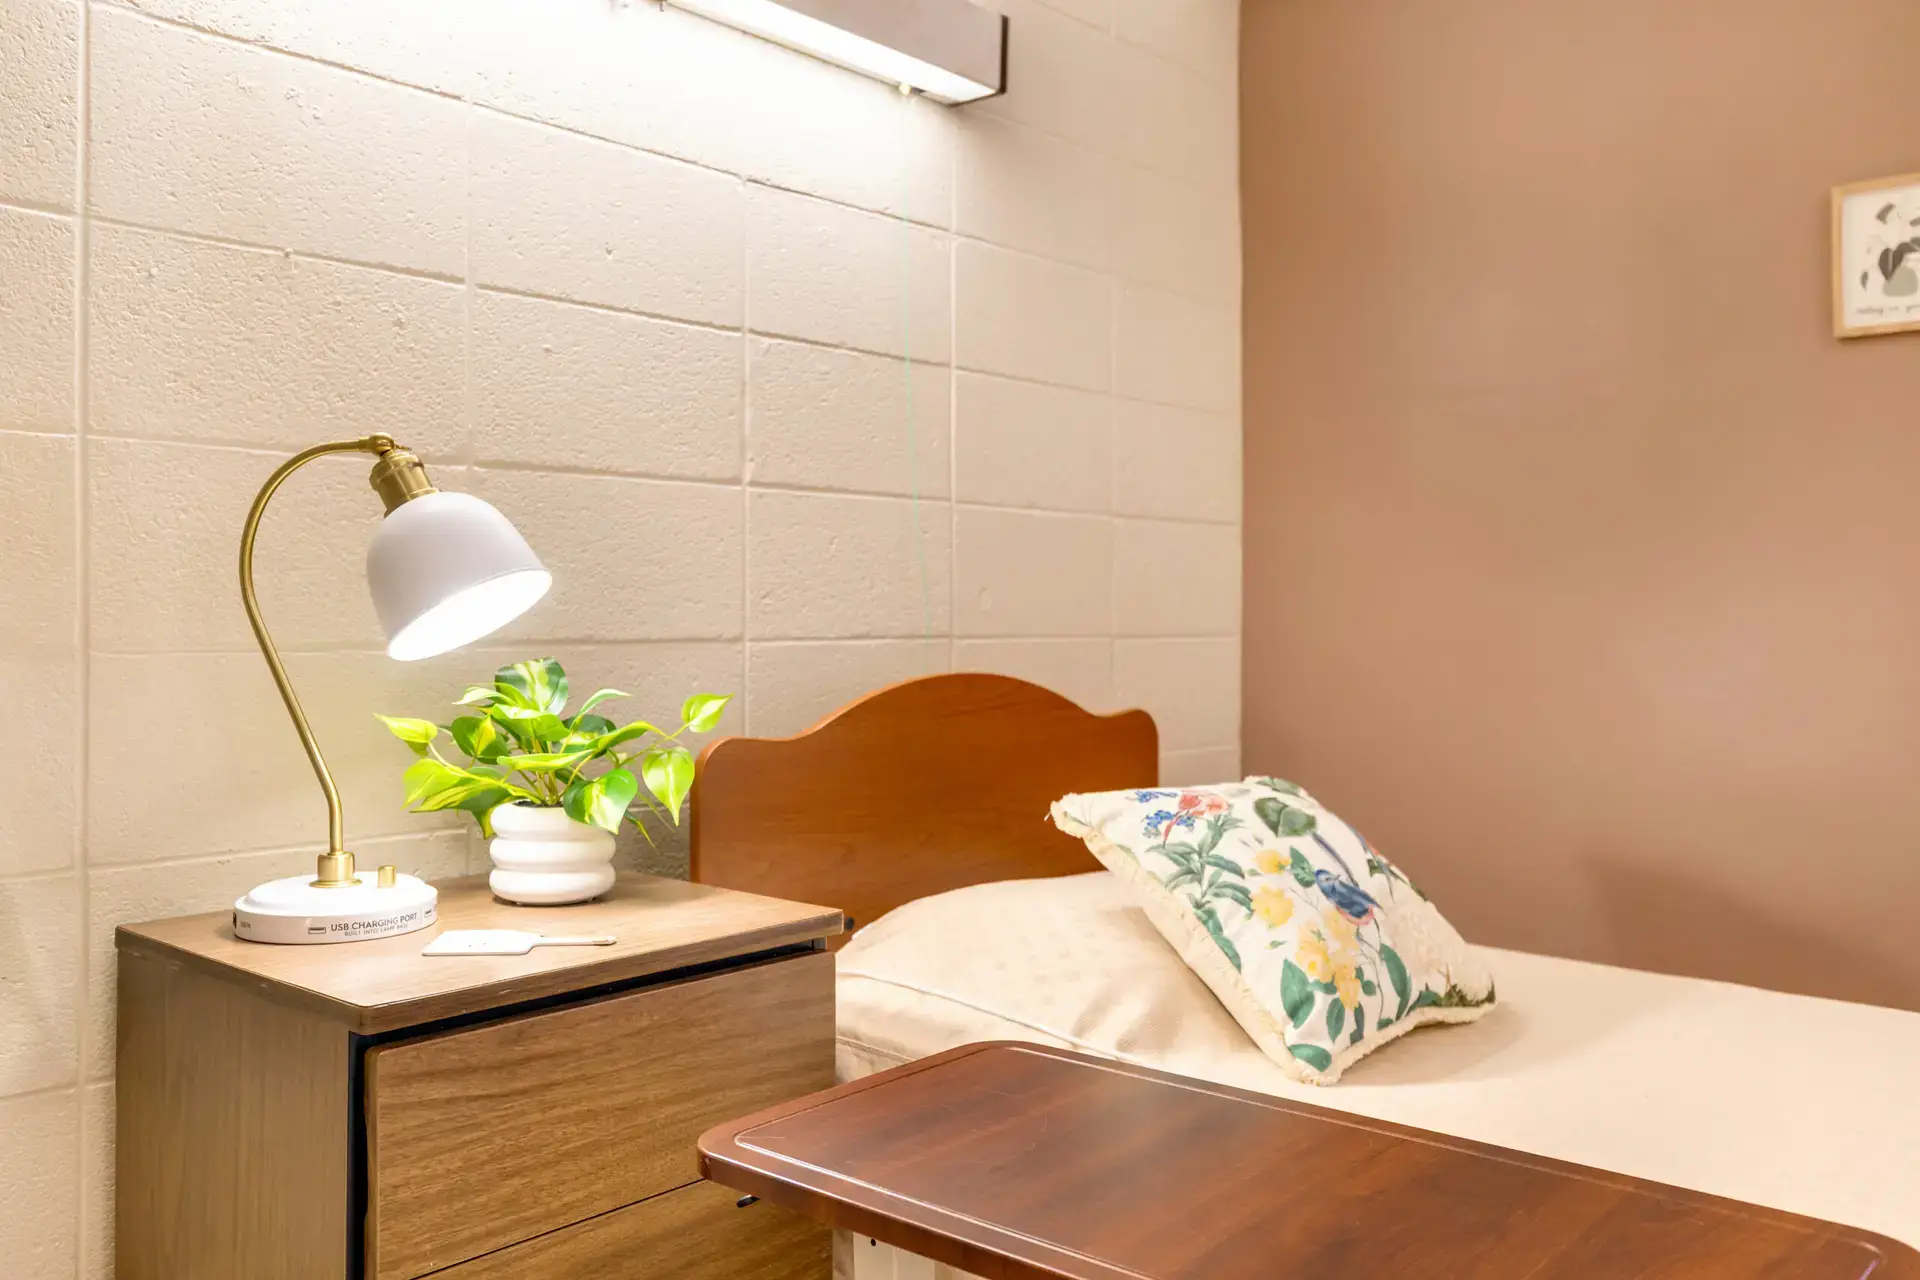
Housing Options: Private / Semi-Private Rooms

Building type icon
Building type icon

Building Type: Single-story

Types of Care at Medilodge of Ludington

Nursing Home
Contact Medilodge of Ludington

Inspection History

In Michigan, the Department of Licensing and Regulatory Affairs (LARA) conducts unannounced inspections and investigations to ensure long-term care facilities comply with state health codes.

11 visits/inspections

7 visits/inspections triggered by complaints

2 routine inspections

Results

11 with issues

0 without issues

Michigan average: 5 visits/inspections

Latest inspection

Date:August 29, 2025
Type:Complaint Investigation

37 deficiencies

Deficiencies indicate regulatory issues. A higher number implies the facility had several areas requiring improvement.

Health Inspection History

Inspections
Total health inspections 12

Michigan average 6.5


Last Health inspection on Aug 2025

Total health citations 37

Michigan average 33.5

Citations per inspection
3.08

Michigan average 5.18


Health citations are formal notices following inspections when they fail to comply with safety and care standards.

9 of 37 citations resulted from standard inspections; 26 of 37 resulted from complaint investigations; and 2 of 37 came from combined inspections (standard and complaint).

Breakdown of citation severity (last 3 years)
Critical Health citations More info 0
100% better than Michigan average

Michigan average: 0.3


Serious Health citations More info 4
111% worse than Michigan average

Michigan average: 1.9

0 critical citations More info Michigan average: 0.3

4 serious citations More info Michigan average: 1.9

33 moderate citations More info Michigan average: 30.8

0 minor citations More info Michigan average: 0.5
Citations history (last 3 years)
Quality of Care serious citation Info Issues related to how well residents receive appropriate treatment and support for their medical and daily care needs. Aug 29, 2025
Corrected

Abuse/Neglect moderate citation Info Issues related to protecting resident's from harm, including abuse, neglect, or mistreatment. Jul 09, 2025
Corrected

Nursing Services moderate citation Info Issues related to the availability and quality of nursing staff and the care they provide. Apr 18, 2025
Corrected

Quality of Care serious citation Info Issues related to how well residents receive appropriate treatment and support for their medical and daily care needs. Apr 18, 2025
Corrected

Compare Nursing Homes around Ludington The information below is reported by the Michigan Department of Licensing and Regulatory Affairs (LARA).

1 facility compared · CMS & MI Dept. of Health data · Updated Mar 2026

Medilodge of Ludington
AL

Assisted Living A licensed, long-term care setting for seniors or individuals with disabilities who need help with daily activities — like bathing, dressing, and medication management — but not 24-hour skilled nursing. Offers housing, meals, and around-the-clock support while aiming to maximize resident independence.

IL

Independent Living Lifestyle-focused communities for older adults offering dining, activities, and transportation with minimal personal care. Best for active, independent seniors who want community without medical support.

MC

Memory Care Secured, specialized care for people living with Alzheimer's or dementia. Staff trained in cognitive impairment, with higher staff-to-resident ratios and an environment designed to reduce confusion and wandering risk.

NH

Nursing Home Licensed facility providing 24/7 skilled nursing care for residents with complex, ongoing medical needs. Staffed by RNs, LPNs, and CNAs. Inspected and star-rated annually by CMS. Accepts Medicare (short-term rehab) and Medicaid (long-term care).

Ludington
93
71.1%
-6%
3.78
+88%
-12%
0
37
4
85
A+
33
$11,8M
$4,0M
33.9%
235358
Private / Semi-Private Rooms

Living Spaces & Floor Plans

Village House Of Ludington4
Village House Of Ludington7
Village House Of Ludington6
Village House Of Ludington5

Places of interest near Medilodge of Ludington

Address 1.7 miles from city center

Address 1000 E Tinkham Ave, Ludington, MI 49431

Calculate Travel Distance to Medilodge of Ludington

Add your location

Address

Staffing Data (Q2 2025)

This data corresponds to Q2 2025 and is based on CMS Payroll-Based Journal.

Total staff 127
Employees 110
Contractors 17
Staff to resident ratio 1.55:1
12% worse than Michigan average

Michigan average ratio: 1.75:1

Avg staff/day 51
Average shift 7.6 hours
0% compared with Michigan average

Michigan average: 7.9 hours

Total staff hours (quarter) 35,287
Nursing staff breakdown
Registered Nurse

Manages medical care and health needs.

Total count 24
Average shift length Info Average shift length. Calculated as total hours divided by days worked and average staff per day. 8 hours

No contractors work on this role.

Licensed Practical Nurse

Assists with medical care and medications.

Total count 7
Average shift length Info Average shift length. Calculated as total hours divided by days worked and average staff per day. 8.7 hours

No contractors work on this role.

Certified Nursing Assistant

Helps with daily care and mobility.

Total count 51
Average shift length Info Average shift length. Calculated as total hours divided by days worked and average staff per day. 7.9 hours

No contractors work on this role.

Contractor staffing

Total hours from contractors

8.5%

2,994 contractor hours this quarter

Speech Language Pathologist: 4 Physical Therapy Assistant: 4 Respiratory Therapy Technician: 3 Physical Therapy Aide: 2 Occupational Therapy Assistant: 2 Qualified Social Worker: 1 Medical Director: 1
Staff by category
Certified Nursing Assistant5105117,15491100%7.9
Registered Nurse240246,30591100%8
Clinical Nurse Specialist100102,3506976%6.6
Licensed Practical Nurse7071,4548088%8.7
Other Dietary Services Staff5051,1229099%7
Speech Language Pathologist0441,0748391%7.2
Nurse Aide in Training5059596875%7.4
Physical Therapy Aide0226566875%6.6
Nurse Practitioner1014966268%8
Administrator1014886167%8
Physical Therapy Assistant0444757886%6.1
RN Director of Nursing1014696167%7.7
Dietitian1014575965%7.7
Dental Services Staff1014215763%7.4
Occupational Therapy Aide2023785055%7.1
Qualified Social Worker0113504651%7.6
Respiratory Therapy Technician0333486875%5.1
Mental Health Service Worker1012403033%8
Occupational Therapy Assistant022631415%3.7
Medical Director011302831%1.1
51 Certified Nursing Assistant
% of Days 100%
24 Registered Nurse
% of Days 100%
10 Clinical Nurse Specialist
% of Days 76%
7 Licensed Practical Nurse
% of Days 88%
5 Other Dietary Services Staff
% of Days 99%
4 Speech Language Pathologist
% of Days 91%
5 Nurse Aide in Training
% of Days 75%
2 Physical Therapy Aide
% of Days 75%
1 Nurse Practitioner
% of Days 68%
1 Administrator
% of Days 67%
4 Physical Therapy Assistant
% of Days 86%
1 RN Director of Nursing
% of Days 67%
1 Dietitian
% of Days 65%
1 Dental Services Staff
% of Days 63%
2 Occupational Therapy Aide
% of Days 55%
1 Qualified Social Worker
% of Days 51%
3 Respiratory Therapy Technician
% of Days 75%
1 Mental Health Service Worker
% of Days 33%
2 Occupational Therapy Assistant
% of Days 15%
1 Medical Director
% of Days 31%

Facility Characteristics

Source: CMS Long-Term Care Facility Characteristics (Data as of Jan 2026)

Total census
82 residents
Residents by payment source
Medicare
19 residents (23.2%)
Medicaid
56 residents (68.3%)
Private pay or other
7 residents (8.5%)
Programs & Services
Residents' Group

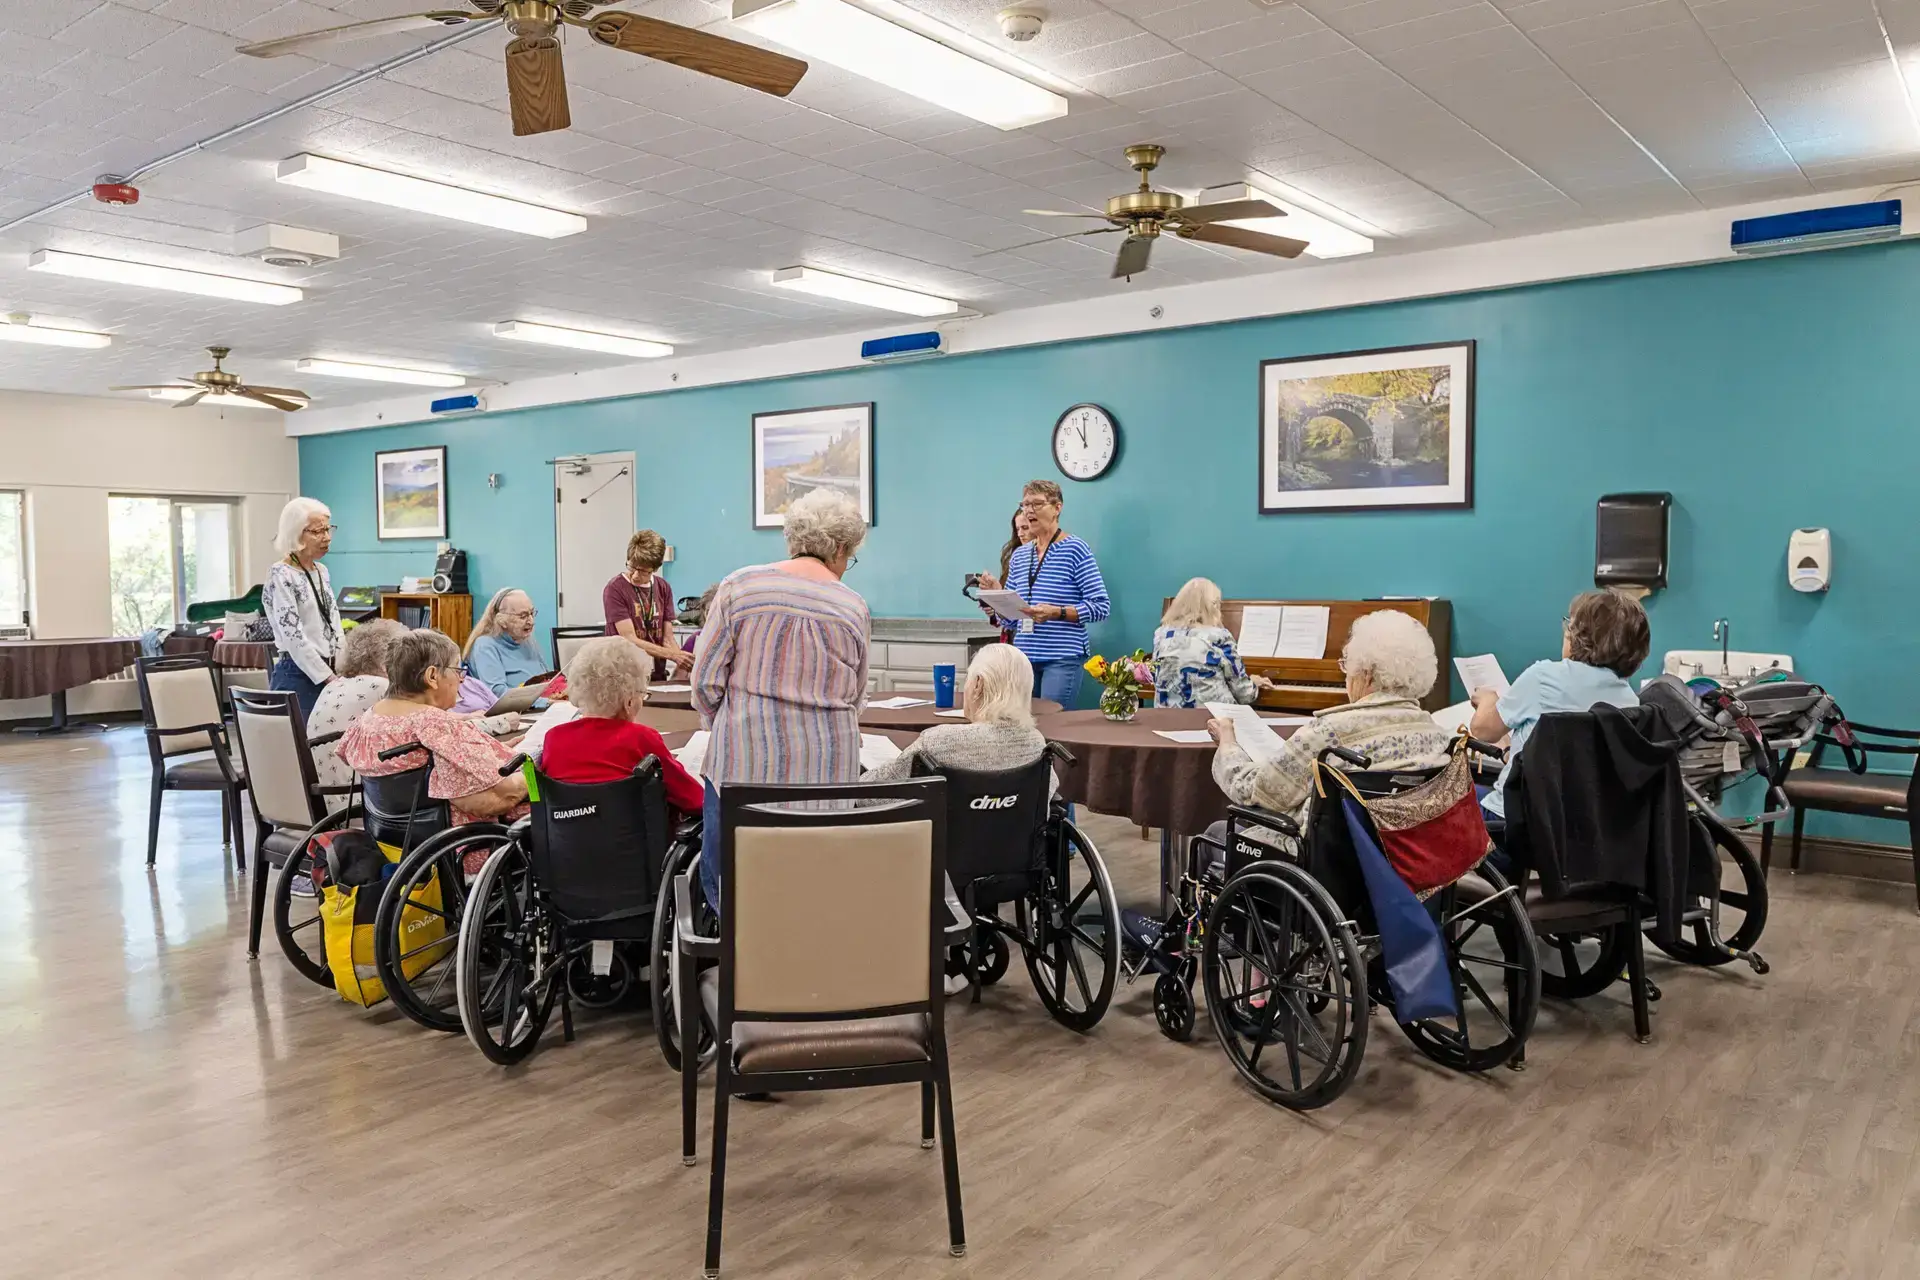
Residents meet regularly to discuss policies, care quality, and activities

Active Resident Council

Organized group of residents that meets regularly to discuss facility policies, quality of life, and activities.

Quality of care over time

These measures show how residents usually do over time at this home, based on health outcomes and preventive care.

High-risk clinical events score Info A composite score based on pressure ulcers, falls with injury, weight loss, walking ability decline, and activities of daily living decline. 11.5
37% worse than Michigan average

Michigan average: 8.4

Functional decline score Info A composite score based on activities of daily living decline, walking ability decline, and incontinence. 24.0
47% worse than Michigan average

Michigan average: 16.3

Long-stay resident measures
Below average Michigan avg: 4.2 Info CMS star rating based on long-stay quality measure performance. 5 stars = significantly above average, 1 star = significantly below average.
Need for Help with Daily Activities Increased Info Percent of long-stay residents whose need for help with daily activities has increased 14.3%
15% worse than Michigan average

Michigan average: 12.5%

Walking Ability Worsened Info Percent of long-stay residents whose ability to move independently worsened 26.2%
71% worse than Michigan average

Michigan average: 15.3%

Low Risk Residents with Bowel/Bladder Incontinence Info Percent of low risk long-stay residents who lose control of their bowels or bladder 31.6%
50% worse than Michigan average

Michigan average: 21.0%

Falls with Major Injury Info Percent of long-stay residents experiencing one or more falls with major injury 3.3%
5% worse than Michigan average

Michigan average: 3.2%

High Risk Residents with Pressure Ulcers Info Percent of long-stay high risk residents with pressure ulcers 5.4%
6% better than Michigan average

Michigan average: 5.7%

Urinary Tract Infection Info Percent of long-stay residents with a urinary tract infection 3.8%
124% worse than Michigan average

Michigan average: 1.7%

Lost Too Much Weight Info Percent of long-stay residents who lose too much weight 8.4%
49% worse than Michigan average

Michigan average: 5.7%

Depressive Symptoms Info Percent of long-stay residents who have depressive symptoms 6.5%
69% worse than Michigan average

Michigan average: 3.9%

Antipsychotic Use Info Percent of long-stay residents who received an antipsychotic medication 14.2%
5% better than Michigan average

Michigan average: 15.0%

Pneumococcal Vaccine Info Percent of long-stay residents assessed and appropriately given the pneumococcal vaccine 89.7%
6% worse than Michigan average

Michigan average: 94.9%

Influenza Vaccine Info Percent of long-stay residents assessed and appropriately given the seasonal influenza vaccine 74.0%
22% worse than Michigan average

Michigan average: 95.0%

Hospitalizations per 1,000 days Info Number of hospitalizations per 1,000 long-stay resident days. 2.61
50% worse than Michigan average

Michigan average: 1.74

ED visits per 1,000 days Info Number of outpatient emergency department visits per 1,000 long-stay resident days. 2.98
94% worse than Michigan average

Michigan average: 1.54

Short-stay resident measures
Average Michigan avg: 3.1 Info CMS star rating based on short-stay quality measure performance. 5 stars = much above average, 1 star = much below average.
Pneumococcal Vaccine Info Percent of short-stay residents assessed and appropriately given the pneumococcal vaccine 73.0%
12% worse than Michigan average

Michigan average: 82.5%

Antipsychotic medication increase Info Percent of short-stay residents who newly received an antipsychotic medication 3.2%
123% worse than Michigan average

Michigan average: 1.4%

Influenza Vaccine Info Percent of short-stay residents assessed and appropriately given the seasonal influenza vaccine 68.2%
14% worse than Michigan average

Michigan average: 79.5%

Re-hospitalized after SNF stay Info Percentage of short-stay residents who were re-hospitalized after their nursing home admission. 34.1%
41% worse than Michigan average

Michigan average: 24.2%

Emergency department visits Info Percentage of short-stay residents who had an outpatient emergency department visit. 14.8%
29% worse than Michigan average

Michigan average: 11.5%

Falls with major injury Info Percentage of SNF residents who experience falls with major injury during their stay. 1.0%
27% worse than Michigan average

Michigan average: 0.8%

Ability to care for self at discharge Info Percentage of residents at or above expected ability to care for themselves at discharge. 55.4%
In line with Michigan average

Michigan average: 53.7%

Successful return to home or community Info Rate of successful return to home or community from a skilled nursing facility. 60.3%
19% better than Michigan average

Michigan average: 50.6%

Guides for Better Senior Living

Care Cost Calculator: See Prices in Your Area

Nursing Home Data Explorer

Don’t Wait Too Long: 7 Red Flag Signs Your Parent Needs Assisted Living Now

The True Cost of Assisted Living in 2025 – And How Families Are Paying For It

Understanding Senior Living Costs: Pricing Models, Discounts & Financial Assistance

Financial Aid for Michigan Seniors

Get financial aid guidance

MI Choice Waiver

Michigan Medicaid MI Choice Waiver

Age 65+ or disabled, Michigan resident, Medicaid- eligible, nursing home-level care need.

~$2,829/month (300% FBR, individual).

$2,000 (individual), $3,000 (couple).

Delivered through regional waiver agents; waitlists possible.

Home Help Program

Michigan Home Help

Age 65+ or disabled, Michigan resident, Medicaid- eligible or low-income.

~$1,732/month (individual, Medicaid threshold).

$2,000 (individual).

Can hire family caregivers; less intensive than waiver.

Program of All-Inclusive Care for the Elderly (PACE)

Michigan PACE

Age 55+, Michigan resident, nursing home-level care need, safe with PACE support.

~$2,829/month (Medicaid-eligible); private pay option available.

$2,000 (individual), $3,000 (couple).

16 PACE centers (e.g., Ingham, Wayne counties); expanding slowly.

Medicare Savings Program (MSP)

Michigan Medicare Savings Program

Age 65+ or disabled, Michigan resident, Medicare Part A/B.

~$2,510/month (QMB), ~$3,380/month (SLMB), ~$3,598/month (QI)—individual.

$9,430 (individual), $14,130 (couple).

Three tiers; no waitlist; includes Extra Help for Part D.

National Family Caregiver Support Program (NFCSP) Respite

Michigan NFCSP Respite Care

Caregivers of 60+ needing care or 55+ caregivers of others; Michigan resident; functional needs (2+ ADLs).

Prioritizes ~$24,980/year (individual); no strict cap.

Not assessed; need-based.

16 AAAs; prioritizes low-income, rural caregivers.

Senior Community Service Employment Program (SCSEP)

Michigan SCSEP

Age 55+, unemployed, low-income, Michigan resident.

~$1,983/month (125% FPL).

Not specified; income-focused.

Priority for veterans, rural residents; Operation ABLE partnership.

VA Aid and Attendance (A&A) and Housebound Benefits

Michigan VA Aid and Attendance/Housebound

Age 65+ or disabled veteran/spouse, Michigan resident, wartime service, need for ADL help (A&A) or homebound.

Net income < ~$1,984/month (veteran with dependent, A&A); pension offsets income.

~$155,356 (net worth limit).

High veteran demand in urban/rural areas.

Tour Icon
Planning a tour? Check our touring checklist.
Chat Icon
Thinking of living here? We can help you speak to a current resident