Oakview Medical Care Facility
Nursing Home & Memory Care · Ludington, MI
CMS overall rating Info CMS (the Centers for Medicare & Medicaid Services) is the federal agency that rates nursing home quality. Its Overall Rating runs from 1 to 5 stars, combining health inspections, staffing, and quality measures, with inspections weighted most heavily.

Oakview Medical Care Facility

Nursing Home & Memory Care · Ludington, MI
CMS overall rating Info CMS (the Centers for Medicare & Medicaid Services) is the federal agency that rates nursing home quality. Its Overall Rating runs from 1 to 5 stars, combining health inspections, staffing, and quality measures, with inspections weighted most heavily.
Calculator: See prices in your area
Oakview Medical Care Facility accepts Medicare, Medicaid, and private pay.

Overview of Oakview Medical Care Facility

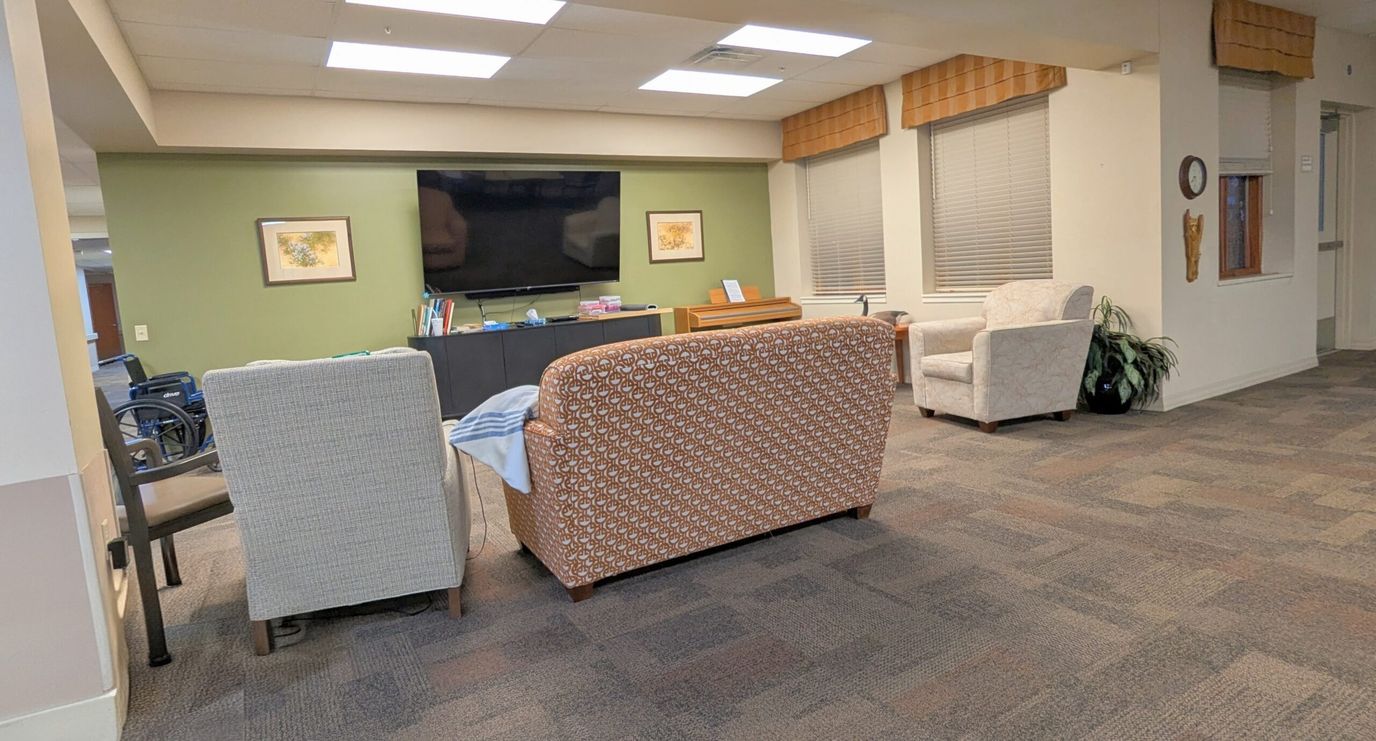
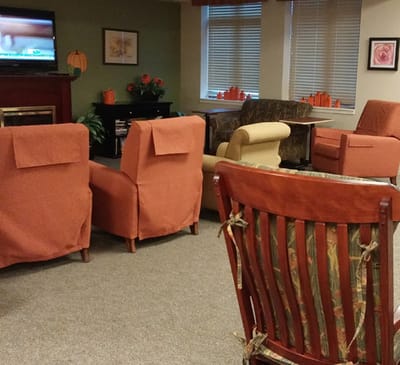
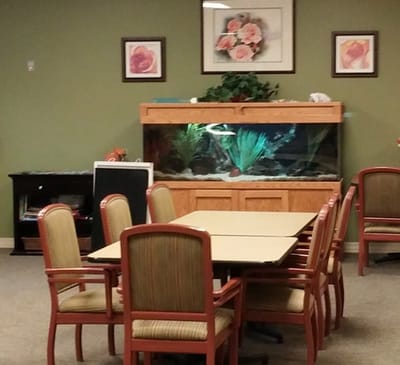
Oakview Medical Care Facility is a county-owned nursing home in Ludington, MI, offering rehabilitation and skilled nursing. Promoting a home-like environment, the community ensures older adults are treated well throughout their stay. Residents can also focus on recovery and wellness with chef-prepared meals, 24/7 nursing care, and comprehensive therapies. Personalized care plans are also provided based on residents’ unique needs and habits to help them recover and return to their routines with ease.

Celebrations, games, and exercises encourage residents to interact with friends and gain meaningful experiences. Top-notch amenities, including an enclosed four-seasons corridor, a hair salon, and a pavilion, are also available for residents’ relaxation and wellness. Residents also have quick access to their necessities and leisure with restaurants, healthcare providers, shops, and recreation sites nearby. Providing exceptional standards of care for older adults’ welfare, this nursing home is a highly regarded option for senior living in Michigan.

Quality ratings

Measured by Centers for Medicare & Medicaid Services (CMS)

Overall rating Info The Overall CMS Rating combines results from health inspections, staffing levels and quality measures. Health inspections carry the most weight. Staffing and quality scores can increase or decrease the final rating based on performance compared to state and national standards.
▲ 59.4% Above MI avg. ▲ 59.4% Above MI avg.MI average: 3.1Click the badge to see the full State ranking.Click here to see the full State ranking.
Health Inspection Info Based on the results of the facility's three most recent standard inspections and any complaint investigations. CMS reviews the number, scope, and severity of deficiencies, with more recent findings weighted more heavily.
▲ 41.5% Above MI avg. ▲ 41.5% Above MI avg.MI average: 2.8Click the badge to see the full State ranking.Click here to see the full State ranking.
Staffing Info Measures average nursing staff hours per resident per day, including Registered Nurses (RNs) and total nursing staff. Ratings are adjusted based on the level of care residents require and are compared to state and national benchmarks.
▲ 43.0% Above MI avg. ▲ 43.0% Above MI avg.MI average: 3.5Click the badge to see the full State ranking.Click here to see the full State ranking.
Quality Measures Info Based on clinical and physical health indicators reported to CMS, such as hospital readmissions, falls, pressure ulcers, and improvements in mobility. These measures reflect how well residents' health needs are being managed.
▼ 46.8% Below MI avg. ▼ 46.8% Below MI avg.MI average: 3.8Click the badge to see the full State ranking.Click here to see the full State ranking.

Staffing hours breakdown

Info Daily nursing hours per resident by staff type, reported to CMS. Higher is generally better — compare this facility to state and national averages to see where staffing stands.

Hours per resident per day — compared to Michigan state averages

Total nursing care / resident Info This home is ranked 8th out of 142 homes in Michigan for nurse hours. Total adjusted nursing hours per resident per day, combining RN, LPN, and aide time. CMS adjusts this for case-mix so facilities can be fairly compared.
5h 41m per day
Rank #8 / 142Nurse hours — State benchmarkedThis home is ranked 8th out of 142 homes in Michigan. Shows adjusted nurse hours per resident per day benchmarked to the Michigan average, with a ranking across 142 Michigan facilities. More hours mean more direct care. The national average is about 3.5 hrs; below 3.0 is a red flag.Rankings are based only on facilities in Michigan that report data for that category. Facilities without available data are excluded from the ranking.Click the rank badge to see the full State ranking.Click here to see the full State ranking.
This facility Michigan avg (4h 18m per day)
vs Michigan avg
+32%

1 of 6 metrics below state avg

Standout metric Registered Nurse (RN) is +54% above state avg
Staff typeHours / Day / Residentvs state avg
Registered Nurse (RN) Info RNs hold the highest nursing license and can assess residents, interpret test results, and direct care plans. More RN hours per day often signals stronger clinical oversight and faster response to health changes. 1h 11m per day ▲ 54% State avg: 46m per day · National avg: 41m per day
LPN / LVN Info Licensed Practical Nurses (LPNs) or Licensed Vocational Nurses (LVNs) deliver routine hands-on care — medication administration, wound dressing, and monitoring vital signs. They work under RN supervision and make up a large share of daily bedside care. 51m per day ▼ 5% State avg: 53m per day · National avg: 52m per day
Nurse Aide Info Certified Nurse Aides (CNAs) provide the most direct day-to-day assistance: bathing, dressing, feeding, and mobility. Nurse aide hours are typically the largest staffing category and directly affect residents' quality of life. 2h 56m per day ▲ 26% State avg: 2h 20m per day · National avg: 2h 20m per day
Weekend Total Nursing Info Combined nursing hours (RN + LPN + Nurse Aide) per resident per day on weekends. Staffing often drops on weekends — this figure reveals whether the facility maintains adequate coverage outside of weekday hours. 4h 13m per day ▲ 20% State avg: 3h 31m per day · National avg: 3h 27m per day
Physical Therapist Info Hours per resident per day provided by licensed Physical Therapists (PTs) or PT Assistants. PT services help residents recover mobility after injury or illness and are especially important for post-acute (short-stay) rehabilitation. 4m per day ▲ 6% State avg: 4m per day · National avg: 4m per day
Weekend RN Info Registered nurse hours specifically on weekends. Facilities sometimes reduce RN presence on Saturdays and Sundays — a low weekend RN figure compared to weekday hours can indicate reduced clinical oversight when most administrative staff are absent. 37m per day ▲ 26% State avg: 29m per day · National avg: 29m per day

Capacity and availability

This home usually has availability

Lower occupancy than the Michigan average: 75.8%
Occupancy rate
72.6% Rank #110 / 395Occupancy rate — State benchmarkedThis home is ranked 110th out of 395 homes in Michigan. Shows this facility's occupancy rate versus the Michigan average, with its Statewide rank out of 395. Higher occupancy signals strong local demand and financial stability.Rankings are based only on facilities in Michigan that report data for that category. Facilities without available data are excluded from the ranking.Click the rank badge to see the full State ranking.Click here to see the full State ranking.
Avg. Length of Stay
187 days
Bed community size
96-bed community Rank #143 / 435Bed count — State benchmarkedThis home is ranked 143rd out of 435 homes in Michigan. Shows this facility's certified or reported bed count compared to other Michigan facilities. Larger communities may offer more amenities, programs, and on-site services for residents and families.Rankings are based only on facilities in Michigan that report data for that category. Facilities without available data are excluded from the ranking.Click the rank badge to see the full State ranking.Click here to see the full State ranking.
A larger shared setting that may offer more common spaces and organized community services.
Walk Score
Walk Score: 42 / 100 Rank #300 / 703Walk Score — State benchmarkedThis home is ranked 300th out of 703 homes in Michigan. Shows how walkable this facility's neighborhood is compared to the average Walk Score across Michigan facilities. Higher scores benefit residents, families, and staff.Rankings are based only on facilities in Michigan that report data for that category. Facilities without available data are excluded from the ranking.Click the rank badge to see the full State ranking.Click here to see the full State ranking.
Somewhat walkable. A few nearby services may be reachable on foot, but most trips require transportation.

About this community

License Details

State License TypesMedicare, Medicaid

Safety & Compliance

Wheelchair Accessible

Payment & Insurance

2 services
Accept Medicaid
Accept Medicare

Therapy & Rehabilitation

1 service
Rehabilitation Services

Staffing & Medical

2 services
Doctor on Staff
24-Hour Staffing

Additional Policies & Features

Admission CriteriaPhysician’s request and pre-admission screenings required.

Amenities & Lifestyle

Salon
Barber
Beauty Shop
Spa
Transportation
Laundry
ActivitiesSocial activities, such as visits from entertainers, are offered to residents daily
Specific ProgramsBarber & Beauty Shop Services, Therapeutic Dietary Services, Occupational Therapy Services, Physical Therapy Services, Physician Services, Speech Therapy Services, Recreational Therapy Services, Alzheimer’s & Dementia Care

Pricing & Financial Information

Starting Price$1,500 per month

Contact Oakview Medical Care Facility

Staffing Data

Reporting period: October 1 – December 31, 2025 (Q4 2025). Source: CMS Payroll-Based Journal report.

Total staff 117
Employees 104
Contractors 13
Staff to resident ratio 1.67 : 1
0% compared with Michigan average
Michigan average ratio: 1.70 : 1 Michigan average ratio: 1.70 : 1See full Michigan ranking
Avg staff/day 55
Average shift 7.7 hours
0% compared with Michigan average
Michigan average: 7.9 hours Michigan average shift: 7.9 hoursSee full Michigan ranking
Total staff hours (quarter) 39,011

Nursing staff breakdown

Q4 2025 · Oct 1 – Dec 31 More info This data comes from the CMS Payroll-Based Journal report covering October 1 – December 31, 2025.
Registered Nurse

Manages medical care and health needs.

RN Staff Info 16 total: 15 full-time employees and 1 contractor. 16
Average shift length Info Average shift length. Calculated as total hours divided by days worked and average staff per day. 7.9 hours
Licensed Practical Nurse

Assists with medical care and medications.

LPN Staff Info 17 total: 8 full-time employees and 9 contractors. 17
Average shift length Info Average shift length. Calculated as total hours divided by days worked and average staff per day. 8.6 hours
Certified Nursing Assistant

Helps with daily care and mobility.

CNA Staff Info 52 total: 51 full-time employees and 1 contractor. 52
Average shift length Info Average shift length. Calculated as total hours divided by days worked and average staff per day. 7.6 hours

Contractor staffing

Q4 2025 · Oct 1 – Dec 31 More info This data comes from the CMS Payroll-Based Journal report covering October 1 – December 31, 2025.

Total hours from contractors

10.2%

3,987 contractor hours this quarter

Licensed Practical Nurse: 9 Registered Nurse: 1 Certified Nursing Assistant: 1 Occupational Therapy Assistant: 1 Medical Director: 1

Staff by category

Q4 2025 · Oct 1 – Dec 31 More info This data comes from the CMS Payroll-Based Journal report covering October 1 – December 31, 2025.
Certified Nursing Assistant5115218,72892100%7.6
Licensed Practical Nurse89175,27892100%8.6
Registered Nurse151164,22992100%7.9
Clinical Nurse Specialist6062,9718795%7.9
Other Dietary Services Staff7072,40192100%7.7
Mental Health Service Worker3031,3046470%8
Dental Services Staff1014845964%8.2
Occupational Therapy Aide1014725964%8
Respiratory Therapy Technician1014725964%8
Administrator1014605863%7.9
Nurse Practitioner1014485661%8
Other Social Services Staff1014365560%7.9
Speech Language Pathologist2024055560%7.4
Physical Therapy Assistant2023436470%5.4
Nurse Aide in Training2023256065%5.4
RN Director of Nursing1011842325%8
Occupational Therapy Assistant011351415%2.5
Medical Director011301415%2.1
Qualified Social Worker101767%1.1
52 Certified Nursing Assistant
% of Days 100%
17 Licensed Practical Nurse
% of Days 100%
16 Registered Nurse
% of Days 100%
6 Clinical Nurse Specialist
% of Days 95%
7 Other Dietary Services Staff
% of Days 100%
3 Mental Health Service Worker
% of Days 70%
1 Dental Services Staff
% of Days 64%
1 Occupational Therapy Aide
% of Days 64%
1 Respiratory Therapy Technician
% of Days 64%
1 Administrator
% of Days 63%
1 Nurse Practitioner
% of Days 61%
1 Other Social Services Staff
% of Days 60%
2 Speech Language Pathologist
% of Days 60%
2 Physical Therapy Assistant
% of Days 70%
2 Nurse Aide in Training
% of Days 65%
1 RN Director of Nursing
% of Days 25%
1 Occupational Therapy Assistant
% of Days 15%
1 Medical Director
% of Days 15%
1 Qualified Social Worker
% of Days 7%

Penalties and fines

Federal penalties imposed by CMS for regulatory violations, including civil money penalties (fines) and denials of payment for new Medicare/Medicaid admissions.

Source: CMS Penalties Database

No penalties in the past 3 years

No civil money penalties or payment denials were reported in the last 3 years.

Quality of care over time

These measures show how residents usually do over time at this home, based on health outcomes and preventive care.

High-risk clinical events score Info A composite score based on pressure ulcers, falls with injury, weight loss, walking ability decline, and activities of daily living decline. 7.0
17% better than Michigan average

Michigan average: 8.4

Functional decline score Info A composite score based on activities of daily living decline, walking ability decline, and incontinence. 13.2
19% better than Michigan average

Michigan average: 16.3

Long-stay resident measures
Need for Help with Daily Activities Increased Info Percent of long-stay residents whose need for help with daily activities has increased 10.1%
19% better than Michigan average

Michigan average: 12.5%

Walking Ability Worsened Info Percent of long-stay residents whose ability to move independently worsened 10.9%
29% better than Michigan average

Michigan average: 15.3%

Low Risk Residents with Bowel/Bladder Incontinence Info Percent of low risk long-stay residents who lose control of their bowels or bladder 18.6%
12% better than Michigan average

Michigan average: 21.0%

Falls with Major Injury Info Percent of long-stay residents experiencing one or more falls with major injury 3.6%
15% worse than Michigan average

Michigan average: 3.2%

High Risk Residents with Pressure Ulcers Info Percent of long-stay high risk residents with pressure ulcers 6.6%
16% worse than Michigan average

Michigan average: 5.7%

Urinary Tract Infection Info Percent of long-stay residents with a urinary tract infection 5.1%
202% worse than Michigan average

Michigan average: 1.7%

Lost Too Much Weight Info Percent of long-stay residents who lose too much weight 3.5%
38% better than Michigan average

Michigan average: 5.7%

Depressive Symptoms Info Percent of long-stay residents who have depressive symptoms 0.5%
88% better than Michigan average

Michigan average: 3.9%

Antipsychotic Use Info Percent of long-stay residents who received an antipsychotic medication 13.7%
9% better than Michigan average

Michigan average: 15.0%

Pneumococcal Vaccine Info Percent of long-stay residents assessed and appropriately given the pneumococcal vaccine 99.6%
5% better than Michigan average

Michigan average: 94.9%

Influenza Vaccine Info Percent of long-stay residents assessed and appropriately given the seasonal influenza vaccine 98.6%
In line with Michigan average

Michigan average: 95.0%

Short-stay resident measures
Pneumococcal Vaccine Info Percent of short-stay residents assessed and appropriately given the pneumococcal vaccine 89.7%
9% better than Michigan average

Michigan average: 82.5%

Antipsychotic medication increase Info Percent of short-stay residents who newly received an antipsychotic medication 1.8%
26% worse than Michigan average

Michigan average: 1.4%

Influenza Vaccine Info Percent of short-stay residents assessed and appropriately given the seasonal influenza vaccine 84.1%
6% better than Michigan average

Michigan average: 79.5%

Breakdown by payment type

Medicare

28% of new residents, usually for short-term rehab.

Typical stay 15 days

Private pay

42% of new residents, often for short stays.

Typical stay 1 - 2 months

Medicaid

30% of new residents, often for long-term daily care.

Typical stay 1 - 2 years

Facility Characteristics

Source: CMS Long-Term Care Facility Characteristics (Data as of Jan 2026)

Total residents 70
Medicare
3
4.3% of residents
Medicaid
49
70% of residents
Private pay or other
18
25.7% of residents
Programs & Services
Residents Group

Residents meet regularly to discuss policies, care quality, and activities

Family Member Group

Family members meet regularly to discuss policies, care quality, and activities

Nurse Aide Training

State-approved Nurse Aide Training and Competency Evaluation Program on-site

Active Family Council

Organized group of family members that meets regularly to discuss facility policies, resident care, and activities.

Active Resident Council

Organized group of residents that meets regularly to discuss facility policies, quality of life, and activities.

Finances and operations

Based on CMS SNF Cost Report for fiscal year ending in 12/2023.

Government
Operated by federal authorities.
Net patient revenue Info Net patient revenue — what the home actually collects for resident care, after contractual allowances, bad debt and discounts are subtracted from its gross charges (CMS cost report, Worksheet G-3). It covers resident care only; money the home earns from other sources is shown separately as "Other income."
$10.6M
Net patient income Info Net patient income: net patient revenue minus the home's total operating expenses. A positive figure means it earns more from resident care than it spends to deliver it; a negative figure means the opposite. It excludes non-operating "other income."
-$4.0M
Government Operated by federal authorities.
Net patient revenue Info Net patient revenue — what the home actually collects for resident care, after contractual allowances, bad debt and discounts are subtracted from its gross charges (CMS cost report, Worksheet G-3). It covers resident care only; money the home earns from other sources is shown separately as "Other income."
$10.6M Rank #79 / 143Revenue — State benchmarkedThis home is ranked 79th out of 143 homes in Michigan. Shows this facility's annual revenue compared to the Michigan average. Higher revenue generally means more resources for staffing and capital — read alongside Payroll %.Rankings are based only on facilities in Michigan that report data for that category. Facilities without available data are excluded from the ranking.Click the rank badge to see the full State ranking.Click here to see the full State ranking.
Net patient income Info Net patient income: net patient revenue minus the home's total operating expenses. A positive figure means it earns more from resident care than it spends to deliver it; a negative figure means the opposite. It excludes non-operating "other income."
-$4.0M
Other income Info Money the home earns outside of resident care — such as investments, grants, rentals and other non-operating sources (CMS cost report, Worksheet G-3). It is tracked separately from net patient revenue: it is not part of that figure, and it is not included in net patient income.
$4.1M
Payroll costs Info Staff salaries plus wage-related costs — benefits such as payroll taxes, health insurance and retirement — from the home's own accounting records (CMS cost report, Worksheet A). Contract or agency labor is counted separately, under other operating costs. Rank #29 / 143Payroll — State benchmarkedThis home is ranked 29th out of 143 homes in Michigan. Shows total annual staff payroll benchmarked to the Michigan average. Higher payroll investment relative to peers often signals better staffing and less reliance on cheaper contract labor.Rankings are based only on facilities in Michigan that report data for that category. Facilities without available data are excluded from the ranking.Click the rank badge to see the full State ranking.Click here to see the full State ranking.
$10.2M 96.3% of net patient revenue Info Payroll as a share of revenue: staff salaries and wage-related benefits divided by net patient revenue. A higher figure means more of each revenue dollar goes to staff pay. Rank #6 / 143Payroll % — State benchmarkedThis home is ranked 6th out of 143 homes in Michigan. Shows payroll as a percentage of revenue versus the Michigan average. Well-run Michigan facilities typically land around 49–59% — the top third Statewide. Below 25% may signal understaffing or heavy agency use — read with Staffing ratings.Rankings are based only on facilities in Michigan that report data for that category. Facilities without available data are excluded from the ranking.Click the rank badge to see the full State ranking.Click here to see the full State ranking.
Other operating costs Info Everything it costs to run the home apart from payroll — food, utilities, supplies, maintenance, contract labor and administration. Calculated as total operating expense minus payroll (staff salaries and wage-related benefits).
$4.4M
Total costs Info The home's total operating expense for the year — all the costs of running it, salaries included (CMS cost report, Worksheet G-3).
$14.6M

What does this home offer?

Building type icon
Building type icon

Building Type: Single-story

Beauty services icon

Beauty Services

Social and recreational activities icon

Social and Recreational Activities

Rehabilitative support icon

Rehabilitative Support

On-site medical care and health services icon

On-site Medical Care and Health Services

Who this home usually serves

TYPE OF STAY

Mostly long-term care residents

Most residents stay for extended periods and receive ongoing daily care.

New residents most often arrive under private pay (42% of admissions), and a typical private pay stay runs around 1 - 2 months.

Admissions
137 total

Coverage residents most often arrive under.

Medicare 28%
Private pay 42%
Medicaid 30%
Discharges
136 total

Coverage residents most often leave under.

Medicare 17%
Private pay 40%
Medicaid 43%

Places of interest near Oakview Medical Care Facility

Address 1.4 miles from city center Info Estimated distance in miles from Ludington's city center to Oakview Medical Care Facility's address, calculated via Google Maps.

Calculate Travel Distance to Oakview Medical Care Facility

Add your location

Address

Compare Nursing Homes around Ludington

The information below is reported by the Michigan Department of Licensing and Regulatory Affairs (LARA).

2 facilities compared · CMS & MI Dept. of Health data

Oakview Medical Care Facility
NH
MC
Ludington
96
Facility 96
MI AVG 75
Rank #143 / 435
72.6%
Facility 72.6%
MI AVG 75.8%
Rank #110 / 395
-4%
5.68
Facility 5.68
MI AVG 4.30
Rank #8 / 142
+34%+32%
$0
Facility $0
MI AVG $87.6k
Rank #1 / 145
8
Facility 8
MI AVG 33.5
Rank #8 / 144
2.7
Facility 2.7
MI AVG 5.2
Rank #12 / 144
-70-
42
Facility 42
MI AVG 39
Rank #300 / 703
County Of Mason
$10.6M
Facility $10.6M
MI AVG $15.8M
Rank #79 / 143
$10.2M
Facility $10.2M
MI AVG $5.6M
Rank #29 / 143
96.3%
Facility 96.3%
MI AVG 39%
Rank #6 / 143
235072
Medilodge of Ludington
NH
PC
Ludington
93
Facility 93
MI AVG 75
Rank #154 / 435
67.7%
Facility 67.7%
MI AVG 75.8%
Rank #134 / 395
-11%
3.78
Facility 3.78
MI AVG 4.30
Rank #94 / 142
+71%-12%
$62.2k
Facility $62.2k
MI AVG $87.6k
Rank #116 / 145
37
Facility 37
MI AVG 33.5
Rank #90 / 144
3.1
Facility 3.1
MI AVG 5.2
Rank #25 / 144
463A+
33
Facility 33
MI AVG 39
Rank #404 / 703
-
$8.3M
Facility $8.3M
MI AVG $15.8M
Rank #107 / 143
$4.6M
Facility $4.6M
MI AVG $5.6M
Rank #114 / 143
55.6%
Facility 55.6%
MI AVG 39%
Rank #90 / 143
235358

Financial Assistance for
Nursing Home in Michigan

Oakview Medical Care Facility is located in Ludington, Michigan.
Here are the financial assistance programs available to residents in Michigan.

Get Financial aid guidance

MI Choice Waiver

Michigan Medicaid MI Choice Waiver

Age 65+ or disabled
General Michigan resident, Medicaid- eligible, nursing home-level care need.
Income Limits (2025) ~$2,829/month 300% FBR, individual
Asset Limits $2,000 (individual), $3,000 (couple).
MI

Delivered through regional waiver agents; waitlists possible.

Benefits
Personal care (5-7 hours/day) Respite care (240 hours/year) Home modifications ($1,500 avg.) Adult day care ($65/day)

Home Help Program

Michigan Home Help

Age 65+ or disabled
General Michigan resident, Medicaid- eligible or low-income.
Income Limits ~$1,732/month individual, Medicaid threshold
Asset Limits $2,000 individual
MI

Can hire family caregivers; less intensive than waiver.

Benefits
Personal care (up to 60 hours/month) Homemaker services Respite (varies)

Program of All-Inclusive Care for the Elderly (PACE)

Michigan PACE

Age 55+
General Michigan resident, nursing home-level care need, safe with PACE support.
Income Limits (2025) ~$2,829/month (Medicaid-eligible); private pay option available.
Asset Limits $2,000 (individual), $3,000 (couple).
MI

16 PACE centers (e.g., Ingham, Wayne counties); expanding slowly.

Benefits
Personal care (5-7 hours/day) Medical care Meals Transportation Therapy Respite

Medicare Savings Program (MSP)

Michigan Medicare Savings Program

Age 65+ or disabled
General Michigan resident, Medicare Part A/B.
Income Limits (2025) ~$2,510/month (QMB), ~$3,380/month (SLMB), ~$3,598/month (QI)—individual.
Asset Limits $9,430 (individual), $14,130 (couple).
MI

Three tiers; no waitlist; includes Extra Help for Part D.

Benefits
Covers Part B premiums ($174.70/month) Deductibles ($240/year) Copays (~20%)

National Family Caregiver Support Program (NFCSP) Respite

Michigan NFCSP Respite Care

Age
General Caregivers of 60+ needing care or 55+ caregivers of others; Michigan resident; functional needs (2+ ADLs).
Income Limits (2025) Prioritizes ~$24,980/year (individual); no strict cap.
Asset Limits Not assessed; need-based.
MI

16 AAAs; prioritizes low-income, rural caregivers.

Benefits
Respite (4-6 hours/week or 5 days/year) Adult day care ($60/day) Caregiver training

VA Aid and Attendance (A&A) and Housebound Benefits

Michigan VA Aid and Attendance/Housebound

Age 65+ or disabled veteran/spouse
General Michigan resident, wartime service, need for ADL help (A&A) or homebound.
Income Limits (2025) Net income < ~$1,984/month (veteran with dependent, A&A); pension offsets income.
Asset Limits ~$155,356 net worth limit
MI

High veteran demand in urban/rural areas.

Benefits
Cash (~$1,433-$2,642/month veteran, ~$951-$1,318 spouse) for care costs

Frequently Asked Questions about Oakview Medical Care Facility

Is Oakview Medical Care Facility in a walkable area?

Oakview Medical Care Facility has a walk score of 42. Somewhat walkable. A few nearby services may be reachable on foot, but most trips require transportation.

What is the occupancy rate at Oakview Medical Care Facility?

Oakview Medical Care Facility's occupancy is 72.6%.

Is Oakview Medical Care Facility a government-operated facility?

Oakview Medical Care Facility is a government-operated nursing facility.

Are there photos of Oakview Medical Care Facility?

Yes — there are 3 photos of Oakview Medical Care Facility in the photo gallery on this page.

What is the address of Oakview Medical Care Facility?

Oakview Medical Care Facility is located at 1001 Diana St, Ludington, MI 49431.

What is the phone number of Oakview Medical Care Facility?

(231) 845-5185 will put you in contact with the team at Oakview Medical Care Facility.

Is Oakview Medical Care Facility Medicare or Medicaid certified?

Yes — Oakview Medical Care Facility is a CMS-certified provider of Medicare and Medicaid.

Guides for Better Senior Living

Care Cost Calculator: See Prices in Your Area

Nursing Home Data Explorer

Don’t Wait Too Long: 7 Red Flag Signs Your Parent Needs Assisted Living Now

The True Cost of Assisted Living in 2025 – And How Families Are Paying For It

Understanding Senior Living Costs: Pricing Models, Discounts & Financial Assistance