Medilodge of Ludington
Nursing Home · Ludington, MI
CMS overall rating Info The Overall CMS Rating is scored from 1 to 5 stars and combines results from health inspections, staffing levels, and quality measures. Health inspections carry the most weight. Staffing and quality scores can increase or decrease the final rating based on performance compared to state and national standards.

Medilodge of Ludington

Nursing Home · Ludington, MI
CMS overall rating Info The Overall CMS Rating is scored from 1 to 5 stars and combines results from health inspections, staffing levels, and quality measures. Health inspections carry the most weight. Staffing and quality scores can increase or decrease the final rating based on performance compared to state and national standards.
Calculator: See prices in your area
Medilodge of Ludington accepts Medicare, Medicaid, and private pay.

Overview of Medilodge of Ludington

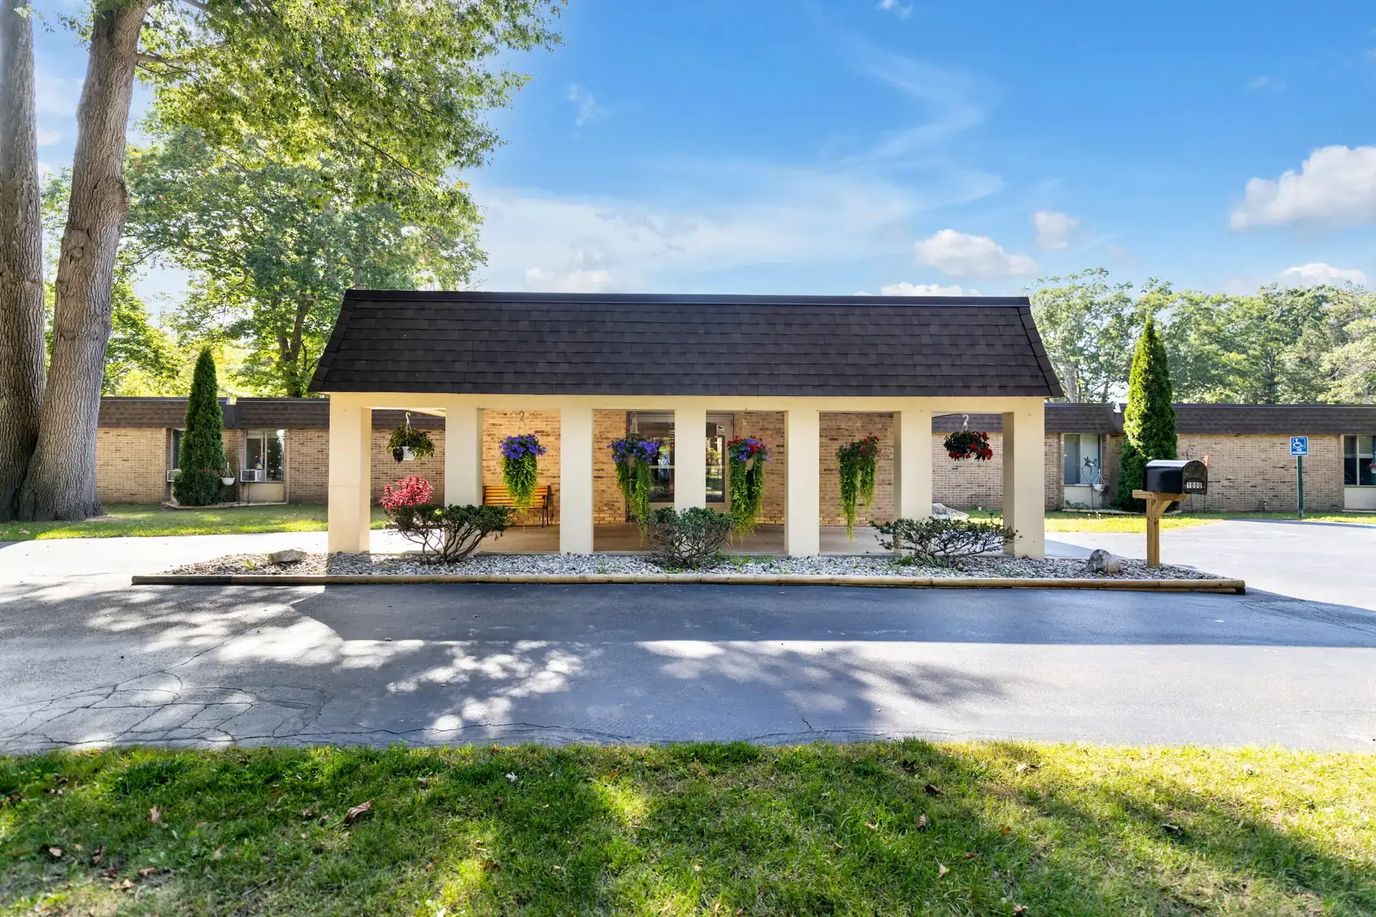
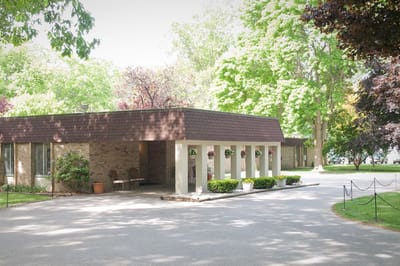
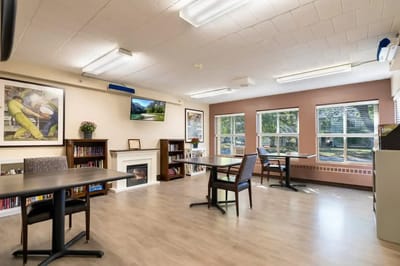
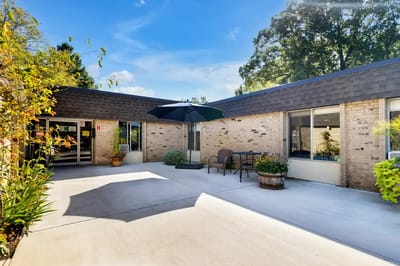
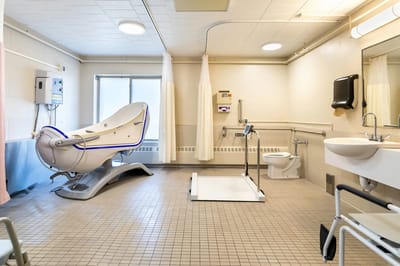
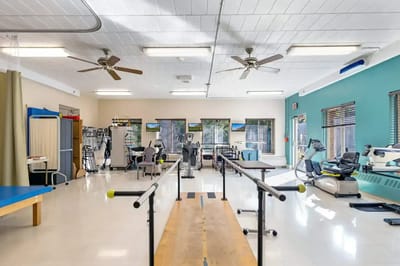
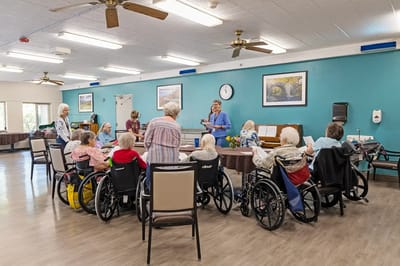
Set in the idyllic neighborhood of East Tinkham Avenue, Ludington, MI, is the distinguished senior living community of Medilodge of Ludington that focuses on long-term care and short-term rehabilitation services. With its comprehensive care services, the community ensures seniors can easily find the care and assistance they need and prefer without hassles. Moreover, families keep their peace of mind knowing a kind and reliable team handles their daily living activities 24/7.

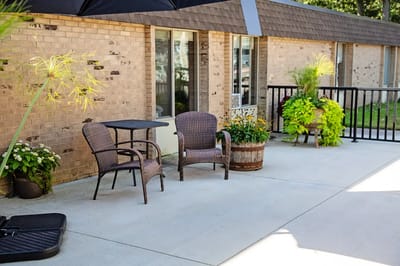
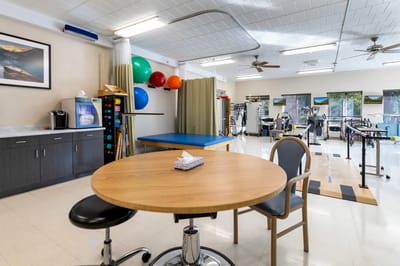
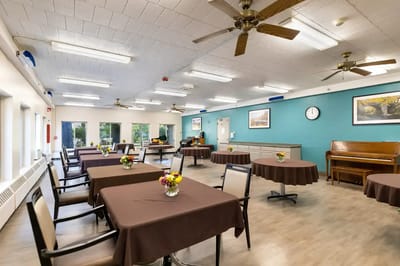
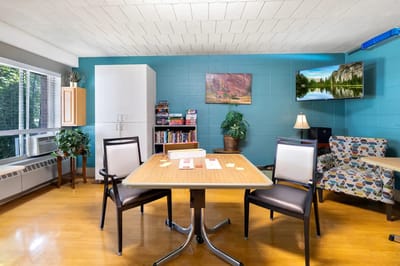
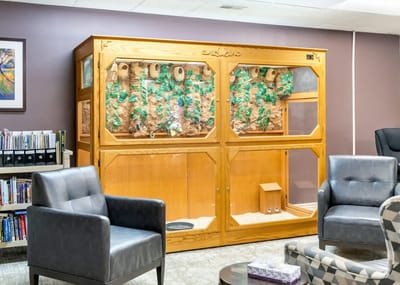
Aside from its specialized care programs, the community orchestrates a variety of enriching activities and engaging programs to maintain an active and blissful lifestyle. Its campus is purposely designed to foster comfort and convenience, ensuring residents adapt to their environment and mingle with various people.

(231) 845-6291

Quality ratings

Measured by Centers for Medicare & Medicaid Services (CMS)

Overall rating Info The Overall CMS Rating combines results from health inspections, staffing levels and quality measures. Health inspections carry the most weight. Staffing and quality scores can increase or decrease the final rating based on performance compared to state and national standards.
▼ 43.7% Below MI avg. ▼ 43.7% Below MI avg.Click the badge to see the full State ranking.Click here to see the full State ranking.
Health Inspection Info Based on the results of the facility's three most recent standard inspections and any complaint investigations. CMS reviews the number, scope, and severity of deficiencies, with more recent findings weighted more heavily.
▼ 39.9% Below MI avg. ▼ 39.9% Below MI avg.Click the badge to see the full State ranking.Click here to see the full State ranking.
Staffing Info Measures average nursing staff hours per resident per day, including Registered Nurses (RNs) and total nursing staff. Ratings are adjusted based on the level of care residents require and are compared to state and national benchmarks.
▲ 19.0% Above MI avg. ▲ 19.0% Above MI avg.Click the badge to see the full State ranking.Click here to see the full State ranking.
Quality Measures Info Based on clinical and physical health indicators reported to CMS, such as hospital readmissions, falls, pressure ulcers, and improvements in mobility. These measures reflect how well residents' health needs are being managed.
▼ 47.5% Below MI avg. ▼ 47.5% Below MI avg.Click the badge to see the full State ranking.Click here to see the full State ranking.

Staffing hours breakdown

Info Daily nursing hours per resident by staff type, reported to CMS. Higher is generally better — compare this facility to state and national averages to see where staffing stands.

Hours per resident per day — compared to Michigan state averages

Total nursing care / resident Info This home is ranked 90th out of 133 homes in Michigan. Total adjusted nursing hours per resident per day, combining RN, LPN, and aide time. CMS adjusts this for case-mix so facilities can be fairly compared.
3h 47m per day
Rank #90 / 133Nurse hours — State benchmarkedThis home is ranked 90th out of 133 homes in Michigan. Shows adjusted nurse hours per resident per day benchmarked to the Michigan average, with a ranking across 133 Michigan SNFs. More hours mean more direct care. The national average is about 3.5 hrs; below 3.0 is a red flag.Click the rank badge to see the full State ranking.Click here to see the full State ranking.
This facility Michigan avg (4h 15m per day)
vs Michigan avg
-11%

4 of 6 metrics below state avg

Standout metric Registered Nurse (RN) is +67% above state avg
Staff typeHours / Day / Residentvs state avg
Registered Nurse (RN) Info RNs hold the highest nursing license and can assess residents, interpret test results, and direct care plans. More RN hours per day often signals stronger clinical oversight and faster response to health changes. 1h 17m per day ▲ 67% State avg: 46m per day · National avg: 41m per day
LPN / LVN Info Licensed Practical Nurses (LPNs) or Licensed Vocational Nurses (LVNs) deliver routine hands-on care — medication administration, wound dressing, and monitoring vital signs. They work under RN supervision and make up a large share of daily bedside care. 13m per day ▼ 75% State avg: 53m per day · National avg: 52m per day
Nurse Aide Info Certified Nurse Aides (CNAs) provide the most direct day-to-day assistance: bathing, dressing, feeding, and mobility. Nurse aide hours are typically the largest staffing category and directly affect residents' quality of life. 2h 15m per day ▼ 6% State avg: 2h 23m per day · National avg: 2h 21m per day
Total Nursing (Weekend) Info Combined nursing hours (RN + LPN + Nurse Aide) per resident per day on weekends. Staffing often drops on weekends — this figure reveals whether the facility maintains adequate coverage outside of weekday hours. 2h 50m per day ▼ 19% State avg: 3h 31m per day · National avg: 3h 26m per day
Physical Therapist Info Hours per resident per day provided by licensed Physical Therapists (PTs) or PT Assistants. PT services help residents recover mobility after injury or illness and are especially important for post-acute (short-stay) rehabilitation. 3m per day ▼ 25% State avg: 4m per day · National avg: 4m per day
RN (Weekend) Info Registered nurse hours specifically on weekends. Facilities sometimes reduce RN presence on Saturdays and Sundays — a low weekend RN figure compared to weekday hours can indicate reduced clinical oversight when most administrative staff are absent. 46m per day ▲ 59% State avg: 29m per day · National avg: 29m per day

Types of Care at Medilodge of Ludington

Nursing Home

Capacity and availability

This home usually has availability

Occupancy lower than 85% suggests more openings may be available.

Lower occupancy than the Michigan average: 75.8%
Occupancy rate 71.1% Rank #80 / 135Occupancy rate — State benchmarkedThis home is ranked 80th out of 135 homes in Michigan. Shows this facility's occupancy rate versus the Michigan average, with its Statewide rank out of 135. Higher occupancy signals strong local demand and financial stability.Click the rank badge to see the full State ranking.Click here to see the full State ranking.
Avg. Length of Stay 61 days
Occupancy rate
71.1% Rank #80 / 135Occupancy rate — State benchmarkedThis home is ranked 80th out of 135 homes in Michigan. Shows this facility's occupancy rate versus the Michigan average, with its Statewide rank out of 135. Higher occupancy signals strong local demand and financial stability.Click the rank badge to see the full State ranking.Click here to see the full State ranking.
Avg. Length of Stay
61 days
Years in operation
33 years in operation Rank #8 / 38Years in operation — State benchmarkedThis home is ranked 8th out of 38 homes in Michigan. Shows how long this facility has been in operation compared to other Michigan SNFs. Longer operating histories may benefit residents, families, and staff.Click the rank badge to see the full State ranking.Click here to see the full State ranking.
A longer operating history, which may indicate experience navigating regulations and delivering ongoing care.
Walk Score
Walk Score: 33 / 100 Rank #76 / 137Walk Score — State benchmarkedThis home is ranked 76th out of 137 homes in Michigan. Shows how walkable this facility's neighborhood is compared to the average Walk Score across Michigan SNFs. Higher scores benefit residents, families, and staff.Click the rank badge to see the full State ranking.Click here to see the full State ranking.
Somewhat walkable. A few nearby services may be reachable on foot, but most trips require transportation.
BBB Rating
BBB Rating: A+ (Not Accredited)
An independent rating from the Better Business Bureau based on factors such as complaint history, transparency, and business practices.
How BBB ratings work

About this community

Staffing

Key information about the people who lead and staff this community.

Leadership

ContactMr. Dan McKinnon, Co-Owner

Therapy & Rehabilitation

1 service
Rehabilitation Services

Amenities & Lifestyle

Rehabilitation / Therapy Center
On-Site Medical Director
On-Site Podiatrist
On-Site Dentist
On-Site Salon / Spa Services
On-Site Religious Services
State-Of-The-Art Therapy Equipment
Pet Therapy
Wifi Accessibility
Fine Dining With Gourmet Menus
Warmly Decorated Private And Semi-Private Rooms
In-Room Free Cable Service
Private Phones
In-Room Phones (Arranged By Family)
Manicured Gardens
Outdoor Courtyard
Comfortable Family / Resident Lounge
Specific ProgramsRenal Disease Services, Respiratory Services, Palliative Care Services, Infusion Therapies, Traditional/Long-Term Care, Post-Operative Care, Comprehensive Wound Care Therapies, Cancer Recovery Services, Digestive Disease Support
Religious ServicesYes

Dining & Nutrition

Food DescriptionFine dining with gourmet menus.

Contact Medilodge of Ludington

Inspection History

In Michigan, the Department of Licensing and Regulatory Affairs (LARA) conducts unannounced inspections and investigations to ensure long-term care facilities comply with state health codes.

Since 2022 · 4 years of data 37 deficiencies

Inspection Scorecard Info This scorecard compares key inspection, citation, and complaint metrics at this facility against the Michigan state average. Metrics rated ≥15% worse than average are highlighted in red; those ≥15% better are highlighted in green.

Since 2022 vs. Michigan state average
Overall vs. MI average 2 Worse Metrics worse than Michigan average:
• Total deficiencies (363% above)
• Deficiencies per year (365% above)
0 Better No metrics in this bucket.
Latest Inspection August 29, 2025 Complaint Investigation

Deficiencies Info Deficiencies are formal regulatory issues recorded during state inspections.

This FacilityMI Averagevs. MI Avg
Total deficiencies Info Formal regulatory issues recorded by inspectors across all inspection types. 378 This facility has 363% more total deficiencies than a typical Michigan nursing home (37 vs. MI avg 8).↑ 363% worse
Deficiencies per year Info Average deficiencies per year since 2022. 9.32 This facility has 365% more deficiencies per year than a typical Michigan nursing home (9.3 vs. MI avg 2).↑ 365% worse

Inspection Reports Summary Info An editor-reviewed summary of the themes and findings across this facility's recent inspection reports.

The most recent inspection on August 29, 2025, identified deficiencies related to failure to properly assess and treat two residents, resulting in emergency hospital transfers. Earlier inspections showed a pattern of issues involving resident care, including medication management, infection control, timely assistance, and staff competency, with substantiated complaints of verbal abuse and neglect. Main themes across reports included inadequate medical treatment, failure to follow care plans, medication errors, and insufficient infection prevention practices. Several complaint investigations were substantiated, including cases of verbal abuse, neglect, and improper nephrostomy tube care, but enforcement actions such as fines or license suspensions were not listed in the available reports. The inspection history indicates ongoing challenges with resident care and regulatory compliance, with no clear trend of sustained improvement.

Read the full inspection reports for this facility, including detailed findings and corrective actions.

Show Inspection Reports

Health Inspection History

Inspections Since 2022
Total health inspections 12

Michigan average 6.5


Last Health inspection on Aug 2025

Total health citations
37 Rank #87 / 135Health citations — State benchmarkedThis home is ranked 87th out of 135 homes in Michigan. Shows this facility's total health deficiency citations benchmarked to the Michigan State average, with a ranking across all 135 MI SNFs. Lower citation counts earn a better rank.Click the rank badge to see the full State ranking.Click here to see the full State ranking.

Michigan average 33.5

Citations per inspection
3.08 Rank #25 / 135Citations per inspection — State benchmarkedThis home is ranked 25th out of 135 homes in Michigan. Shows average deficiency citations per CMS inspection for this facility versus the Michigan mean across 135 SNFs with citation data. Lower is better.Click the rank badge to see the full State ranking.Click here to see the full State ranking.

Michigan average 5.18


Health citations are formal notices following inspections when they fail to comply with safety and care standards.

9 of 37 citations resulted from standard inspections; 26 of 37 resulted from complaint investigations; and 2 of 37 came from combined inspections (standard and complaint).

Breakdown of citation severity (last 4 years)
Critical Health citations
0
100% better than Michigan average

Michigan average: 0.3


Serious Health citations
4 Rank #67 / 92Serious citations (G–I) — State benchmarkedThis home is ranked 67th out of 92 homes in Michigan. Shows G–I scope serious health citations for this facility versus other Michigan SNFs. Lower counts rank better.Click the rank badge to see the full State ranking.Click here to see the full State ranking.
111% worse than Michigan average

Michigan average: 1.9

0 critical citations Michigan average: 0.3

4 serious citations Michigan average: 1.9

33 moderate citations Michigan average: 30.8

0 minor citations Michigan average: 0.5
Citations history (last 4 years)
Quality of Care serious citation Aug 29, 2025
Corrected

Abuse/Neglect moderate citation Jul 09, 2025
Corrected

Nursing Services moderate citation Apr 18, 2025
Corrected

Quality of Care serious citation Apr 18, 2025
Corrected

Staffing Data

Reporting period: October 1 – December 31, 2025 (Q4 2025). Source: CMS Payroll-Based Journal report.

Total staff 126
Employees 112
Contractors 14
Staff to resident ratio 1.54:1
12% worse than Michigan average
Michigan average ratio: 1.75:1 Michigan average ratio: 1.75:1See full Michigan ranking
Avg staff/day 47
Average shift 8.2 hours
0% compared with Michigan average
Michigan average: 7.9 hours Michigan average shift: 7.9 hoursSee full Michigan ranking
Total staff hours (quarter) 35,537

Nursing staff breakdown

Q4 2025 · Oct 1 – Dec 31 More info This data comes from the CMS Payroll-Based Journal report covering October 1 – December 31, 2025.
Registered Nurse

Manages medical care and health needs.

Total count 22
Average shift length Info Average shift length. Calculated as total hours divided by days worked and average staff per day. 8.4 hours

No contractors work on this role.

Licensed Practical Nurse

Assists with medical care and medications.

Total count 5
Average shift length Info Average shift length. Calculated as total hours divided by days worked and average staff per day. 9.8 hours

No contractors work on this role.

Certified Nursing Assistant

Helps with daily care and mobility.

Total count 50
Average shift length Info Average shift length. Calculated as total hours divided by days worked and average staff per day. 8.1 hours

No contractors work on this role.

Contractor staffing

Q4 2025 · Oct 1 – Dec 31 More info This data comes from the CMS Payroll-Based Journal report covering October 1 – December 31, 2025.

Total hours from contractors

7.4%

2,644 contractor hours this quarter

Physical Therapy Assistant: 4 Speech Language Pathologist: 3 Occupational Therapy Assistant: 2 Respiratory Therapy Technician: 2 Physical Therapy Aide: 1 Medical Director: 1 Qualified Social Worker: 1

Staff by category

Q4 2025 · Oct 1 – Dec 31 More info This data comes from the CMS Payroll-Based Journal report covering October 1 – December 31, 2025.
Certified Nursing Assistant5005016,14092100%8.1
Registered Nurse220226,48192100%8.4
Clinical Nurse Specialist130133,9676773%10.1
Licensed Practical Nurse5051,1898289%9.8
Other Dietary Services Staff4041,0898997%6.8
Speech Language Pathologist0339967986%7.1
Nurse Aide in Training9096645661%7.2
RN Director of Nursing1016556672%9.9
Nurse Practitioner1015805863%10
Physical Therapy Assistant0445157278%6.9
Mental Health Service Worker1015046368%8
Administrator1014886166%8
Dietitian1014395459%8.1
Occupational Therapy Aide3034365964%6.8
Physical Therapy Aide0114175762%7.3
Respiratory Therapy Technician0223556874%5.2
Qualified Social Worker0112632932%9.1
Dental Services Staff1012623134%8.4
Occupational Therapy Assistant022692022%3.4
Medical Director011292830%1
50 Certified Nursing Assistant
% of Days 100%
22 Registered Nurse
% of Days 100%
13 Clinical Nurse Specialist
% of Days 73%
5 Licensed Practical Nurse
% of Days 89%
4 Other Dietary Services Staff
% of Days 97%
3 Speech Language Pathologist
% of Days 86%
9 Nurse Aide in Training
% of Days 61%
1 RN Director of Nursing
% of Days 72%
1 Nurse Practitioner
% of Days 63%
4 Physical Therapy Assistant
% of Days 78%
1 Mental Health Service Worker
% of Days 68%
1 Administrator
% of Days 66%
1 Dietitian
% of Days 59%
3 Occupational Therapy Aide
% of Days 64%
1 Physical Therapy Aide
% of Days 62%
2 Respiratory Therapy Technician
% of Days 74%
1 Qualified Social Worker
% of Days 32%
1 Dental Services Staff
% of Days 34%
2 Occupational Therapy Assistant
% of Days 22%
1 Medical Director
% of Days 30%

Penalties and fines

Federal penalties imposed by CMS for regulatory violations, including civil money penalties (fines) and denials of payment for new Medicare/Medicaid admissions.

Source: CMS Penalties Database

No penalties in the past 3 years

No civil money penalties or payment denials were reported in the last 3 years.

Quality of care over time

These measures show how residents usually do over time at this home, based on health outcomes and preventive care.

High-risk clinical events score Info A composite score based on pressure ulcers, falls with injury, weight loss, walking ability decline, and activities of daily living decline. 11.5
37% worse than Michigan average

Michigan average: 8.4

Functional decline score Info A composite score based on activities of daily living decline, walking ability decline, and incontinence. 24.0
47% worse than Michigan average

Michigan average: 16.3

Long-stay resident measures
Below average Michigan avg: 4.1 Info CMS star rating based on long-stay quality measure performance. 5 stars = significantly above average, 1 star = significantly below average.
Need for Help with Daily Activities Increased Info Percent of long-stay residents whose need for help with daily activities has increased 14.3%
15% worse than Michigan average

Michigan average: 12.5%

Walking Ability Worsened Info Percent of long-stay residents whose ability to move independently worsened 26.2%
71% worse than Michigan average

Michigan average: 15.3%

Low Risk Residents with Bowel/Bladder Incontinence Info Percent of low risk long-stay residents who lose control of their bowels or bladder 31.6%
50% worse than Michigan average

Michigan average: 21.0%

Falls with Major Injury Info Percent of long-stay residents experiencing one or more falls with major injury 3.3%
5% worse than Michigan average

Michigan average: 3.2%

High Risk Residents with Pressure Ulcers Info Percent of long-stay high risk residents with pressure ulcers 5.4%
6% better than Michigan average

Michigan average: 5.7%

Urinary Tract Infection Info Percent of long-stay residents with a urinary tract infection 3.8%
124% worse than Michigan average

Michigan average: 1.7%

Lost Too Much Weight Info Percent of long-stay residents who lose too much weight 8.4%
49% worse than Michigan average

Michigan average: 5.7%

Depressive Symptoms Info Percent of long-stay residents who have depressive symptoms 6.5%
69% worse than Michigan average

Michigan average: 3.9%

Antipsychotic Use Info Percent of long-stay residents who received an antipsychotic medication 14.2%
5% better than Michigan average

Michigan average: 15.0%

Pneumococcal Vaccine Info Percent of long-stay residents assessed and appropriately given the pneumococcal vaccine 89.7%
6% worse than Michigan average

Michigan average: 94.9%

Influenza Vaccine Info Percent of long-stay residents assessed and appropriately given the seasonal influenza vaccine 74.0%
22% worse than Michigan average

Michigan average: 95.0%

Hospitalizations per 1,000 days Info Number of hospitalizations per 1,000 long-stay resident days. 2.61
50% worse than Michigan average

Michigan average: 1.74

ED visits per 1,000 days Info Number of outpatient emergency department visits per 1,000 long-stay resident days. 2.98
94% worse than Michigan average

Michigan average: 1.54

Short-stay resident measures
Average Michigan avg: 3.3 Info CMS star rating based on short-stay quality measure performance. 5 stars = much above average, 1 star = much below average.
Pneumococcal Vaccine Info Percent of short-stay residents assessed and appropriately given the pneumococcal vaccine 73.0%
12% worse than Michigan average

Michigan average: 82.5%

Antipsychotic medication increase Info Percent of short-stay residents who newly received an antipsychotic medication 3.2%
123% worse than Michigan average

Michigan average: 1.4%

Influenza Vaccine Info Percent of short-stay residents assessed and appropriately given the seasonal influenza vaccine 68.2%
14% worse than Michigan average

Michigan average: 79.5%

Re-hospitalized after SNF stay Info Percentage of short-stay residents who were re-hospitalized after their nursing home admission. 34.1%
41% worse than Michigan average

Michigan average: 24.2%

Emergency department visits Info Percentage of short-stay residents who had an outpatient emergency department visit. 14.8%
29% worse than Michigan average

Michigan average: 11.5%

Falls with major injury Info Percentage of SNF residents who experience falls with major injury during their stay. 1.0%
27% worse than Michigan average

Michigan average: 0.8%

Ability to care for self at discharge Info Percentage of residents at or above expected ability to care for themselves at discharge. 55.4%
In line with Michigan average

Michigan average: 53.7%

Successful return to home or community Info Rate of successful return to home or community from a skilled nursing facility. 60.3%
19% better than Michigan average

Michigan average: 50.6%

Breakdown by payment type

Medicare

21% of new residents, usually for short-term rehab.

Typical stay 25 days

Private pay

59% of new residents, often for short stays.

Typical stay 29 days

Medicaid

19% of new residents, often for long-term daily care.

Typical stay 7 months

Facility Characteristics

Source: CMS Long-Term Care Facility Characteristics (Data as of Jan 2026)

Total residents 82
Medicare
19
23.2% of residents
Medicaid
56
68.3% of residents
Private pay or other
7
8.5% of residents
Programs & Services
Residents Group

Residents meet regularly to discuss policies, care quality, and activities

Active Resident Council

Organized group of residents that meets regularly to discuss facility policies, quality of life, and activities.

Finances and operations

Privately-owned community
Operated by a business corporation.
Home revenue
$12.4M
Profit
$887.6K
Privately-owned community Operated by a business corporation.
Home revenue
$12.4M Rank #100 / 134Revenue — State benchmarkedThis home is ranked 100th out of 134 homes in Michigan. Shows this facility's annual revenue compared to the Michigan SNF average. Higher revenue generally means more resources for staffing and capital — read alongside Payroll %.Click the rank badge to see the full State ranking.Click here to see the full State ranking.
Profit
$887.6K
Payroll costs Info The portion of the home's budget spent on staff, including nurses, caregivers, and other employees who support care and operations. Rank #106 / 134Payroll — State benchmarkedThis home is ranked 106th out of 134 homes in Michigan. Shows total annual staff payroll benchmarked to the Michigan average. Higher payroll investment relative to peers often signals better staffing and less reliance on cheaper contract labor.Click the rank badge to see the full State ranking.Click here to see the full State ranking.
$4.6M
37.3% of revenue Rank #85 / 134Payroll % — State benchmarkedThis home is ranked 85th out of 134 homes in Michigan. Shows payroll as a percentage of revenue versus the Michigan average. Well-run Michigan SNFs typically land around 49–59% — the top third Statewide. Below 25% may signal understaffing or heavy agency use — read with Staffing ratings.Click the rank badge to see the full State ranking.Click here to see the full State ranking.
Other operating costs Info All remaining costs needed to run the home, such as food, utilities, building maintenance, supplies and administrative expenses.
$6.9M
Total costs $11.5M

What does this home offer?

Total residents icon

Total Residents: 93 Residents

Housing options icon

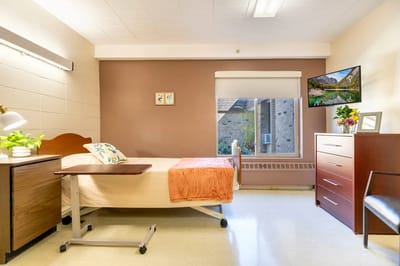
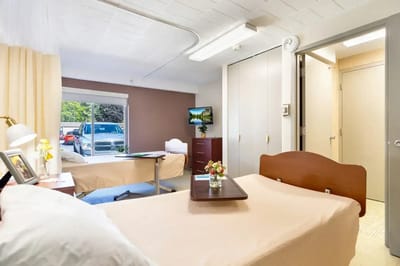
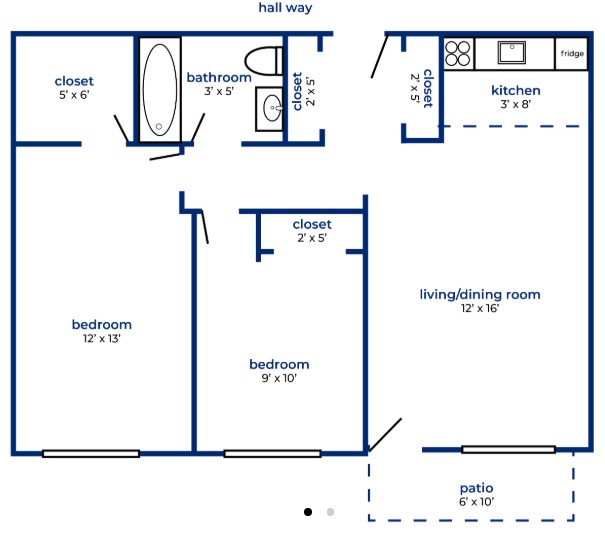
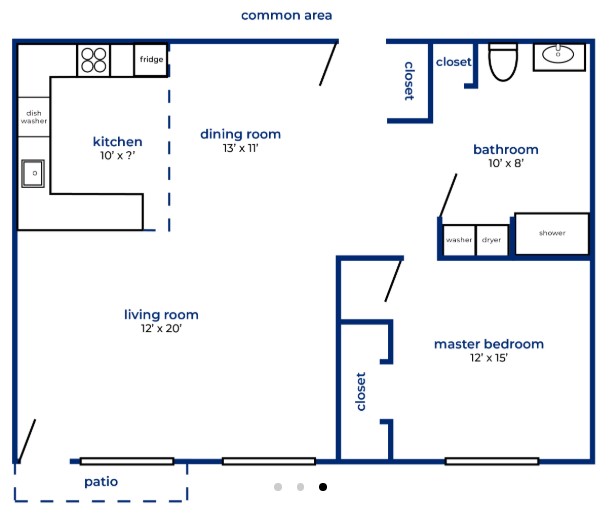
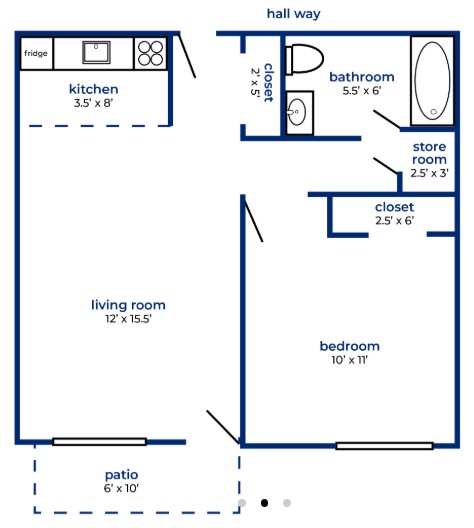
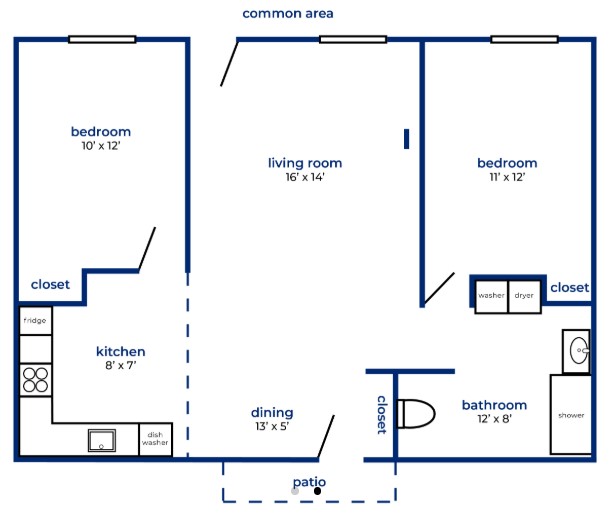
Housing Options: Private / Semi-Private Rooms

Building type icon
Building type icon

Building Type: Single-story

Who this home usually serves

TYPE OF STAY

Mix of rehab and long-term care

This home supports both short-term rehab and long-term care, with residents staying for a wide range of durations.

Living Spaces & Floor Plans for Medilodge of Ludington

Village House Of Ludington4
Village House Of Ludington7
Village House Of Ludington6
Village House Of Ludington5

Places of interest near Medilodge of Ludington

Address 1.7 miles from city center Info Estimated distance in miles from Ludington's city center to Medilodge of Ludington's address, calculated via Google Maps.

Calculate Travel Distance to Medilodge of Ludington

Add your location

Address

Financial Assistance for
Nursing Home in Michigan

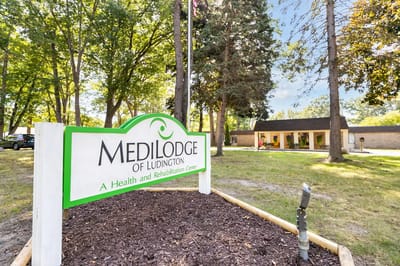
Medilodge of Ludington is located in Ludington, Michigan.
Here are the financial assistance programs available to residents in Michigan.

Get Financial aid guidance

MI Choice Waiver

Michigan Medicaid MI Choice Waiver

Age 65+ or disabled
General Michigan resident, Medicaid- eligible, nursing home-level care need.
Income Limits (2025) ~$2,829/month 300% FBR, individual
Asset Limits $2,000 (individual), $3,000 (couple).
MI

Delivered through regional waiver agents; waitlists possible.

Benefits
Personal care (5-7 hours/day) Respite care (240 hours/year) Home modifications ($1,500 avg.) Adult day care ($65/day)

Home Help Program

Michigan Home Help

Age 65+ or disabled
General Michigan resident, Medicaid- eligible or low-income.
Income Limits ~$1,732/month individual, Medicaid threshold
Asset Limits $2,000 individual
MI

Can hire family caregivers; less intensive than waiver.

Benefits
Personal care (up to 60 hours/month) Homemaker services Respite (varies)

Program of All-Inclusive Care for the Elderly (PACE)

Michigan PACE

Age 55+
General Michigan resident, nursing home-level care need, safe with PACE support.
Income Limits (2025) ~$2,829/month (Medicaid-eligible); private pay option available.
Asset Limits $2,000 (individual), $3,000 (couple).
MI

16 PACE centers (e.g., Ingham, Wayne counties); expanding slowly.

Benefits
Personal care (5-7 hours/day) Medical care Meals Transportation Therapy Respite

Medicare Savings Program (MSP)

Michigan Medicare Savings Program

Age 65+ or disabled
General Michigan resident, Medicare Part A/B.
Income Limits (2025) ~$2,510/month (QMB), ~$3,380/month (SLMB), ~$3,598/month (QI)—individual.
Asset Limits $9,430 (individual), $14,130 (couple).
MI

Three tiers; no waitlist; includes Extra Help for Part D.

Benefits
Covers Part B premiums ($174.70/month) Deductibles ($240/year) Copays (~20%)

National Family Caregiver Support Program (NFCSP) Respite

Michigan NFCSP Respite Care

Age
General Caregivers of 60+ needing care or 55+ caregivers of others; Michigan resident; functional needs (2+ ADLs).
Income Limits (2025) Prioritizes ~$24,980/year (individual); no strict cap.
Asset Limits Not assessed; need-based.
MI

16 AAAs; prioritizes low-income, rural caregivers.

Benefits
Respite (4-6 hours/week or 5 days/year) Adult day care ($60/day) Caregiver training

VA Aid and Attendance (A&A) and Housebound Benefits

Michigan VA Aid and Attendance/Housebound

Age 65+ or disabled veteran/spouse
General Michigan resident, wartime service, need for ADL help (A&A) or homebound.
Income Limits (2025) Net income < ~$1,984/month (veteran with dependent, A&A); pension offsets income.
Asset Limits ~$155,356 net worth limit
MI

High veteran demand in urban/rural areas.

Benefits
Cash (~$1,433-$2,642/month veteran, ~$951-$1,318 spouse) for care costs

Compare Nursing Home around Ludington

The information below is reported by the Michigan Department of Licensing and Regulatory Affairs (LARA).

3 facilities compared · CMS & MI Dept. of Health data

Filter by care type
Oakview Medical Care Facility
NH

Nursing Home Licensed facility providing 24/7 skilled nursing care for residents with complex, ongoing medical needs. Staffed by RNs, LPNs, and CNAs. Inspected and star-rated annually by CMS. Accepts Medicare (short-term rehab) and Medicaid (long-term care).

Ludington96 72.6% -4%5.68 +36%+32%$082.7-75- 42 County Of Mason$14.7M$10.8M73.1%235072
Medilodge of Ludington
NH

Nursing Home Licensed facility providing 24/7 skilled nursing care for residents with complex, ongoing medical needs. Staffed by RNs, LPNs, and CNAs. Inspected and star-rated annually by CMS. Accepts Medicare (short-term rehab) and Medicaid (long-term care).

AL

Assisted Living A licensed, long-term care setting for seniors or individuals with disabilities who need help with daily activities — like bathing, dressing, and medication management — but not 24-hour skilled nursing. Offers housing, meals, and around-the-clock support while aiming to maximize resident independence.

IL

Independent Living Lifestyle-focused communities for older adults offering dining, activities, and transportation with minimal personal care. Best for active, independent seniors who want community without medical support.

MC

Memory Care Secured, specialized care for people living with Alzheimer's or dementia. Staff trained in cognitive impairment, with higher staff-to-resident ratios and an environment designed to reduce confusion and wandering risk.

Ludington93 71.1% -6%3.78 +74%-12%$0373.1485A+ 33 -$12.4M$4.6M37.3%235358
Village House of Ludington
NH

Nursing Home Licensed facility providing 24/7 skilled nursing care for residents with complex, ongoing medical needs. Staffed by RNs, LPNs, and CNAs. Inspected and star-rated annually by CMS. Accepts Medicare (short-term rehab) and Medicaid (long-term care).

AL

Assisted Living A licensed, long-term care setting for seniors or individuals with disabilities who need help with daily activities — like bathing, dressing, and medication management — but not 24-hour skilled nursing. Offers housing, meals, and around-the-clock support while aiming to maximize resident independence.

IL

Independent Living Lifestyle-focused communities for older adults offering dining, activities, and transportation with minimal personal care. Best for active, independent seniors who want community without medical support.

Ludington12 71.1% -6%3.78 +74%-12%$0373.1485A+ 33 Village Manor Of Ludington, Inc.$12.4M$4.6M37.3%235358

Frequently Asked Questions about Medilodge of Ludington

Is Medilodge of Ludington in a walkable area?

Medilodge of Ludington has a walk score of 33. Somewhat walkable. A few nearby services may be reachable on foot, but most trips require transportation.

Are there photos of Medilodge of Ludington?

Yes — there are 22 photos of Medilodge of Ludington in the photo gallery on this page.

What is the address of Medilodge of Ludington?

Medilodge of Ludington is located at 1000 E Tinkham Ave, Ludington, MI 49431, United States.

What is the phone number of Medilodge of Ludington?

(231) 845-6291 will put you in contact with the team at Medilodge of Ludington.

Is Medilodge of Ludington Medicare or Medicaid certified?

Yes — Medilodge of Ludington is a CMS-certified provider of Medicare and Medicaid.

Guides for Better Senior Living

Care Cost Calculator: See Prices in Your Area

Nursing Home Data Explorer

Don’t Wait Too Long: 7 Red Flag Signs Your Parent Needs Assisted Living Now

The True Cost of Assisted Living in 2025 – And How Families Are Paying For It

Understanding Senior Living Costs: Pricing Models, Discounts & Financial Assistance

Explore Open Rooms
1 Contact details
2 What type of senior care service are you looking for?
3 What budget do you have in mind for senior care?
4 How soon do you need to find care?
5 Additional details

Thank you for your interest!

Our team will be in touch shortly to help with next steps.