Memory Care at Market Square
Nursing Home & Memory Care · South Paris, ME
CMS overall rating Info CMS (the Centers for Medicare & Medicaid Services) is the federal agency that rates nursing home quality. Its Overall Rating runs from 1 to 5 stars, combining health inspections, staffing, and quality measures, with inspections weighted most heavily.

Memory Care at Market Square

Nursing Home & Memory Care · South Paris, ME
CMS overall rating Info CMS (the Centers for Medicare & Medicaid Services) is the federal agency that rates nursing home quality. Its Overall Rating runs from 1 to 5 stars, combining health inspections, staffing, and quality measures, with inspections weighted most heavily.
Calculator: See prices in your area
Memory Care at Market Square accepts Medicare, Medicaid, and private pay.

Overview of Memory Care at Market Square

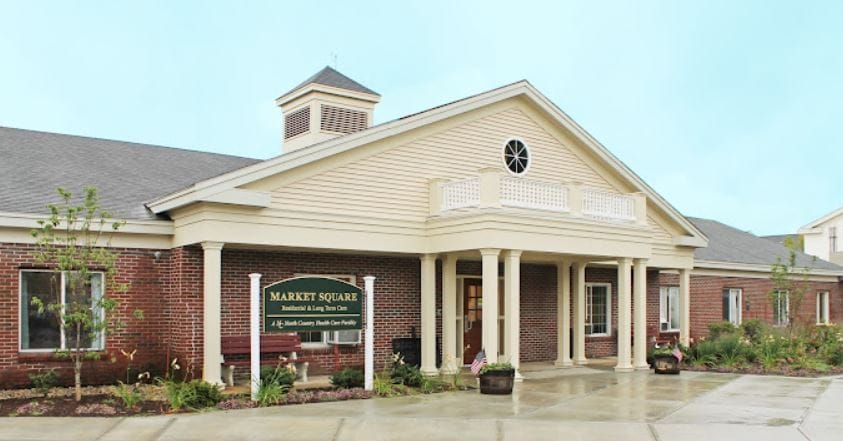
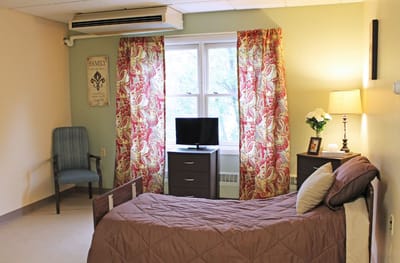
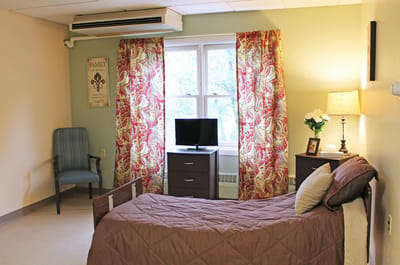
Specializing in memory care, the one-of-a-kind senior living community of Memory Care at Market Square situated in the vibrant neighborhood of Market Square, South Paris, ME, strives to provide a safe place for individuals with Alzheimer’s and related dementia. Keep peace of mind with the purposely built and snug accommodations in various semi-private rooms. Memory Care at Market Square goes above and beyond to provide top-notch care and support with a team of respectful and specially trained professionals for seniors to live with dignity and cherish every moment of their golden years.

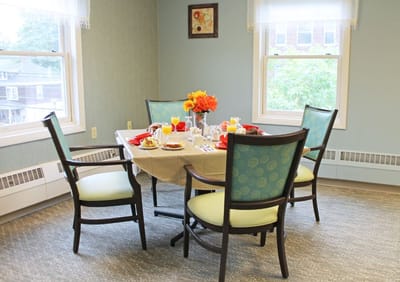
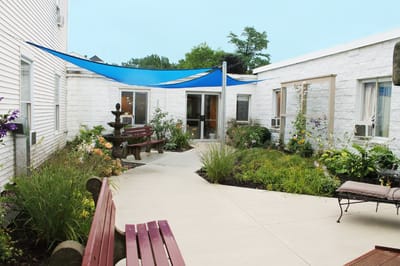
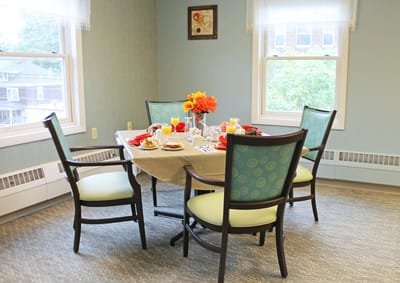
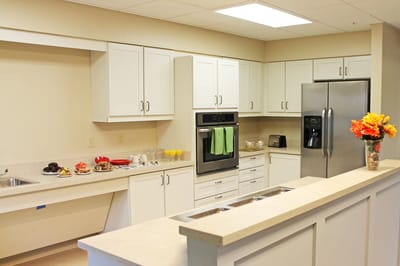
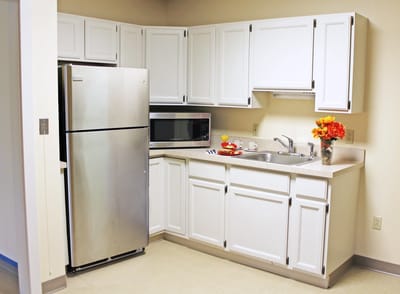
Gain meaningful experiences and remain well-engaged with the community through a jam-packed calendar of events and stimulating programs. Mingle with friends over healthy and tasty meals and satisfy your dietary needs and preferences. With its tranquil spaces and incredible amenities, Memory Care at Market Square is a good place for seniors to spend a wondrous retirement.

Quality ratings

Measured by Centers for Medicare & Medicaid Services (CMS)

Overall rating Info The Overall CMS Rating combines results from health inspections, staffing levels and quality measures. Health inspections carry the most weight. Staffing and quality scores can increase or decrease the final rating based on performance compared to state and national standards.
Health Inspection Info Based on the results of the facility's three most recent standard inspections and any complaint investigations. CMS reviews the number, scope, and severity of deficiencies, with more recent findings weighted more heavily.
Staffing Info Measures average nursing staff hours per resident per day, including Registered Nurses (RNs) and total nursing staff. Ratings are adjusted based on the level of care residents require and are compared to state and national benchmarks.
Quality Measures Info Based on clinical and physical health indicators reported to CMS, such as hospital readmissions, falls, pressure ulcers, and improvements in mobility. These measures reflect how well residents' health needs are being managed.

Staffing hours breakdown

Info Daily nursing hours per resident by staff type, reported to CMS. Higher is generally better — compare this facility to state and national averages to see where staffing stands.

Hours per resident per day — compared to state averages

Total nursing care / resident Info Total adjusted nursing hours per resident per day, combining RN, LPN, and aide time. CMS adjusts this for case-mix so facilities can be fairly compared.
4h 56m per day
Rank #8 / 34Nurse hours — State benchmarkedThis home is ranked 8th out of 34 homes in Maine. Shows adjusted nurse hours per resident per day benchmarked to the Maine average, with a ranking across 34 Maine facilities. More hours mean more direct care. The national average is about 3.5 hrs; below 3.0 is a red flag.Rankings are based only on facilities in Maine that report data for that category. Facilities without available data are excluded from the ranking.Click the rank badge to see the full State ranking.Click here to see the full State ranking.
vs avg

2 of 6 metrics below state avg

Standout metric LPN / LVN is +106% above state avg
Staff typeHours / Day / Residentvs state avg
Registered Nurse (RN) Info RNs hold the highest nursing license and can assess residents, interpret test results, and direct care plans. More RN hours per day often signals stronger clinical oversight and faster response to health changes. 41m per day ▼ 35% State avg: 1h 3m per day · National avg: 41m per day
LPN / LVN Info Licensed Practical Nurses (LPNs) or Licensed Vocational Nurses (LVNs) deliver routine hands-on care — medication administration, wound dressing, and monitoring vital signs. They work under RN supervision and make up a large share of daily bedside care. 56m per day ▲ 106% State avg: 27m per day · National avg: 52m per day
Nurse Aide Info Certified Nurse Aides (CNAs) provide the most direct day-to-day assistance: bathing, dressing, feeding, and mobility. Nurse aide hours are typically the largest staffing category and directly affect residents' quality of life. 3h 10m per day ▲ 11% State avg: 2h 51m per day · National avg: 2h 21m per day
Weekend Total Nursing Info Combined nursing hours (RN + LPN + Nurse Aide) per resident per day on weekends. Staffing often drops on weekends — this figure reveals whether the facility maintains adequate coverage outside of weekday hours. 4h 12m per day ▲ 7% State avg: 3h 55m per day · National avg: 3h 26m per day
Physical Therapist Info Hours per resident per day provided by licensed Physical Therapists (PTs) or PT Assistants. PT services help residents recover mobility after injury or illness and are especially important for post-acute (short-stay) rehabilitation. 7m per day ▲ 76% State avg: 4m per day · National avg: 4m per day
Weekend RN Info Registered nurse hours specifically on weekends. Facilities sometimes reduce RN presence on Saturdays and Sundays — a low weekend RN figure compared to weekday hours can indicate reduced clinical oversight when most administrative staff are absent. 22m per day ▼ 49% State avg: 44m per day · National avg: 29m per day

Capacity and availability

This home usually has availability

Lower occupancy than the state average
Occupancy rate
81.2% Rank #179 / 251Occupancy rate — State benchmarkedThis home is ranked 179th out of 251 homes in Maine. Shows this facility's occupancy rate versus the Maine average, with its Statewide rank out of 251. Higher occupancy signals strong local demand and financial stability.Rankings are based only on facilities in Maine that report data for that category. Facilities without available data are excluded from the ranking.Click the rank badge to see the full State ranking.Click here to see the full State ranking.
Avg. Length of Stay
138 days
Bed community size
76-bed community Rank #29 / 357Bed count — State benchmarkedThis home is ranked 29th out of 357 homes in Maine. Shows this facility's certified or reported bed count compared to other Maine facilities. Larger communities may offer more amenities, programs, and on-site services for residents and families.Rankings are based only on facilities in Maine that report data for that category. Facilities without available data are excluded from the ranking.Click the rank badge to see the full State ranking.Click here to see the full State ranking.
A larger shared setting that may offer more common spaces and organized community services.
Walk Score
Walk Score: 40 / 100 Rank #154 / 422Walk Score — State benchmarkedThis home is ranked 154th out of 422 homes in Maine. Shows how walkable this facility's neighborhood is compared to the average Walk Score across Maine facilities. Higher scores benefit residents, families, and staff.Rankings are based only on facilities in Maine that report data for that category. Facilities without available data are excluded from the ranking.Click the rank badge to see the full State ranking.Click here to see the full State ranking.
Somewhat walkable. A few nearby services may be reachable on foot, but most trips require transportation.

Therapy & Rehabilitation

2 services
Rehabilitation Services
Respite Care

Staffing & Medical

2 services
Nursing Services
24-Hour Staffing

Amenities & Lifestyle

Dining Room
Secure Courtyard
In-Room Kitchenette
Resident Rooms
Touring HoursMonday-Friday, 8:00-4:30

Contact Memory Care at Market Square

Staffing Data

Reporting period: October 1 – December 31, 2025 (Q4 2025). Source: CMS Payroll-Based Journal report.

Total staff 108
Employees 70
Contractors 38
Staff to resident ratio 1.59 : 1
0% compared with State average

State average ratio: 0 : 0

Avg staff/day 45
Average shift 8.7 hours
0% compared with State average

State average: 0 hours

Total staff hours (quarter) 35,911

Nursing staff breakdown

Q4 2025 · Oct 1 – Dec 31 More info This data comes from the CMS Payroll-Based Journal report covering October 1 – December 31, 2025.
Registered Nurse

Manages medical care and health needs.

RN Staff Info 6 total: 4 full-time employees and 2 contractors. 6
Average shift length Info Average shift length. Calculated as total hours divided by days worked and average staff per day. 9.9 hours
Licensed Practical Nurse

Assists with medical care and medications.

LPN Staff Info 16 total: 4 full-time employees and 12 contractors. 16
Average shift length Info Average shift length. Calculated as total hours divided by days worked and average staff per day. 10.3 hours
Certified Nursing Assistant

Helps with daily care and mobility.

CNA Staff Info 49 total: 38 full-time employees and 11 contractors. 49
Average shift length Info Average shift length. Calculated as total hours divided by days worked and average staff per day. 8.6 hours

Contractor staffing

Q4 2025 · Oct 1 – Dec 31 More info This data comes from the CMS Payroll-Based Journal report covering October 1 – December 31, 2025.

Total hours from contractors

35.3%

12,672 contractor hours this quarter

Licensed Practical Nurse: 12 Certified Nursing Assistant: 11 Respiratory Therapy Technician: 4 Physical Therapy Assistant: 3 Qualified Social Worker: 2 Registered Nurse: 2 Speech Language Pathologist: 1 Medical Director: 1 Occupational Therapy Aide: 1 Occupational Therapy Assistant: 1

Staff by category

Q4 2025 · Oct 1 – Dec 31 More info This data comes from the CMS Payroll-Based Journal report covering October 1 – December 31, 2025.
Certified Nursing Assistant38114917,11292100%8.6
Licensed Practical Nurse412165,34192100%10.3
Medication Aide/Technician6063,00192100%9.6
Registered Nurse4262,5079098%9.9
Clinical Nurse Specialist6061,2326571%8
Other Dietary Services Staff3031,1368896%7.5
Physical Therapy Assistant0331,0117986%6.2
Respiratory Therapy Technician0447426571%6.5
Dental Services Staff2027176470%6.9
Nurse Practitioner2025686065%7.9
RN Director of Nursing1015476368%8.7
Dietitian1014986065%8.3
Administrator1014645863%8
Mental Health Service Worker2024575257%8.8
Speech Language Pathologist0112704347%6.3
Qualified Social Worker0221132426%4.7
Occupational Therapy Aide0119878%14
Medical Director0116444%16
Occupational Therapy Assistant0113533%11.5
49 Certified Nursing Assistant
% of Days 100%
16 Licensed Practical Nurse
% of Days 100%
6 Medication Aide/Technician
% of Days 100%
6 Registered Nurse
% of Days 98%
6 Clinical Nurse Specialist
% of Days 71%
3 Other Dietary Services Staff
% of Days 96%
3 Physical Therapy Assistant
% of Days 86%
4 Respiratory Therapy Technician
% of Days 71%
2 Dental Services Staff
% of Days 70%
2 Nurse Practitioner
% of Days 65%
1 RN Director of Nursing
% of Days 68%
1 Dietitian
% of Days 65%
1 Administrator
% of Days 63%
2 Mental Health Service Worker
% of Days 57%
1 Speech Language Pathologist
% of Days 47%
2 Qualified Social Worker
% of Days 26%
1 Occupational Therapy Aide
% of Days 8%
1 Medical Director
% of Days 4%
1 Occupational Therapy Assistant
% of Days 3%

Penalties and fines

Federal penalties imposed by CMS for regulatory violations, including civil money penalties (fines) and denials of payment for new Medicare/Medicaid admissions.

Source: CMS Penalties Database

No penalties in the past 3 years

No civil money penalties or payment denials were reported in the last 3 years.

Quality of care over time

These measures show how residents usually do over time at this home, based on health outcomes and preventive care.

High-risk clinical events score Info A composite score based on pressure ulcers, falls with injury, weight loss, walking ability decline, and activities of daily living decline. 13.6
In line with State average

State average: 14.2

Functional decline score Info A composite score based on activities of daily living decline, walking ability decline, and incontinence. 24.3
17% better than State average

State average: 29.1

Long-stay resident measures
Significantly below average State avg: 2.6 Info CMS star rating based on long-stay quality measure performance. 5 stars = significantly above average, 1 star = significantly below average.
Need for Help with Daily Activities Increased Info Percent of long-stay residents whose need for help with daily activities has increased 22.2%
15% better than State average

State average: 26.0%

Walking Ability Worsened Info Percent of long-stay residents whose ability to move independently worsened 30.8%
In line with State average

State average: 31.4%

Low Risk Residents with Bowel/Bladder Incontinence Info Percent of low risk long-stay residents who lose control of their bowels or bladder 19.9%
33% better than State average

State average: 29.8%

Falls with Major Injury Info Percent of long-stay residents experiencing one or more falls with major injury 4.8%
9% worse than State average

State average: 4.4%

High Risk Residents with Pressure Ulcers Info Percent of long-stay high risk residents with pressure ulcers 7.6%
69% worse than State average

State average: 4.5%

Urinary Tract Infection Info Percent of long-stay residents with a urinary tract infection 3.5%
27% worse than State average

State average: 2.8%

Lost Too Much Weight Info Percent of long-stay residents who lose too much weight 2.9%
47% better than State average

State average: 5.5%

Depressive Symptoms Info Percent of long-stay residents who have depressive symptoms 18.9%
80% worse than State average

State average: 10.5%

Antipsychotic Use Info Percent of long-stay residents who received an antipsychotic medication 15.9%
20% better than State average

State average: 19.8%

Pneumococcal Vaccine Info Percent of long-stay residents assessed and appropriately given the pneumococcal vaccine 99.1%
10% better than State average

State average: 90.1%

Influenza Vaccine Info Percent of long-stay residents assessed and appropriately given the seasonal influenza vaccine 98.4%
In line with State average

State average: 95.5%

Hospitalizations per 1,000 days Info Number of hospitalizations per 1,000 long-stay resident days. 1.23
12% better than State average

State average: 1.39

ED visits per 1,000 days Info Number of outpatient emergency department visits per 1,000 long-stay resident days. 2.77
33% worse than State average

State average: 2.08

Short-stay resident measures
Significantly above average State avg: 3.3 Info CMS star rating based on short-stay quality measure performance. 5 stars = much above average, 1 star = much below average.
Pneumococcal Vaccine Info Percent of short-stay residents assessed and appropriately given the pneumococcal vaccine 91.0%
29% better than State average

State average: 70.8%

Antipsychotic medication increase Info Percent of short-stay residents who newly received an antipsychotic medication 0.0%
100% better than State average

State average: 1.4%

Influenza Vaccine Info Percent of short-stay residents assessed and appropriately given the seasonal influenza vaccine 89.8%
21% better than State average

State average: 74.5%

Re-hospitalized after SNF stay Info Percentage of short-stay residents who were re-hospitalized after their nursing home admission. 19.2%
6% better than State average

State average: 20.5%

Emergency department visits Info Percentage of short-stay residents who had an outpatient emergency department visit. 16.3%
In line with State average

State average: 15.6%

Falls with major injury Info Percentage of SNF residents who experience falls with major injury during their stay. 0.0%
100% better than State average

State average: 0.8%

Ability to care for self at discharge Info Percentage of residents at or above expected ability to care for themselves at discharge. 60.6%
13% better than State average

State average: 53.7%

Successful return to home or community Info Rate of successful return to home or community from a skilled nursing facility. 61.1%
21% better than State average

State average: 50.6%

Breakdown by payment type

Medicare

20% of new residents, usually for short-term rehab.

Typical stay 1 - 2 months

Private pay

63% of new residents, often for short stays.

Typical stay 4 - 5 months

Medicaid

17% of new residents, often for long-term daily care.

Typical stay 1 - 2 years

Facility Characteristics

Source: CMS Long-Term Care Facility Characteristics (Data as of Jan 2026)

Total residents 68
Medicare
12
17.6% of residents
Medicaid
50
73.5% of residents
Private pay or other
6
8.8% of residents
Programs & Services
Residents Group

Residents meet regularly to discuss policies, care quality, and activities

Active Resident Council

Organized group of residents that meets regularly to discuss facility policies, quality of life, and activities.

Finances and operations

Based on CMS SNF Cost Report for fiscal year ending in 12/2023.

For-profit
Individual
Net patient revenue Info Net patient revenue — what the home actually collects for resident care, after contractual allowances, bad debt and discounts are subtracted from its gross charges (CMS cost report, Worksheet G-3). It covers resident care only; money the home earns from other sources is shown separately as "Other income."
$10.0M
Net patient income Info Net patient income: net patient revenue minus the home's total operating expenses. A positive figure means it earns more from resident care than it spends to deliver it; a negative figure means the opposite. It excludes non-operating "other income."
-$614.3K
For-profit Individual
Net patient revenue Info Net patient revenue — what the home actually collects for resident care, after contractual allowances, bad debt and discounts are subtracted from its gross charges (CMS cost report, Worksheet G-3). It covers resident care only; money the home earns from other sources is shown separately as "Other income."
$10.0M Rank #22 / 40Revenue — State benchmarkedThis home is ranked 22nd out of 40 homes in Maine. Shows this facility's annual revenue compared to the Maine average. Higher revenue generally means more resources for staffing and capital — read alongside Payroll %.Rankings are based only on facilities in Maine that report data for that category. Facilities without available data are excluded from the ranking.Click the rank badge to see the full State ranking.Click here to see the full State ranking.
Net patient income Info Net patient income: net patient revenue minus the home's total operating expenses. A positive figure means it earns more from resident care than it spends to deliver it; a negative figure means the opposite. It excludes non-operating "other income."
-$614.3K
Other income Info Money the home earns outside of resident care — such as investments, grants, rentals and other non-operating sources (CMS cost report, Worksheet G-3). It is tracked separately from net patient revenue: it is not part of that figure, and it is not included in net patient income.
$672.4K
Payroll costs Info Staff salaries plus wage-related costs — benefits such as payroll taxes, health insurance and retirement — from the home's own accounting records (CMS cost report, Worksheet A). Contract or agency labor is counted separately, under other operating costs. Rank #32 / 40Payroll — State benchmarkedThis home is ranked 32nd out of 40 homes in Maine. Shows total annual staff payroll benchmarked to the Maine average. Higher payroll investment relative to peers often signals better staffing and less reliance on cheaper contract labor.Rankings are based only on facilities in Maine that report data for that category. Facilities without available data are excluded from the ranking.Click the rank badge to see the full State ranking.Click here to see the full State ranking.
$5.2M 51.8% of net patient revenue Info Payroll as a share of revenue: staff salaries and wage-related benefits divided by net patient revenue. A higher figure means more of each revenue dollar goes to staff pay. Rank #33 / 40Payroll % — State benchmarkedThis home is ranked 33rd out of 40 homes in Maine. Shows payroll as a percentage of revenue versus the Maine average. Well-run Maine facilities typically land around 60–66% — the top third Statewide. Below 25% may signal understaffing or heavy agency use — read with Staffing ratings.Rankings are based only on facilities in Maine that report data for that category. Facilities without available data are excluded from the ranking.Click the rank badge to see the full State ranking.Click here to see the full State ranking.
Other operating costs Info Everything it costs to run the home apart from payroll — food, utilities, supplies, maintenance, contract labor and administration. Calculated as total operating expense minus payroll (staff salaries and wage-related benefits).
$5.5M
Total costs Info The home's total operating expense for the year — all the costs of running it, salaries included (CMS cost report, Worksheet G-3).
$10.7M

What does this home offer?

Housing options icon

Housing Options: Semi-Private Rooms

Building type icon
Building type icon

Building Type: 2-story

Fitness and recreation icon

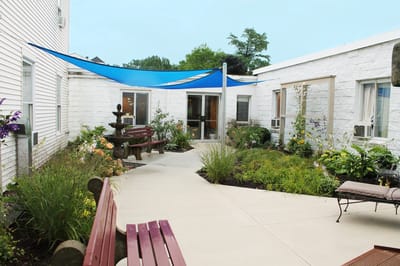
Fitness and Recreation

Who this home usually serves

TYPE OF STAY

Primarily short stays

Residents typically stay for brief periods, with frequent admissions and discharges throughout the year.

Most new residents arrive under private pay (63% of admissions), and a typical private pay stay runs around 4 - 5 months.

Admissions
167 total

Coverage residents most often arrive under.

Medicare 20%
Private pay 63%
Medicaid 17%
Discharges
164 total

Coverage residents most often leave under.

Medicare 23%
Private pay 59%
Medicaid 18%

Places of interest near Memory Care at Market Square

Address 0.1 miles from city center Info Estimated distance in miles from South Paris's city center to Memory Care at Market Square's address, calculated via Google Maps.

Calculate Travel Distance to Memory Care at Market Square

Add your location

Address

Frequently Asked Questions about Memory Care at Market Square

What neighborhood is Memory Care at Market Square in?

Memory Care at Market Square is in the South Paris neighborhood.

Is Memory Care at Market Square in a walkable area?

Memory Care at Market Square has a walk score of 40. Somewhat walkable. A few nearby services may be reachable on foot, but most trips require transportation.

What is the occupancy rate at Memory Care at Market Square?

Memory Care at Market Square's occupancy is 81.2%.

Does Memory Care at Market Square operate as a for-profit or non-profit?

Memory Care at Market Square is registered as a for-profit.

Are there photos of Memory Care at Market Square?

Yes — there are 9 photos of Memory Care at Market Square in the photo gallery on this page.

What is the address of Memory Care at Market Square?

Memory Care at Market Square is located at 3 Market Sq, South Paris, ME 04281.

What is the phone number of Memory Care at Market Square?

(207) 743-1575 will put you in contact with the team at Memory Care at Market Square.

Guides for Better Senior Living

Care Cost Calculator: See Prices in Your Area

Nursing Home Data Explorer

Don’t Wait Too Long: 7 Red Flag Signs Your Parent Needs Assisted Living Now

The True Cost of Assisted Living in 2025 – And How Families Are Paying For It

Understanding Senior Living Costs: Pricing Models, Discounts & Financial Assistance