Meth Wick Community
Nursing Home, Assisted Living, Independent Living, Memory Care, Nursing Care & Respite Care · Cedar Rapids, IA
CMS overall rating Info CMS (the Centers for Medicare & Medicaid Services) is the federal agency that rates nursing home quality. Its Overall Rating runs from 1 to 5 stars, combining health inspections, staffing, and quality measures, with inspections weighted most heavily.

Meth Wick Community

Nursing Home, Assisted Living, Independent Living, Memory Care, Nursing Care & Respite Care · Cedar Rapids, IA
CMS overall rating Info CMS (the Centers for Medicare & Medicaid Services) is the federal agency that rates nursing home quality. Its Overall Rating runs from 1 to 5 stars, combining health inspections, staffing, and quality measures, with inspections weighted most heavily.
Calculator: See prices in your area
Meth Wick Community accepts Medicare, Medicaid, and private pay.

Overview of Meth Wick Community

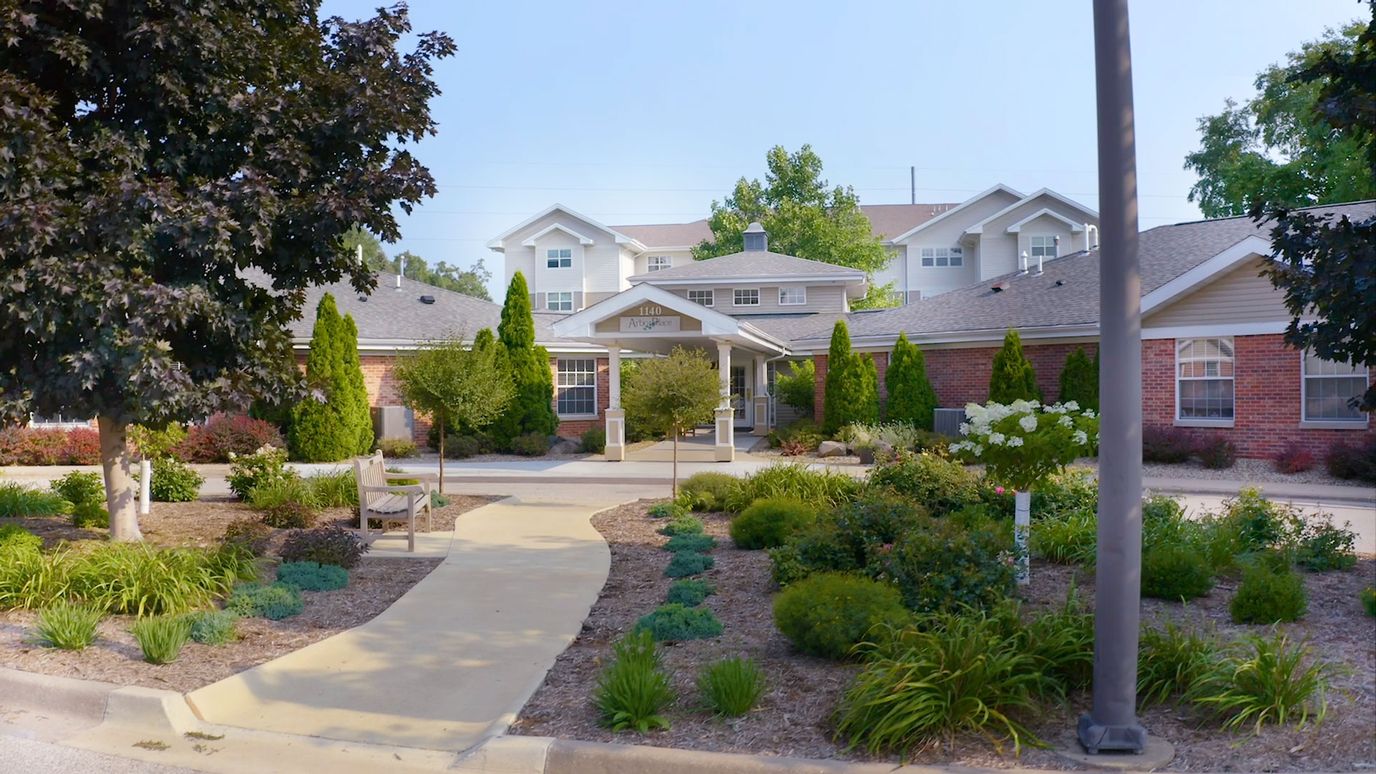
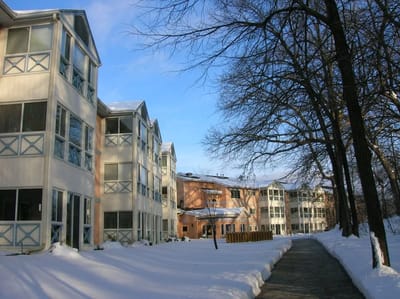
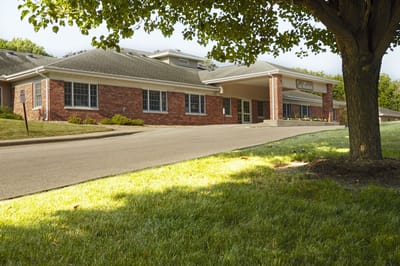
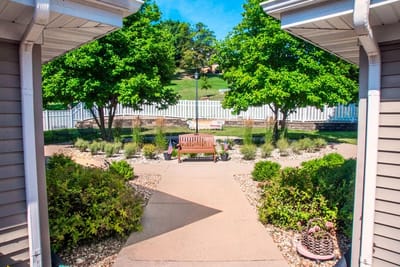
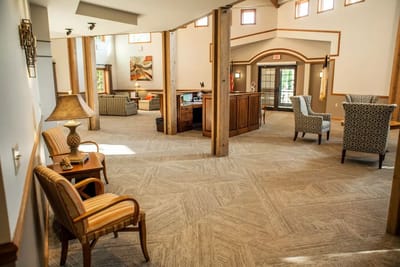
Meth Wick Community is a place where life is brimming with vivid and authentic experiences. This not-for-profit community offers a range of senior living options including independent living, Independence Plus, assisted living, memory care, and nursing care. The 68-acre wooded campus has been providing care since 1961. This home also places an emphasis on wellness, offering classes to help residents maintain their physical, mental, and emotional health. 

They house bariatric specialty suits to provide additional support for those who need it. Transportation services make it easy to get around, and the 14,000 square foot social hub is the perfect place to gather with friends and neighbors. The social hub features a library, fitness room, doctor’s office, and more. Residents can even join book clubs and bus trips and stay connected with donors and the community’s needs through the Legacy newsletter. Moreover, the facility is equipped with a Wick Endowment Fund to assist residents who have exhausted their resources. They strongly prioritize security and comfort, providing both total independence and total care in one place.

(319) 365-9171

Quality ratings

Measured by Centers for Medicare & Medicaid Services (CMS)

Overall rating Info The Overall CMS Rating combines results from health inspections, staffing levels and quality measures. Health inspections carry the most weight. Staffing and quality scores can increase or decrease the final rating based on performance compared to state and national standards.
▲ 63.2% Above IA avg. ▲ 63.2% Above IA avg.IA average: 3.1Click the badge to see the full State ranking.Click here to see the full State ranking.
Health Inspection Info Based on the results of the facility's three most recent standard inspections and any complaint investigations. CMS reviews the number, scope, and severity of deficiencies, with more recent findings weighted more heavily.
▲ 75.3% Above IA avg. ▲ 75.3% Above IA avg.IA average: 2.9Click the badge to see the full State ranking.Click here to see the full State ranking.
Staffing Info Measures average nursing staff hours per resident per day, including Registered Nurses (RNs) and total nursing staff. Ratings are adjusted based on the level of care residents require and are compared to state and national benchmarks.
▲ 40.9% Above IA avg. ▲ 40.9% Above IA avg.IA average: 3.5Click the badge to see the full State ranking.Click here to see the full State ranking.
Quality Measures Info Based on clinical and physical health indicators reported to CMS, such as hospital readmissions, falls, pressure ulcers, and improvements in mobility. These measures reflect how well residents' health needs are being managed.
▲ 52.7% Above IA avg. ▲ 52.7% Above IA avg.IA average: 3.3Click the badge to see the full State ranking.Click here to see the full State ranking.

Staffing hours breakdown

Info Daily nursing hours per resident by staff type, reported to CMS. Higher is generally better — compare this facility to state and national averages to see where staffing stands.

Hours per resident per day — compared to Iowa state averages

Total nursing care / resident Info This home is ranked 6th out of 249 homes in Iowa for nurse hours. Total adjusted nursing hours per resident per day, combining RN, LPN, and aide time. CMS adjusts this for case-mix so facilities can be fairly compared.
5h 58m per day
Rank #6 / 249Nurse hours — State benchmarkedThis home is ranked 6th out of 249 homes in Iowa. Shows adjusted nurse hours per resident per day benchmarked to the Iowa average, with a ranking across 249 Iowa facilities. More hours mean more direct care. The national average is about 3.5 hrs; below 3.0 is a red flag.Ranking totals vary by category as each rank only includes facilities that report data for that metric. Homes missing that data point aren't included in the ranking.Click the rank badge to see the full State ranking.Click here to see the full State ranking.
This facility Iowa avg (4h 18m per day)
vs Iowa avg
+39%

1 of 6 metrics below state avg

Standout metric Registered Nurse (RN) is +56% above state avg
Staff typeHours / Day / Residentvs state avg
Registered Nurse (RN) Info RNs hold the highest nursing license and can assess residents, interpret test results, and direct care plans. More RN hours per day often signals stronger clinical oversight and faster response to health changes. 1h 9m per day ▲ 56% State avg: 44m per day · National avg: 41m per day
LPN / LVN Info Licensed Practical Nurses (LPNs) or Licensed Vocational Nurses (LVNs) deliver routine hands-on care — medication administration, wound dressing, and monitoring vital signs. They work under RN supervision and make up a large share of daily bedside care. 11m per day ▼ 66% State avg: 34m per day · National avg: 52m per day
Nurse Aide Info Certified Nurse Aides (CNAs) provide the most direct day-to-day assistance: bathing, dressing, feeding, and mobility. Nurse aide hours are typically the largest staffing category and directly affect residents' quality of life. 3h 43m per day ▲ 48% State avg: 2h 30m per day · National avg: 2h 20m per day
Weekend Total Nursing Info Combined nursing hours (RN + LPN + Nurse Aide) per resident per day on weekends. Staffing often drops on weekends — this figure reveals whether the facility maintains adequate coverage outside of weekday hours. 4h 27m per day ▲ 32% State avg: 3h 23m per day · National avg: 3h 27m per day
Physical Therapist Info Hours per resident per day provided by licensed Physical Therapists (PTs) or PT Assistants. PT services help residents recover mobility after injury or illness and are especially important for post-acute (short-stay) rehabilitation. 3m per day ▲ 32% State avg: 2m per day · National avg: 4m per day
Weekend RN Info Registered nurse hours specifically on weekends. Facilities sometimes reduce RN presence on Saturdays and Sundays — a low weekend RN figure compared to weekday hours can indicate reduced clinical oversight when most administrative staff are absent. 45m per day ▲ 50% State avg: 30m per day · National avg: 29m per day

Capacity and availability

This home usually has limited availability

Higher occupancy than the Iowa average: 75.4%
Occupancy rate
86.5% Rank #91 / 407Occupancy rate — State benchmarkedThis home is ranked 91st out of 407 homes in Iowa. Shows this facility's occupancy rate versus the Iowa average, with its Statewide rank out of 407. Higher occupancy signals strong local demand and financial stability.Ranking totals vary by category as each rank only includes facilities that report data for that metric. Homes missing that data point aren't included in the ranking.Click the rank badge to see the full State ranking.Click here to see the full State ranking.
Avg. Length of Stay
195 days
Bed community size
69-bed community Rank #168 / 407Bed count — State benchmarkedThis home is ranked 168th out of 407 homes in Iowa. Shows this facility's certified or reported bed count compared to other Iowa facilities. Larger communities may offer more amenities, programs, and on-site services for residents and families.Ranking totals vary by category as each rank only includes facilities that report data for that metric. Homes missing that data point aren't included in the ranking.Click the rank badge to see the full State ranking.Click here to see the full State ranking.
A moderately sized community that may balance personal attention with shared amenities and social activities.
Walk Score
Walk Score: 23 / 100 Rank #405 / 528Walk Score — State benchmarkedThis home is ranked 405th out of 528 homes in Iowa. Shows how walkable this facility's neighborhood is compared to the average Walk Score across Iowa facilities. Higher scores benefit residents, families, and staff.Ranking totals vary by category as each rank only includes facilities that report data for that metric. Homes missing that data point aren't included in the ranking.Click the rank badge to see the full State ranking.Click here to see the full State ranking.
Car-dependent. Most errands require a car, with limited nearby walkable options.

About this community

Therapy & Rehabilitation

2 services
Rehabilitation Services
Respite Care

Amenities & Lifestyle

Specific ProgramsIndependence Plus, Wellness & Recreation, Rehabilitation With Skilled Nursing Care, Town Center, Bariatric Rooms

Contact Meth Wick Community

Staffing Data

Reporting period: October 1 – December 31, 2025 (Q4 2025). Source: CMS Payroll-Based Journal report.

Total staff 189
Employees 87
Contractors 102
Staff to resident ratio 3.57 : 1
74% more staff per resident than Iowa average
Iowa average ratio: 2.05 : 1 Iowa average ratio: 2.05 : 1See full Iowa ranking
Avg staff/day 47
Average shift 7 hours
5% worse than Iowa average
Iowa average: 7.4 hours Iowa average shift: 7.4 hoursSee full Iowa ranking
Total staff hours (quarter) 30,392

Nursing staff breakdown

Q4 2025 · Oct 1 – Dec 31 More info This data comes from the CMS Payroll-Based Journal report covering October 1 – December 31, 2025.
Registered Nurse

Manages medical care and health needs.

RN Staff Info 27 total: 15 full-time employees and 12 contractors. 27
Average shift length Info Average shift length. Calculated as total hours divided by days worked and average staff per day. 7.7 hours
Licensed Practical Nurse

Assists with medical care and medications.

LPN Staff Info 19 total: 5 full-time employees and 14 contractors. 19
Average shift length Info Average shift length. Calculated as total hours divided by days worked and average staff per day. 8.8 hours
Certified Nursing Assistant

Helps with daily care and mobility.

CNA Staff Info 108 total: 54 full-time employees and 54 contractors. 108
Average shift length Info Average shift length. Calculated as total hours divided by days worked and average staff per day. 7.3 hours

Contractor staffing

Q4 2025 · Oct 1 – Dec 31 More info This data comes from the CMS Payroll-Based Journal report covering October 1 – December 31, 2025.

Total hours from contractors

11.9%

3,608 contractor hours this quarter

Certified Nursing Assistant: 54 Licensed Practical Nurse: 14 Registered Nurse: 12 Speech Language Pathologist: 6 Qualified Social Worker: 5 Respiratory Therapy Technician: 3 Physical Therapy Assistant: 3 Physical Therapy Aide: 2 Occupational Therapy Aide: 1 Occupational Therapy Assistant: 1 Medical Director: 1

Staff by category

Q4 2025 · Oct 1 – Dec 31 More info This data comes from the CMS Payroll-Based Journal report covering October 1 – December 31, 2025.
Certified Nursing Assistant545410818,71592100%7.3
Registered Nurse1512274,95292100%7.7
Dietitian4041,1637379%6.5
Licensed Practical Nurse514199736874%8.8
Speech Language Pathologist0666846874%3.9
Clinical Nurse Specialist2026086065%8.1
Medication Aide/Technician3035497278%7.4
Mental Health Service Worker1014725762%8.3
Administrator1014585762%8
Nurse Practitioner1014135358%7.8
Physical Therapy Aide0223106368%4.9
Respiratory Therapy Technician0332526166%3.8
Other Dietary Services Staff1012324448%5.3
Occupational Therapy Aide0111902426%7.9
Physical Therapy Assistant0331836571%2.8
Qualified Social Worker0551827076%2.1
Medical Director0113033%10
Occupational Therapy Assistant0113089%3.7
108 Certified Nursing Assistant
% of Days 100%
27 Registered Nurse
% of Days 100%
4 Dietitian
% of Days 79%
19 Licensed Practical Nurse
% of Days 74%
6 Speech Language Pathologist
% of Days 74%
2 Clinical Nurse Specialist
% of Days 65%
3 Medication Aide/Technician
% of Days 78%
1 Mental Health Service Worker
% of Days 62%
1 Administrator
% of Days 62%
1 Nurse Practitioner
% of Days 58%
2 Physical Therapy Aide
% of Days 68%
3 Respiratory Therapy Technician
% of Days 66%
1 Other Dietary Services Staff
% of Days 48%
1 Occupational Therapy Aide
% of Days 26%
3 Physical Therapy Assistant
% of Days 71%
5 Qualified Social Worker
% of Days 76%
1 Medical Director
% of Days 3%
1 Occupational Therapy Assistant
% of Days 9%

Penalties and fines

Federal penalties imposed by CMS for regulatory violations, including civil money penalties (fines) and denials of payment for new Medicare/Medicaid admissions.

Source: CMS Penalties Database

No penalties in the past 3 years

No civil money penalties or payment denials were reported in the last 3 years.

Quality of care over time

These measures show how residents usually do over time at this home, based on health outcomes and preventive care.

High-risk clinical events score Info A composite score based on pressure ulcers, falls with injury, weight loss, walking ability decline, and activities of daily living decline. 8.9
13% better than Iowa average

Iowa average: 10.2

Functional decline score Info A composite score based on activities of daily living decline, walking ability decline, and incontinence. 18.1
16% better than Iowa average

Iowa average: 21.6

Long-stay resident measures
Need for Help with Daily Activities Increased Info Percent of long-stay residents whose need for help with daily activities has increased 13.5%
28% better than Iowa average

Iowa average: 18.8%

Walking Ability Worsened Info Percent of long-stay residents whose ability to move independently worsened 21.1%
7% worse than Iowa average

Iowa average: 19.7%

Low Risk Residents with Bowel/Bladder Incontinence Info Percent of low risk long-stay residents who lose control of their bowels or bladder 19.7%
25% better than Iowa average

Iowa average: 26.2%

Falls with Major Injury Info Percent of long-stay residents experiencing one or more falls with major injury 3.2%
11% better than Iowa average

Iowa average: 3.6%

High Risk Residents with Pressure Ulcers Info Percent of long-stay high risk residents with pressure ulcers 4.8%
9% worse than Iowa average

Iowa average: 4.4%

Urinary Tract Infection Info Percent of long-stay residents with a urinary tract infection 0.9%
62% better than Iowa average

Iowa average: 2.5%

Lost Too Much Weight Info Percent of long-stay residents who lose too much weight 2.0%
60% better than Iowa average

Iowa average: 5.0%

Depressive Symptoms Info Percent of long-stay residents who have depressive symptoms 3.7%
5% better than Iowa average

Iowa average: 3.9%

Antipsychotic Use Info Percent of long-stay residents who received an antipsychotic medication 16.1%
15% better than Iowa average

Iowa average: 19.0%

Pneumococcal Vaccine Info Percent of long-stay residents assessed and appropriately given the pneumococcal vaccine 73.3%
22% worse than Iowa average

Iowa average: 94.4%

Influenza Vaccine Info Percent of long-stay residents assessed and appropriately given the seasonal influenza vaccine 100.0%
5% better than Iowa average

Iowa average: 95.3%

Short-stay resident measures
Pneumococcal Vaccine Info Percent of short-stay residents assessed and appropriately given the pneumococcal vaccine 81.1%
5% worse than Iowa average

Iowa average: 85.1%

Antipsychotic medication increase Info Percent of short-stay residents who newly received an antipsychotic medication 6.3%
239% worse than Iowa average

Iowa average: 1.8%

Influenza Vaccine Info Percent of short-stay residents assessed and appropriately given the seasonal influenza vaccine 93.8%
28% better than Iowa average

Iowa average: 73.3%

Breakdown by payment type

Medicare

36% of new residents, usually for short-term rehab.

Typical stay 19 days

Private pay

61% of new residents, often for short stays.

Typical stay 8 - 9 months

Medicaid

3% of new residents, often for long-term daily care.

Typical stay 3 years

Facility Characteristics

Source: CMS Long-Term Care Facility Characteristics (Data as of Jan 2026)

Total residents 53
Medicare
3
5.7% of residents
Medicaid
7
13.2% of residents
Private pay or other
43
81.1% of residents
Programs & Services
Residents Group

Residents meet regularly to discuss policies, care quality, and activities

CCRC

Part of a Continuing Care Retirement Community offering multiple care levels

Active Resident Council

Organized group of residents that meets regularly to discuss facility policies, quality of life, and activities.

Finances and operations

Based on CMS SNF Cost Report for fiscal year ending in 03/2024.

Governmental community
Net patient revenue Info Net patient revenue — what the home actually collects for resident care, after contractual allowances, bad debt and discounts are subtracted from its gross charges (CMS cost report, Worksheet G-3). It covers resident care only; money the home earns from other sources is shown separately as "Other income."
$18.2M
Net patient income Info Net patient income: net patient revenue minus the home's total operating expenses. A positive figure means it earns more from resident care than it spends to deliver it; a negative figure means the opposite. It excludes non-operating "other income."
-$2.9M
Governmental community
Net patient revenue Info Net patient revenue — what the home actually collects for resident care, after contractual allowances, bad debt and discounts are subtracted from its gross charges (CMS cost report, Worksheet G-3). It covers resident care only; money the home earns from other sources is shown separately as "Other income."
$18.2M Rank #8 / 251Revenue — State benchmarkedThis home is ranked 8th out of 251 homes in Iowa. Shows this facility's annual revenue compared to the Iowa average. Higher revenue generally means more resources for staffing and capital — read alongside Payroll %.Ranking totals vary by category as each rank only includes facilities that report data for that metric. Homes missing that data point aren't included in the ranking.Click the rank badge to see the full State ranking.Click here to see the full State ranking.
Net patient income Info Net patient income: net patient revenue minus the home's total operating expenses. A positive figure means it earns more from resident care than it spends to deliver it; a negative figure means the opposite. It excludes non-operating "other income."
-$2.9M
Other income Info Money the home earns outside of resident care — such as investments, grants, rentals and other non-operating sources (CMS cost report, Worksheet G-3). It is tracked separately from net patient revenue: it is not part of that figure, and it is not included in net patient income.
$1.8M
Payroll costs Info Staff salaries plus wage-related costs — benefits such as payroll taxes, health insurance and retirement — from the home's own accounting records (CMS cost report, Worksheet A). Contract or agency labor is counted separately, under other operating costs. Rank #8 / 251Payroll — State benchmarkedThis home is ranked 8th out of 251 homes in Iowa. Shows total annual staff payroll benchmarked to the Iowa average. Higher payroll investment relative to peers often signals better staffing and less reliance on cheaper contract labor.Ranking totals vary by category as each rank only includes facilities that report data for that metric. Homes missing that data point aren't included in the ranking.Click the rank badge to see the full State ranking.Click here to see the full State ranking.
$10.3M 56.4% of net patient revenue Info Payroll as a share of revenue: staff salaries and wage-related benefits divided by net patient revenue. A higher figure means more of each revenue dollar goes to staff pay. Rank #144 / 251Payroll % — State benchmarkedThis home is ranked 144th out of 251 homes in Iowa. Shows payroll as a percentage of revenue versus the Iowa average. Well-run Iowa facilities typically land around 61–69% — the top third Statewide. Below 25% may signal understaffing or heavy agency use — read with Staffing ratings.Ranking totals vary by category as each rank only includes facilities that report data for that metric. Homes missing that data point aren't included in the ranking.Click the rank badge to see the full State ranking.Click here to see the full State ranking.
Other operating costs Info Everything it costs to run the home apart from payroll — food, utilities, supplies, maintenance, contract labor and administration. Calculated as total operating expense minus payroll (staff salaries and wage-related benefits).
$10.9M
Total costs Info The home's total operating expense for the year — all the costs of running it, salaries included (CMS cost report, Worksheet G-3).
$21.1M

Who this home usually serves

TYPE OF STAY

Primarily short stays

Residents typically stay for brief periods, with frequent admissions and discharges throughout the year.

Most new residents arrive under private pay (61% of admissions), and a typical private pay stay runs around 8 - 9 months.

Admissions
111 total

Coverage residents most often arrive under.

Medicare 36%
Private pay 61%
Medicaid 3%
Discharges
112 total

Coverage residents most often leave under.

Medicare 13%
Private pay 83%
Medicaid 4%

Places of interest near Meth Wick Community

Address 1.9 miles from city center Info Estimated distance in miles from Cedar Rapids's city center to Meth Wick Community's address, calculated via Google Maps. — 0.86 miles to nearest hospital (UnityPoint Health - AbbeHealth Services - Kingston Hill Residential Care Facility)

Calculate Travel Distance to Meth Wick Community

Add your location

Address

Compare Nursing Home around Cedar Rapids

The information below is reported by the Iowa Department of Inspections, Appeals, and Licensing.

5 facilities compared · CMS & IA Dept. of Health data

Meth Wick Community
NH
AL
IL
MC
NC
RC
Cedar Rapids (The Meth-Wick Community)
69
Facility 69
IA AVG 71
Rank #168 / 407
86.5%
Facility 86.5%
IA AVG 75.4%
Rank #91 / 407
+15%
5.96
Facility 5.96
IA AVG 4.30
Rank #6 / 249
+23%+39%
$0
Facility $0
IA AVG $53.4k
Rank #1 / 255
3
Facility 3
IA AVG 21.7
Rank #9 / 250
1.5
Facility 1.5
IA AVG 4.1
Rank #14 / 250
-56-
23
Facility 23
IA AVG 45
Rank #405 / 528
Meth Wick Community
$18.2M
Facility $18.2M
IA AVG $7.0M
Rank #8 / 251
$10.3M
Facility $10.3M
IA AVG $3.1M
Rank #8 / 251
56.4%
Facility 56.4%
IA AVG 46.3%
Rank #144 / 251
165542
West Ridge Care Center
NH
MC
Cedar Rapids
60
Facility 60
IA AVG 71
Rank #214 / 407
75.0%
Facility 75.0%
IA AVG 75.4%
Rank #162 / 407
-1%
4.88
Facility 4.88
IA AVG 4.30
Rank #52 / 249
+31%+14%
$0
Facility $0
IA AVG $53.4k
Rank #1 / 255
5
Facility 5
IA AVG 21.7
Rank #20 / 250
2.5
Facility 2.5
IA AVG 4.1
Rank #58 / 250
-52-
48
Facility 48
IA AVG 45
Rank #241 / 528
Elaine Sample
$6.9M
Facility $6.9M
IA AVG $7.0M
Rank #79 / 251
$3.7M
Facility $3.7M
IA AVG $3.1M
Rank #85 / 251
53.1%
Facility 53.1%
IA AVG 46.3%
Rank #160 / 251
165567
Terrace Glen Village
NH
AL
IL
Marion (Flynn)
40
Facility 40
IA AVG 71
Rank #325 / 407
95.0%
Facility 95.0%
IA AVG 75.4%
Rank #24 / 407
+26%
4.48
Facility 4.48
IA AVG 4.30
Rank #80 / 249
+20%+4%
$12.2k
Facility $12.2k
IA AVG $53.4k
Rank #168 / 255
14
Facility 14
IA AVG 21.7
Rank #105 / 250
4.7
Facility 4.7
IA AVG 4.1
Rank #165 / 250
438A
14
Facility 14
IA AVG 45
Rank #444 / 528
Abernathy Family Farms LLC
$8.7M
Facility $8.7M
IA AVG $7.0M
Rank #77 / 251
$4.2M
Facility $4.2M
IA AVG $3.1M
Rank #92 / 251
48.4%
Facility 48.4%
IA AVG 46.3%
Rank #188 / 251
165625
The Views of Marion
NH
AL
MC
Marion
60
Facility 60
IA AVG 71
Rank #214 / 407
48.3%
Facility 48.3%
IA AVG 75.4%
Rank #296 / 407
-36%
4.15
Facility 4.15
IA AVG 4.30
Rank #139 / 249
-35%-3%
$0
Facility $0
IA AVG $53.4k
Rank #1 / 255
12
Facility 12
IA AVG 21.7
Rank #86 / 250
3.0
Facility 3.0
IA AVG 4.1
Rank #81 / 250
-29-
37
Facility 37
IA AVG 45
Rank #315 / 528
Dallas Urbain
$9.5M
Facility $9.5M
IA AVG $7.0M
Rank #58 / 251
$3.9M
Facility $3.9M
IA AVG $3.1M
Rank #90 / 251
41.5%
Facility 41.5%
IA AVG 46.3%
Rank #207 / 251
165626
HallMar Village
NH
AL
IL
MC
Cedar Rapids
55
Facility 55
IA AVG 71
Rank #240 / 407
80.0%
Facility 80.0%
IA AVG 75.4%
Rank #126 / 407
+6%
5.19
Facility 5.19
IA AVG 4.30
Rank #31 / 249
+7%+21%
$12.0k
Facility $12.0k
IA AVG $53.4k
Rank #167 / 255
20
Facility 20
IA AVG 21.7
Rank #149 / 250
2.5
Facility 2.5
IA AVG 4.1
Rank #58 / 250
349-
4
Facility 4
IA AVG 45
Rank #495 / 528
----165798

Financial Assistance for
Nursing Home in Iowa

Meth Wick Community is located in Cedar Rapids, Iowa.
Here are the financial assistance programs available to residents in Iowa.

Get Financial aid guidance

Elderly Waiver

Iowa Medicaid Elderly Waiver

Age 65+
General Iowa resident, Medicaid-eligible, nursing home-level care need.
Income Limits (2025) ~$2,829/month 300% FBR, individual
Asset Limits $2,000 (individual), $3,000 (couple).
IA

Rural focus; waitlists possible.

Benefits
In-home care (5-7 hours/day) Meals ($6/meal) Respite (240 hours/year) Adult day care ($60/day)

Iowa Family Caregiver Support

IA NFCSP

Age Caregiver of someone 60+
General Iowa resident.
Income Limits No strict limit; prioritizes low-income.
Asset Limits Not applicable.
IA

Limited slots; rural emphasis.

Benefits
In-home respite (4-6 hours/day) Adult day care (~$60/day) Short-term facility care (up to 5 days)

Medicare Savings Program (MSP)

Iowa Medicare Savings Program

Age 65+ or disabled
General Iowa resident, Medicare Part A/B.
Income Limits (2025) ~$2,510/month (QMB), ~$3,380/month (SLMB), ~$3,598/month (QI)—individual.
Asset Limits $9,430 (individual), $14,130 (couple).
IA

Three tiers; no waitlist.

Benefits
Covers Part B premiums ($174.70/month) Deductibles ($240/year) Copays (~20%)

Program of All-Inclusive Care for the Elderly (PACE)

Iowa PACE

Age 55+
General Iowa resident, nursing home-level care need, safe with PACE support.
Income Limits (2025) ~$2,829/month 300% FBR, Medicaid-eligible
Asset Limits $2,000 (individual), $3,000 (couple).
IA

Limited to western Iowa (e.g., Council Bluffs); expanding slowly.

Benefits
Personal care (5-7 hours/day) Medical care Meals Transportation Therapy Respite

VA Aid and Attendance (A&A) and Housebound Benefits

Iowa VA Aid and Attendance/Housebound

Age 65+ or disabled veteran/spouse
General Iowa resident, wartime service, need for ADL help (A&A) or homebound.
Income Limits (2025) Net income < ~$1,984/month (veteran with dependent, A&A); pension offsets income.
Asset Limits ~$155,356 net worth limit
IA

High veteran demand in rural areas.

Benefits
Cash (~$1,433-$2,642/month veteran, ~$951-$1,318 spouse) for care costs (e.g., in-home, assisted living)

Able Up Iowa

Able Up Iowa

Age 65+ or disabled
General Iowa resident, ability to repay loan, need for assistive tech or mods.
Income Limits (2025) No strict limit; must demonstrate repayment capacity.
Asset Limits Not specified; credit-based.
IA

Loans up to $25,000; statewide via Easterseals partnership.

Benefits
Loans for wheelchairs Ramps Walk-in tubs (~$500-$10,000 avg.) Reducing reliance on paid care

Frequently Asked Questions about Meth Wick Community

What neighborhood is Meth Wick Community in?

Meth Wick Community is in the The Meth-Wick Community neighborhood.

Is Meth Wick Community in a walkable area?

Meth Wick Community has a walk score of 23. Car-dependent. Most errands require a car, with limited nearby walkable options.

What is the occupancy rate at Meth Wick Community?

Meth Wick Community's occupancy is 86.5%.

Are there photos of Meth Wick Community?

Yes — there are 12 photos of Meth Wick Community in the photo gallery on this page.

What is the phone number of Meth Wick Community?

(319) 365-9171 will put you in contact with the team at Meth Wick Community.

Is Meth Wick Community Medicare or Medicaid certified?

Yes — Meth Wick Community is a CMS-certified provider of Medicare and Medicaid.

Guides for Better Senior Living

Care Cost Calculator: See Prices in Your Area

Nursing Home Data Explorer

Don’t Wait Too Long: 7 Red Flag Signs Your Parent Needs Assisted Living Now

The True Cost of Assisted Living in 2025 – And How Families Are Paying For It

Understanding Senior Living Costs: Pricing Models, Discounts & Financial Assistance