

Occupancy rate
68%
Indiana average: 69%

We arrange tours, appointments, and even moving support so you don’t have to


 Official CMS rating based on health inspections, staffing and quality measures.
Official CMS rating based on deficiencies found during state health inspections.
Official CMS rating based on nurse staffing hours per resident per day.
Official CMS rating based on clinical outcomes for residents.
Average daily nursing hours per resident (adjusted for acuity). Higher values indicate more nursing time per resident.
Official CMS rating based on health inspections, staffing and quality measures.
Official CMS rating based on deficiencies found during state health inspections.
Official CMS rating based on nurse staffing hours per resident per day.
Official CMS rating based on clinical outcomes for residents.
Average daily nursing hours per resident (adjusted for acuity). Higher values indicate more nursing time per resident.
Offers a balance of services and community atmosphere.
Lower occupancy suggests more openings may be available.
Residents typically stay for brief periods, with frequent admissions and discharges throughout the year.
26% of new residents, usually for short-term rehab.
66% of new residents, often for short stays.
7% of new residents, often for long-term daily care.
The portion of the home's budget spent on staff, including nurses, caregivers, and other employees who support care and operations.
All remaining costs needed to run the home, such as food, utilities, building maintenance, supplies and administrative expenses.
Indiana average: 69%
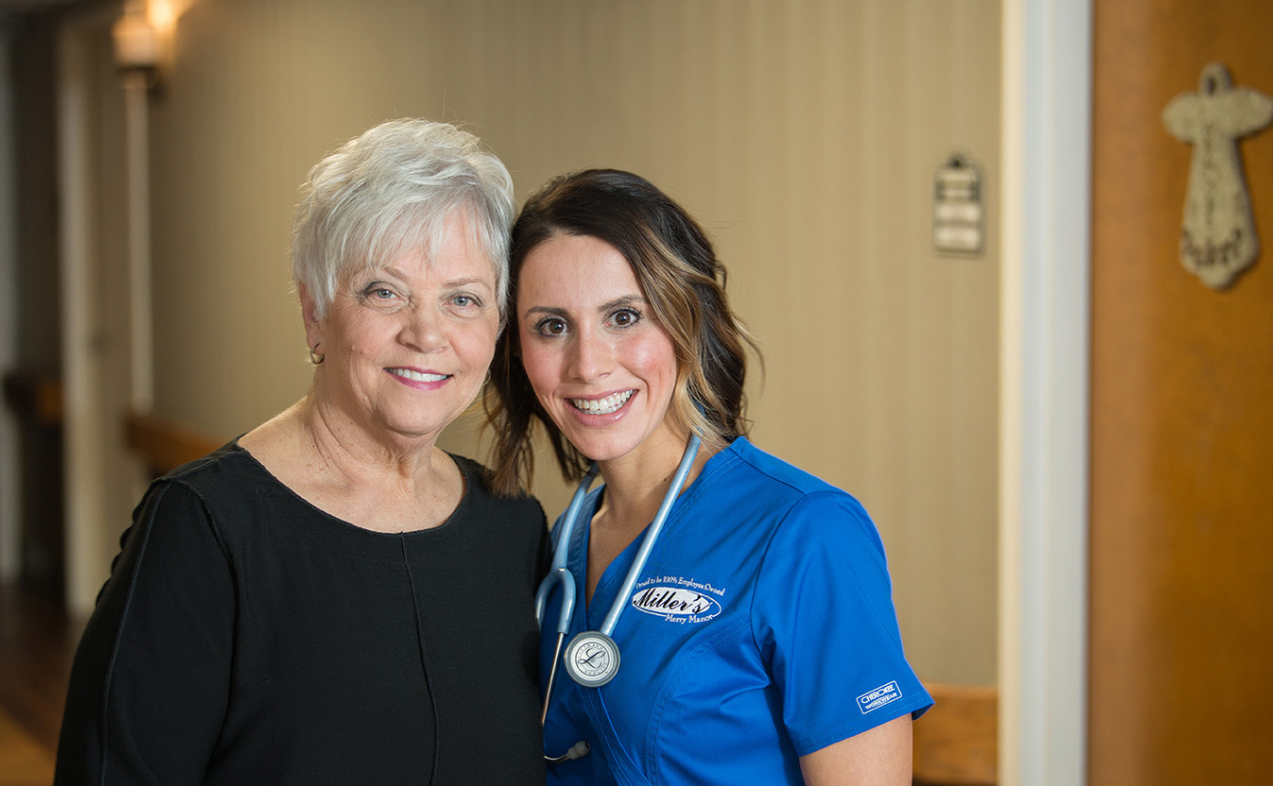
Miller’s Merry Manor is administrated by ZACKARY FREEL.
Key information about the people who lead and staff this community.
In Indiana, the Department of Health, Division of Long Term Care is the primary regulatory body that performs onsite inspections and quality of care reviews for all licensed facilities.
2 with citations
0 without citations
Indiana average: 8 complaint visits
Indiana average: 3 inspections with citations
Formal expressions of dissatisfaction or concern made by residents, or their families regarding various aspects of the care, services, and environment provided.
Indiana average: 4 complaints
Citations indicate regulatory violations. A higher number implies the facility had several areas requiring improvement.
Indiana average: 26 citations
Deficiencies indicate regulatory issues. A higher number implies the facility had several areas requiring improvement.
The most recent inspection on July 7, 2025, found no deficiencies related to the complaint investigated. Prior inspections showed a mix of findings, including several life safety code deficiencies noted in May 2025 related to fire safety equipment, door operability, and emergency procedures. Earlier reports cited issues with resident care such as failure to follow physician orders, infection control surveillance, and safe transfer practices that resulted in injuries. Complaint investigations were mostly unsubstantiated, except for a few substantiated cases involving resident transfer planning and infection control data collection. The facility’s inspection history shows ongoing challenges with life safety compliance and resident care, with some improvements noted in complaint resolution and emergency preparedness.
Indiana average 6
Last Health inspection on Apr 2025
Health citations are formal notices following inspections when they fail to comply with safety and care standards.
10 of 12 citations resulted from standard inspections; and 2 of 12 resulted from complaint investigations.
Indiana average: 0.2
Indiana average: 0.6
Data sourced from CMS Health Deficiencies reports. Citation severity codes range from A (least serious) to L (most serious). Immediate Jeopardy (J-L) citations indicate situations where the facility's noncompliance has placed residents at risk of death or serious harm.
Nursing Home 24/7 care needed
Assisted Living For seniors needing help with daily tasks but not full-time nursing.
Assisted Living For seniors needing help with daily tasks but not full-time nursing.
Memory Care Specialized care for those with Memory Loss, Alzheimer's, or dementia, ensuring safety and support.
Nursing Homes 24/7 care needed
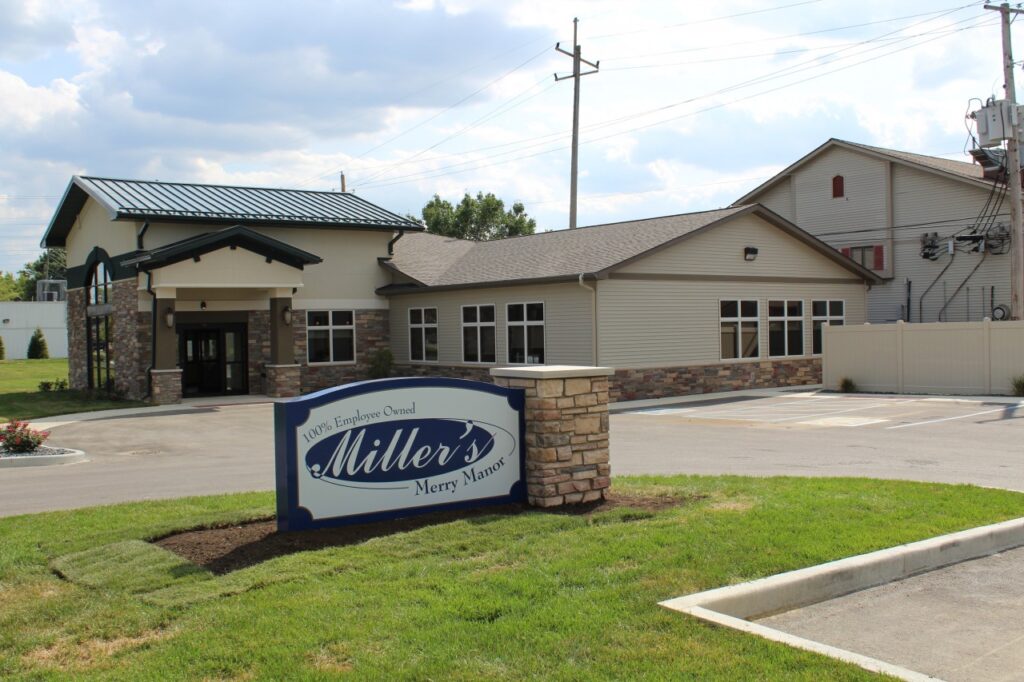 Miller’s Merry Manor
 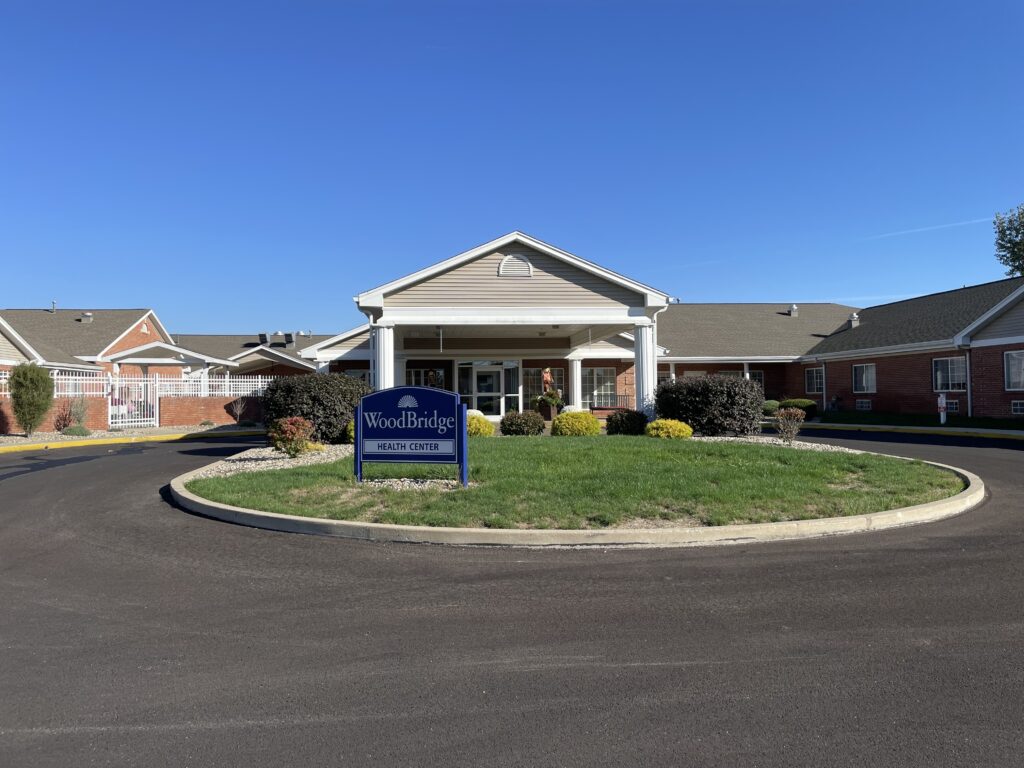 WoodBridge Health Campus
![]() 0.0 miles from city center
0.0 miles from city center
![]() LOGANSPORT, IN 46947
LOGANSPORT, IN 46947
Add your location
Source: CMS Payroll-Based Journal (Q2 2025)
| Role ⓘ | Count ⓘ | Avg Shift (hrs) ⓘ | Uses Contractors? ⓘ |
|---|---|---|---|
| Registered Nurse | 21 | 8.7 | Yes |
| Licensed Practical Nurse | 23 | 8.5 | Yes |
| Certified Nursing Assistant | 85 | 7.3 | Yes |
| Role ⓘ | Employees ⓘ | Contractors ⓘ | Total Staff ⓘ | Total Hours ⓘ | Days Worked ⓘ | % of Days ⓘ | Avg Shift (hrs) ⓘ |
|---|---|---|---|---|---|---|---|
| Certified Nursing Assistant | 67 | 18 | 85 | 19,952 | 91 | 100% | 7.3 |
| Licensed Practical Nurse | 14 | 9 | 23 | 5,331 | 91 | 100% | 8.5 |
| Registered Nurse | 15 | 6 | 21 | 4,832 | 91 | 100% | 8.7 |
| Other Dietary Services Staff | 8 | 0 | 8 | 2,490 | 89 | 98% | 6.6 |
| Clinical Nurse Specialist | 9 | 0 | 9 | 2,450 | 80 | 88% | 7.5 |
| Speech Language Pathologist | 0 | 8 | 8 | 1,195 | 74 | 81% | 6.2 |
| Dental Services Staff | 2 | 0 | 2 | 957 | 72 | 79% | 7.5 |
| Respiratory Therapy Technician | 0 | 2 | 2 | 750 | 68 | 75% | 6.5 |
| Physical Therapy Aide | 0 | 5 | 5 | 594 | 74 | 81% | 6 |
| Administrator | 1 | 0 | 1 | 500 | 64 | 70% | 7.8 |
| Nurse Practitioner | 1 | 0 | 1 | 480 | 60 | 66% | 8 |
| Qualified Social Worker | 0 | 2 | 2 | 456 | 65 | 71% | 6.8 |
| RN Director of Nursing | 1 | 0 | 1 | 419 | 51 | 56% | 8.2 |
| Medication Aide/Technician | 0 | 7 | 7 | 119 | 12 | 13% | 9.9 |
| Occupational Therapy Assistant | 0 | 1 | 1 | 50 | 20 | 22% | 2.5 |
| Physical Therapy Assistant | 0 | 2 | 2 | 10 | 3 | 3% | 3.2 |
Source: CMS Long-Term Care Facility Characteristics (Data as of Jan 2026)
Residents meet regularly to discuss policies, care quality, and activities
Family members meet regularly to discuss policies, care quality, and activities
State-approved Nurse Aide Training and Competency Evaluation Program on-site
Organized group of family members that meets regularly to discuss facility policies, resident care, and activities.
Organized group of residents that meets regularly to discuss facility policies, quality of life, and activities.
Data sourced from CMS Long-Term Care Facility Characteristics quarterly report. Payer mix reflects the current resident census by primary payment source.
These measures show how residents usually do over time at this home, based on health outcomes and preventive care.
Indiana average: 8.0
Indiana average: 17.1
Indiana average: 12.0%
Indiana average: 14.4%
Indiana average: 24.6%
Indiana average: 3.9%
Indiana average: 4.4%
Indiana average: 1.2%
Indiana average: 5.7%
Indiana average: 24.1%
Indiana average: 12.4%
Indiana average: 93.7%
Indiana average: 95.4%
Indiana average: 81.7%
Indiana average: 1.4%
Indiana average: 79.0%
Quality measures are calculated from Minimum Data Set (MDS) assessments. For most measures, lower percentages indicate better care quality.
Historical financial and operational data for Miller’s Merry Manor based on CMS SNF Cost Reports.
Loading trend charts...
Care Cost Calculator: See Prices in Your Area
Nursing Home Data Explorer
Don’t Wait Too Long: 7 Red Flag Signs Your Parent Needs Assisted Living Now
The True Cost of Assisted Living in 2025 – And How Families Are Paying For It
Understanding Senior Living Costs: Pricing Models, Discounts & Financial Assistance

Touring a community? Use this expert-backed checklist to stay organized, ask the right questions, and find the perfect fit.
We'll send you a PDF version of the touring checklist.


