Explore Open Rooms
1 Contact details
2 What type of senior care service are you looking for?
3 What budget do you have in mind for senior care?
4 How soon do you need to find care?
5 Additional details

Thank you for your interest!

Our team will be in touch shortly to help with next steps.

Assisted Living in Renton

CMS overall rating Info The Overall CMS Rating combines results from health inspections, staffing levels and quality measures. Health inspections carry the most weight. Staffing and quality scores can increase or decrease the final rating based on performance compared to state and national standards.

Mission Healthcare at Renton

Overview of Mission Healthcare at Renton

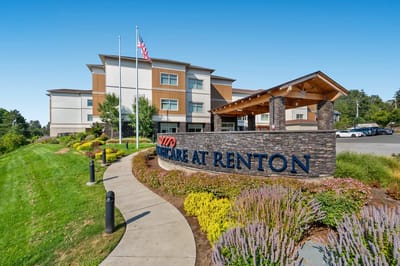
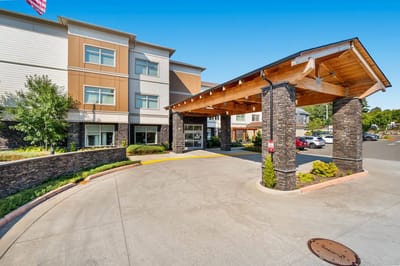
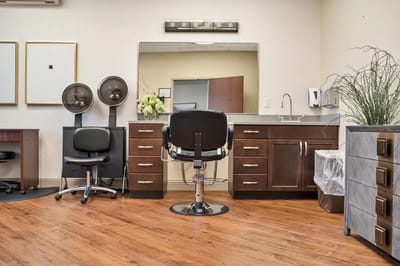
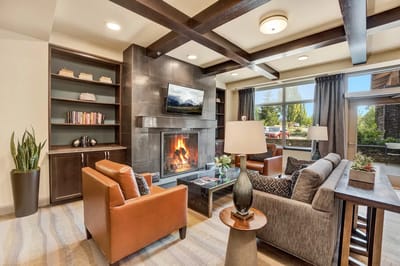
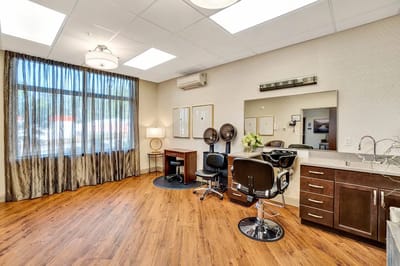
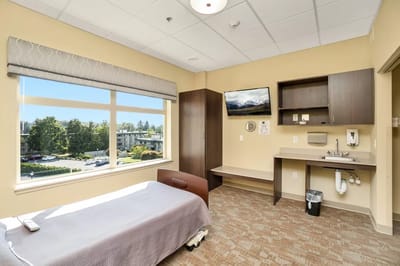
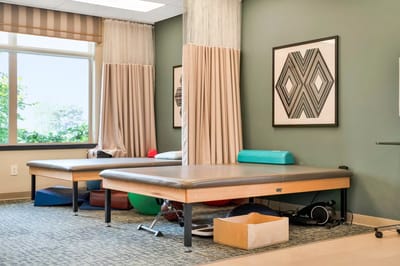
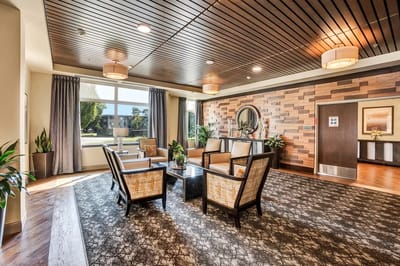
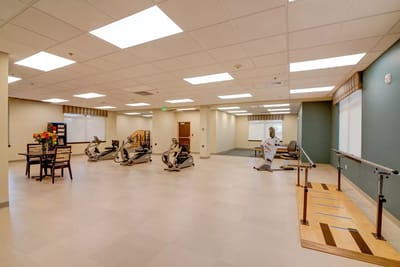
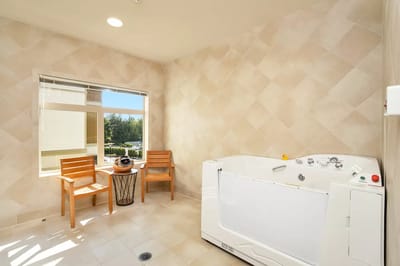
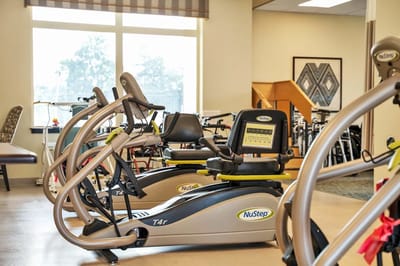
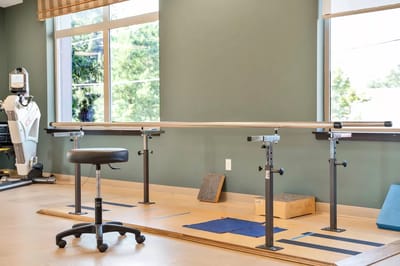
Welcome to Mission Healthcare at Renton, the premier provider of occupational, physical, and speech therapy in Renton, Washington. With a focus on personalized care and support, this community offers a range of services designed to meet the unique needs of each resident. In addition, residents have access to modern and state-of-the-art amenities such as virtual reality therapy, whirlpool therapy, and an expansive fitness center.

Their dedicated team of professionals is committed to providing exceptional care in a warm and inviting environment. With various amenities and engaging activities, they create a vibrant community where residents can thrive and enjoy a fulfilling lifestyle. Mission Healthcare at Renton is dedicated to making each day a joyful and meaningful experience for its residents.

(425) 362-6200

Quality ratings

Measured by Centers for Medicare & Medicaid Services (CMS)

Overall rating Info The Overall CMS Rating combines results from health inspections, staffing levels and quality measures. Health inspections carry the most weight. Staffing and quality scores can increase or decrease the final rating based on performance compared to state and national standards.
3/5
Washington average: 3.2/5
Health Inspection Info Based on the results of the facility's three most recent standard inspections and any complaint investigations. CMS reviews the number, scope, and severity of deficiencies, with more recent findings weighted more heavily.
2/5
Washington average: 2.8/5
Staffing Info Measures average nursing staff hours per resident per day, including Registered Nurses (RNs) and total nursing staff. Ratings are adjusted based on the level of care residents require and are compared to state and national benchmarks.
4/5
Washington average: 3.4/5
Quality Measures Info Based on clinical and physical health indicators reported to CMS, such as hospital readmissions, falls, pressure ulcers, and improvements in mobility. These measures reflect how well residents' health needs are being managed.
5/5
Washington average: 3.9/5

Nursing care per resident

Info This shows how many total hours of nursing staff time are available per resident each day. Higher numbers usually mean more staff support.
4h 40m per day

This home provides 10% more nursing time per resident than the Washington average.

Washington average: 4h 13m per day

Capacity and availability

Smaller home

May offer a more intimate, personalized care environment.

Total beds 60

This home usually has availability

Lower occupancy suggests more openings may be available.

Lower demand than the Washington average
Occupancy rate 81%
Residents per day (avg) 47
Occupancy rate
81%
Residents per day (avg)
47

Who this home usually serves

TYPE OF STAY

Mostly short-term rehab stays

Most residents typically stay for a few weeks or months before returning home or moving on.

Might be optimal for
Short stays Recovery Medicare-covered care

Breakdown by payment type

Medicare

58% of new residents, usually for short-term rehab.

Typical stay 29 days

Private pay

41% of new residents, often for short stays.

Typical stay 1 months

Medicaid

1% of new residents, often for long-term daily care.

Typical stay 3 - 4 years

Finances and operations

Voluntary non-profit community
Home revenue
$11.8M
Operating deficit
-$1.8M
Voluntary non-profit community
Home revenue
$11.8M
Operating deficit
-$1.8M
Payroll costs Info The portion of the home's budget spent on staff, including nurses, caregivers, and other employees who support care and operations.
$4.9M
41.1% of revenue
Other operating costs Info All remaining costs needed to run the home, such as food, utilities, building maintenance, supplies and administrative expenses.
$8.7M
Total costs $13.6M

Contact Mission Healthcare at Renton

Health Inspection History

Inspections
Total health inspections 4

Washington average 7.8


Last Health inspection on Apr 2025

Total health citations 29

Washington average 48.9

Citations per inspection
7.25

Washington average 6.92


Health citations are formal notices following inspections when they fail to comply with safety and care standards.

23 of 29 citations resulted from standard inspections; and 6 of 29 resulted from complaint investigations.

Breakdown of citation severity (last 3 years)
Critical Health citations More info 1
233% worse than Washington average

Washington average: 0.3


Serious Health citations More info 1
41% better than Washington average

Washington average: 1.7

1 critical citation More info Washington average: 0.3

1 serious citation More info Washington average: 1.7

27 moderate citations More info Washington average: 46.3

0 minor citations More info Washington average: 0.5
Citations history (last 3 years)
Administration moderate citation Info Issues related to how the facility is managed, including policies, procedures, and compliance with regulations. Apr 21, 2025
Corrected

Quality of Care moderate citation Info Issues related to how well residents receive appropriate treatment and support for their medical and daily care needs. Apr 21, 2025
Corrected

Quality of Care moderate citation Info Issues related to how well residents receive appropriate treatment and support for their medical and daily care needs. Apr 21, 2025
Corrected

Quality of Care moderate citation Info Issues related to how well residents receive appropriate treatment and support for their medical and daily care needs. Apr 21, 2025
Corrected

Compare Assisted Living around Renton The information below is reported by the Washington Department of Social and Health Services, Residential Care Services.

Filter by care type
Mission Healthcare at Renton
NH

Nursing Home Licensed facility providing 24/7 skilled nursing care for residents with complex, ongoing medical needs. Staffed by RNs, LPNs, and CNAs. Inspected and star-rated annually by CMS. Accepts Medicare (short-term rehab) and Medicaid (long-term care).

AL

Assisted Living A licensed, long-term care setting for seniors or individuals with disabilities who need help with daily activities — like bathing, dressing, and medication management — but not 24-hour skilled nursing. Offers housing, meals, and around-the-clock support while aiming to maximize resident independence.

Renton
60
No
70
-
81.0%
May Valley Golden Years Adult Family Home
AL

Assisted Living A licensed, long-term care setting for seniors or individuals with disabilities who need help with daily activities — like bathing, dressing, and medication management — but not 24-hour skilled nursing. Offers housing, meals, and around-the-clock support while aiming to maximize resident independence.

Renton
-
No
7
Private Rooms
-
Kennydale Golden Age Adult Family Home
AL

Assisted Living A licensed, long-term care setting for seniors or individuals with disabilities who need help with daily activities — like bathing, dressing, and medication management — but not 24-hour skilled nursing. Offers housing, meals, and around-the-clock support while aiming to maximize resident independence.

Renton
-
No
17
Private Rooms
-
Kennydale Golden Years AFH
AL

Assisted Living A licensed, long-term care setting for seniors or individuals with disabilities who need help with daily activities — like bathing, dressing, and medication management — but not 24-hour skilled nursing. Offers housing, meals, and around-the-clock support while aiming to maximize resident independence.

HC

Home Care Professional care delivered in the person's own home — from companionship and errands to skilled nursing and therapy. Allows seniors to age in place. Medicare covers skilled home health when medically necessary.

MC

Memory Care Secured, specialized care for people living with Alzheimer's or dementia. Staff trained in cognitive impairment, with higher staff-to-resident ratios and an environment designed to reduce confusion and wandering risk.

RC

Respite Care Short-term temporary care — days to weeks — to give family caregivers a break. Full care provided during the stay. Often used after hospitalization or to trial a facility before a permanent placement decision.

Renton (Kennydale)
-
No
23
Private Rooms
-
Bright Hope Adult Family Home
AL

Assisted Living A licensed, long-term care setting for seniors or individuals with disabilities who need help with daily activities — like bathing, dressing, and medication management — but not 24-hour skilled nursing. Offers housing, meals, and around-the-clock support while aiming to maximize resident independence.

Renton
-
No
4
1 Bed / Studio / Semi-Private Rooms
-

Places of interest near Mission Healthcare at Renton

Address 2.3 miles from city center — 9.51 miles to nearest hospital (VA Puget Sound Health Care System)

Calculate Travel Distance to Mission Healthcare at Renton

Add your location

Address

Staffing Data (Q2 2025)

This data corresponds to Q2 2025 and is based on CMS Payroll-Based Journal.

Total staff 109
Employees 78
Contractors 31
Staff to resident ratio 2.32:1
25% better than Washington average

Washington average ratio: 1.85:1

Avg staff/day 39
Average shift 7.8 hours
0% compared with Washington average

Washington average: 8.1 hours

Total staff hours (quarter) 27,767
Nursing staff breakdown
Registered Nurse

Manages medical care and health needs.

Total count 12
Average shift length Info Average shift length. Calculated as total hours divided by days worked and average staff per day. 9 hours

No contractors work on this role.

Licensed Practical Nurse

Assists with medical care and medications.

Total count 14
Average shift length Info Average shift length. Calculated as total hours divided by days worked and average staff per day. 9.1 hours

No contractors work on this role.

Certified Nursing Assistant

Helps with daily care and mobility.

Total count 33
Average shift length Info Average shift length. Calculated as total hours divided by days worked and average staff per day. 7.6 hours

This role is partially covered by contractors.

Contractor staffing

Total hours from contractors

12.4%

3,445 contractor hours this quarter

Speech Language Pathologist: 9 Respiratory Therapy Technician: 9 Physical Therapy Aide: 5 Physical Therapy Assistant: 4 Certified Nursing Assistant: 2 Qualified Social Worker: 2
Staff by category
Certified Nursing Assistant3123311,70591100%7.6
Licensed Practical Nurse140145,95391100%9.1
Registered Nurse120122,86191100%9
Speech Language Pathologist0991,3448796%7.2
Physical Therapy Aide0558657380%6.7
Clinical Nurse Specialist4046107279%7.4
Mental Health Service Worker1015307178%7.5
Respiratory Therapy Technician29115246167%6.6
Nurse Practitioner1015126470%8
Dental Services Staff1015126470%8
Administrator2024886167%8
Physical Therapy Assistant1453965965%6.2
Other Dietary Services Staff2023824246%9.1
RN Director of Nursing1013684651%8
Dietitian1013143842%8.3
Qualified Social Worker0222634853%5.2
Nurse Aide in Training1011021314%7.9
Therapeutic Recreation Specialist3033144%6.2
Respiratory Therapist101811%7.5
33 Certified Nursing Assistant
% of Days 100%
14 Licensed Practical Nurse
% of Days 100%
12 Registered Nurse
% of Days 100%
9 Speech Language Pathologist
% of Days 96%
5 Physical Therapy Aide
% of Days 80%
4 Clinical Nurse Specialist
% of Days 79%
1 Mental Health Service Worker
% of Days 78%
11 Respiratory Therapy Technician
% of Days 67%
1 Nurse Practitioner
% of Days 70%
1 Dental Services Staff
% of Days 70%
2 Administrator
% of Days 67%
5 Physical Therapy Assistant
% of Days 65%
2 Other Dietary Services Staff
% of Days 46%
1 RN Director of Nursing
% of Days 51%
1 Dietitian
% of Days 42%
2 Qualified Social Worker
% of Days 53%
1 Nurse Aide in Training
% of Days 14%
3 Therapeutic Recreation Specialist
% of Days 4%
1 Respiratory Therapist
% of Days 1%

Facility Characteristics

Source: CMS Long-Term Care Facility Characteristics (Data as of Jan 2026)

Total census
47 residents
Residents by payment source
Medicare
30 residents (63.8%)
Medicaid
5 residents (10.6%)
Private pay or other
12 residents (25.5%)
Programs & Services
Residents' Group

Residents meet regularly to discuss policies, care quality, and activities

Active Resident Council

Organized group of residents that meets regularly to discuss facility policies, quality of life, and activities.

Quality of care over time

These measures show how residents usually do over time at this home, based on health outcomes and preventive care.

High-risk clinical events score Info A composite score based on pressure ulcers, falls with injury, weight loss, walking ability decline, and activities of daily living decline. 11.6
15% worse than Washington average

Washington average: 10.0

Functional decline score Info A composite score based on activities of daily living decline, walking ability decline, and incontinence. 26.0
25% worse than Washington average

Washington average: 20.9

Long-stay resident measures
Need for Help with Daily Activities Increased Info Percent of long-stay residents whose need for help with daily activities has increased 20.0%
22% worse than Washington average

Washington average: 16.4%

Low Risk Residents with Bowel/Bladder Incontinence Info Percent of low risk long-stay residents who lose control of their bowels or bladder 32.1%
32% worse than Washington average

Washington average: 24.3%

Falls with Major Injury Info Percent of long-stay residents experiencing one or more falls with major injury 0.0%
100% better than Washington average

Washington average: 2.6%

High Risk Residents with Pressure Ulcers Info Percent of long-stay high risk residents with pressure ulcers 8.8%
80% worse than Washington average

Washington average: 4.9%

Urinary Tract Infection Info Percent of long-stay residents with a urinary tract infection 0.0%
100% better than Washington average

Washington average: 1.7%

Lost Too Much Weight Info Percent of long-stay residents who lose too much weight 17.4%
199% worse than Washington average

Washington average: 5.8%

Depressive Symptoms Info Percent of long-stay residents who have depressive symptoms 19.1%
18% worse than Washington average

Washington average: 16.2%

Antipsychotic Use Info Percent of long-stay residents who received an antipsychotic medication 4.4%
70% better than Washington average

Washington average: 14.5%

Pneumococcal Vaccine Info Percent of long-stay residents assessed and appropriately given the pneumococcal vaccine 100.0%
In line with Washington average

Washington average: 96.2%

Short-stay resident measures
Pneumococcal Vaccine Info Percent of short-stay residents assessed and appropriately given the pneumococcal vaccine 95.4%
8% better than Washington average

Washington average: 88.1%

Antipsychotic medication increase Info Percent of short-stay residents who newly received an antipsychotic medication 0.8%
42% better than Washington average

Washington average: 1.4%

Influenza Vaccine Info Percent of short-stay residents assessed and appropriately given the seasonal influenza vaccine 89.3%
9% better than Washington average

Washington average: 82.0%

Penalties and fines

Federal penalties imposed by CMS for regulatory violations, including civil money penalties (fines) and denials of payment for new Medicare/Medicaid admissions.

Source: CMS Penalties Database (Data as of Jan 2026)

Total fines amount $75K
8% lower than Washington average

Washington average: $82K

Number of fines 1
46% fewer fines than Washington average

Washington average: 1.8

Payment Denials Info Serious action where Medicare and/or Medicaid temporarily stops payments for new residents until issues are fixed. 0
100% fewer payment denials than Washington average

Washington average: 0.3

Fines amount comparison
This facility $75K
Washington average $82K
Penalty History

Penalties are imposed by CMS for violations of federal nursing home regulations.

Civil Money Penalty Info Fines imposed for noncompliance, which can be assessed per day or per instance of violation. Aug 13, 2024
$75K

Last updated: Jan 2026

Guides for Better Senior Living

Care Cost Calculator: See Prices in Your Area

Nursing Home Data Explorer

Don’t Wait Too Long: 7 Red Flag Signs Your Parent Needs Assisted Living Now

The True Cost of Assisted Living in 2025 – And How Families Are Paying For It

Understanding Senior Living Costs: Pricing Models, Discounts & Financial Assistance

Financial Aid for Washington Seniors

Get financial aid guidance

Community Options Program Entry System (COPES)

WA Medicaid COPES

Age 65+ or disabled, Washington resident, Medicaid-eligible, nursing home-level care need.

~$2,829/month (300% FBR, individual).

$2,000 (individual), $3,000 (couple).

High demand in urban areas (e.g., Seattle).

Washington Family Caregiver Support Program

WA NFCSP

Caregiver of someone 60+ (or with dementia), Washington resident.

No strict limit; prioritizes low-income.

Not applicable.

High urban demand; rural outreach.

Community First Choice (CFC)

Washington Community First Choice

Age 65+ (or disabled 18+), WA resident, Medicaid-eligible, need help with 2+ ADLs/IADLs.

~$2,829/month; QIT optional.

$2,000 (individual), $3,000 (couple).

Broader than COPES; serves ~20,000; self-directed option.

Older Americans Act (OAA) Services

Washington OAA Services

Age 60+, WA resident; no income/asset limits.

None; donations encouraged.

Not assessed.

13 AAAs; includes Meals on Wheels; rural focus.

Medicare Savings Program (MSP)

Washington Medicare Savings Program

Age 65+ or disabled, WA resident, Medicare Part A/B.

~$2,510/month (QMB), ~$3,380/month (SLMB), ~$3,598/month (QI)—individual.

$9,430 (individual), $14,130 (couple).

Includes Extra Help for Part D; no waitlist.

Low-Income Home Energy Assistance Program (LIHEAP)

Washington LIHEAP

Age 60+ prioritized, WA resident, low-income household.

~$3,970/month (185% FPL).

Not assessed.

Covers gas, electric, wood; emergency aid available.

Senior Community Service Employment Program (SCSEP)

Washington SCSEP

Age 55+, unemployed, low-income, WA resident.

~$1,983/month (125% FPL).

Not specified.

Priority for veterans, rural residents; AARP partnership.

VA Aid and Attendance (A&A) and Housebound Benefits

Washington VA Aid and Attendance/Housebound

Age 65+ or disabled veteran/spouse, WA resident, wartime service, ADL help (A&A) or homebound.

Net income < ~$1,984/month (veteran with dependent, A&A); pension offsets income.

~$155,356 (net worth).

High veteran use; supports rural/urban needs.

Senior Citizens Property Tax Exemption

Washington Senior Property Tax Exemption

Age 61+ or disabled retiree, WA resident, homeowner, income-based.

~$45,000-$70,000/year (varies by county, e.g., King: $70,000).

Not assessed; home value cap varies (~$250,000-$400,000).

Saves ~$500-$1,500/year; offered statewide.

Senior Farmers’ Market Nutrition Program (SFMNP)

Washington SFMNP

Age 60+, WA resident, low-income.

~$2,322/month (185% FPL).

Not assessed.

Vouchers (~$80/season); serves ~20,000 via AAAs.

Tour Icon
Planning a tour? Check our touring checklist.
Chat Icon
Thinking of living here? We can help you speak to a current resident