Mission Nursing and Rehabilitation Center
Nursing Home & Memory Care · Pendleton, OR
CMS overall rating Info The Overall CMS Rating is scored from 1 to 5 stars and combines results from health inspections, staffing levels, and quality measures. Health inspections carry the most weight. Staffing and quality scores can increase or decrease the final rating based on performance compared to state and national standards.

Mission Nursing and Rehabilitation Center

Nursing Home & Memory Care · Pendleton, OR
CMS overall rating Info The Overall CMS Rating is scored from 1 to 5 stars and combines results from health inspections, staffing levels, and quality measures. Health inspections carry the most weight. Staffing and quality scores can increase or decrease the final rating based on performance compared to state and national standards.
Calculator: See prices in your area
Mission Nursing and Rehabilitation Center accepts Medicare, Medicaid, and private pay.

Overview of Mission Nursing and Rehabilitation Center

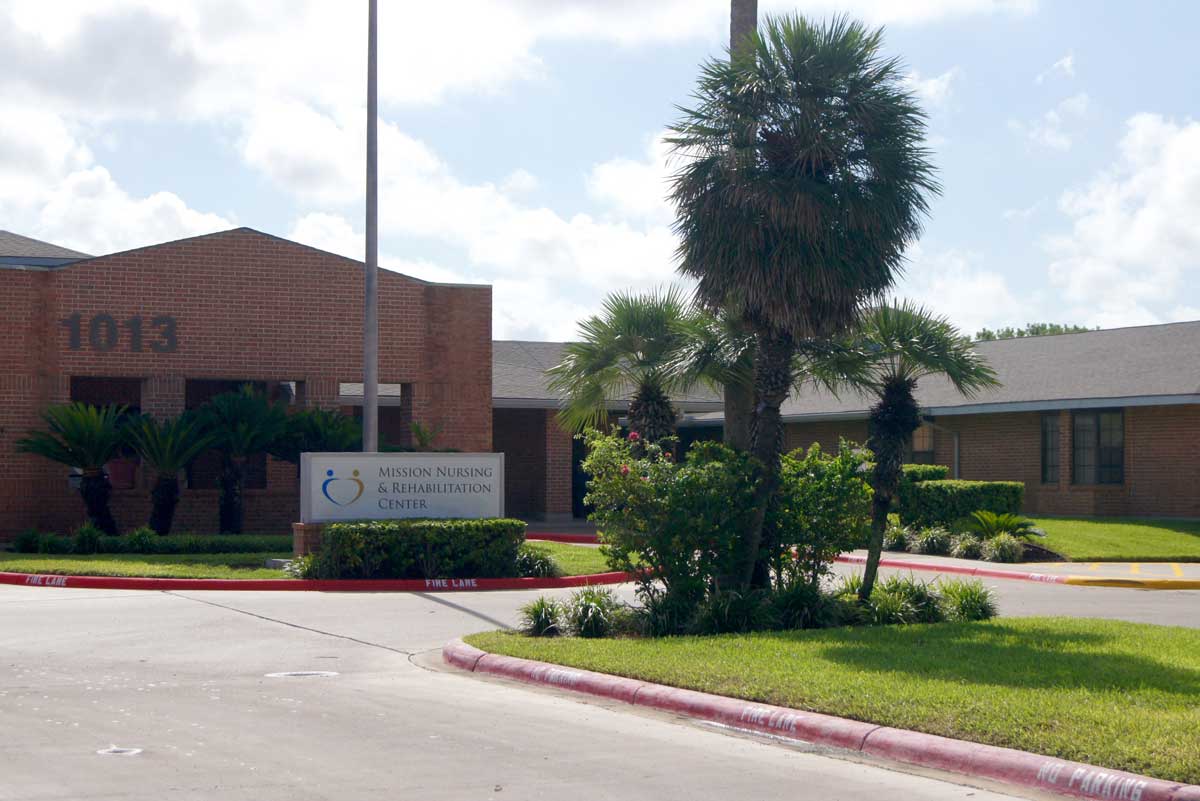
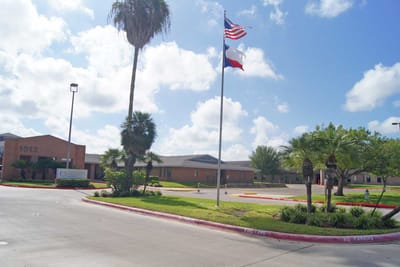
Mission Nursing and Rehabilitation Center is a well-regarded nursing home in Mission, TX, offering long-term care, memory care, rehabilitation, and skilled nursing. The community also ensures older adults are treated like family, especially with its warm and nurturing environment. With 24-hour care, medication management, and nutritious meals, residents experience a worry-free retirement. Through a personalized approach to care, residents receive the utmost attention for their needs and habits.

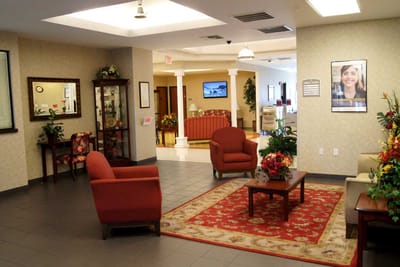
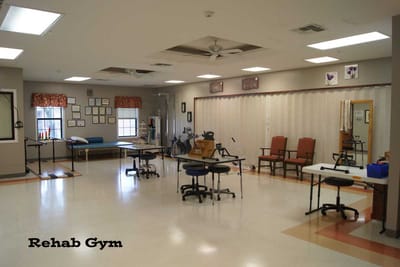
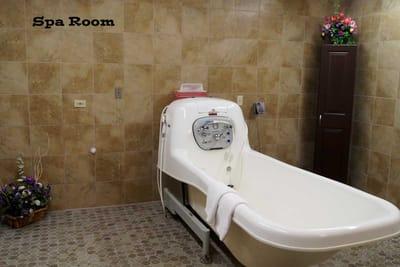
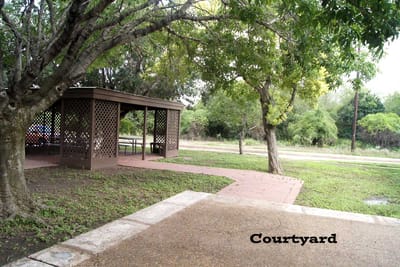
Exercises, social events, and a variety of recreational programs help enhance residents’ holistic wellness. A spa room, a lively dining room, and spacious courtyards are among the top-notch amenities that aim to keep residents happy and safe. Mission Regional Medical Center, restaurants, shops, and Interstate 2 are also located nearby, ensuring residents have easy access to their necessities and leisure. As one of the best choices for senior living in Texas, this nursing home continuously provides exceptional care for older adults’ welfare.

(956) 580-2100

Quality ratings

Measured by Centers for Medicare & Medicaid Services (CMS)

Overall rating Info The Overall CMS Rating combines results from health inspections, staffing levels and quality measures. Health inspections carry the most weight. Staffing and quality scores can increase or decrease the final rating based on performance compared to state and national standards.
▲ 66.7% Above OR avg. ▲ 66.7% Above OR avg.Click the badge to see the full State ranking.Click here to see the full State ranking.
Health Inspection Info Based on the results of the facility's three most recent standard inspections and any complaint investigations. CMS reviews the number, scope, and severity of deficiencies, with more recent findings weighted more heavily.
▲ 44.7% Above OR avg. ▲ 44.7% Above OR avg.Click the badge to see the full State ranking.Click here to see the full State ranking.
Staffing Info Measures average nursing staff hours per resident per day, including Registered Nurses (RNs) and total nursing staff. Ratings are adjusted based on the level of care residents require and are compared to state and national benchmarks.
▼ 19.2% Below OR avg. ▼ 19.2% Below OR avg.Click the badge to see the full State ranking.Click here to see the full State ranking.
Quality Measures Info Based on clinical and physical health indicators reported to CMS, such as hospital readmissions, falls, pressure ulcers, and improvements in mobility. These measures reflect how well residents' health needs are being managed.
▲ 45.2% Above OR avg. ▲ 45.2% Above OR avg.Click the badge to see the full State ranking.Click here to see the full State ranking.

Staffing hours breakdown

Info Daily nursing hours per resident by staff type, reported to CMS. Higher is generally better — compare this facility to state and national averages to see where staffing stands.

Hours per resident per day — compared to Oregon state averages

Total nursing care / resident Info This home is ranked 140th out of 289 homes in Oregon. Total adjusted nursing hours per resident per day, combining RN, LPN, and aide time. CMS adjusts this for case-mix so facilities can be fairly compared.
3h 31m per day
Rank #140 / 289Nurse hours — State benchmarkedThis home is ranked 140th out of 289 homes in Texas. Shows adjusted nurse hours per resident per day benchmarked to the Texas average, with a ranking across 289 Texas SNFs. More hours mean more direct care. The national average is about 3.5 hrs; below 3.0 is a red flag.Click the rank badge to see the full State ranking.Click here to see the full State ranking.
This facility Oregon avg (5h 15m per day)
vs Oregon avg
-33%

2 of 6 metrics below state avg

Standout metric Registered Nurse (RN) is +15% above state avg
Staff typeHours / Day / Residentvs state avg
Registered Nurse (RN) Info RNs hold the highest nursing license and can assess residents, interpret test results, and direct care plans. More RN hours per day often signals stronger clinical oversight and faster response to health changes. 30m per day ▲ 15% State avg: 26m per day · National avg: 41m per day
LPN / LVN Info Licensed Practical Nurses (LPNs) or Licensed Vocational Nurses (LVNs) deliver routine hands-on care — medication administration, wound dressing, and monitoring vital signs. They work under RN supervision and make up a large share of daily bedside care. 52m per day ▼ 9% State avg: 57m per day · National avg: 52m per day
Nurse Aide Info Certified Nurse Aides (CNAs) provide the most direct day-to-day assistance: bathing, dressing, feeding, and mobility. Nurse aide hours are typically the largest staffing category and directly affect residents' quality of life. 2h 10m per day ▲ 7% State avg: 2h 1m per day · National avg: 2h 21m per day
Weekend Total Nursing Info Combined nursing hours (RN + LPN + Nurse Aide) per resident per day on weekends. Staffing often drops on weekends — this figure reveals whether the facility maintains adequate coverage outside of weekday hours. 3h 2m per day ■ Avg State avg: 2h 59m per day · National avg: 3h 26m per day
Physical Therapist Info Hours per resident per day provided by licensed Physical Therapists (PTs) or PT Assistants. PT services help residents recover mobility after injury or illness and are especially important for post-acute (short-stay) rehabilitation. 4m per day ■ Avg State avg: 4m per day · National avg: 4m per day
Weekend RN Info Registered nurse hours specifically on weekends. Facilities sometimes reduce RN presence on Saturdays and Sundays — a low weekend RN figure compared to weekday hours can indicate reduced clinical oversight when most administrative staff are absent. 18m per day ▼ 14% State avg: 21m per day · National avg: 29m per day

Types of Care at Mission Nursing and Rehabilitation Center

Nursing Home Memory Care

Capacity and availability

This home usually has availability

Lower occupancy than the Oregon average: 65.7%
Occupancy rate
52.9% Rank #230 / 297Occupancy rate — State benchmarkedThis home is ranked 230th out of 297 homes in Texas. Shows this facility's occupancy rate versus the Texas average, with its Statewide rank out of 297. Higher occupancy signals strong local demand and financial stability.Click the rank badge to see the full State ranking.Click here to see the full State ranking.
Avg. Length of Stay
90 days
Walk Score
Walk Score: 20 / 100 Rank #1094 / 1392Walk Score — State benchmarkedThis home is ranked 1094th out of 1392 homes in Texas. Shows how walkable this facility's neighborhood is compared to the average Walk Score across Texas SNFs. Higher scores benefit residents, families, and staff.Click the rank badge to see the full State ranking.Click here to see the full State ranking.
Car-dependent. Most errands require a car, with limited nearby walkable options.

Contact Mission Nursing and Rehabilitation Center

Staffing Data

Reporting period: October 1 – December 31, 2025 (Q4 2025). Source: CMS Payroll-Based Journal report.

Total staff 109
Employees 92
Contractors 17
Staff to resident ratio 1.42:1
52% worse than Oregon average
Oregon average ratio: 2.93:1 Oregon average ratio: 2.93:1See full Oregon ranking
Avg staff/day 45
Average shift 7.9 hours
0% compared with Oregon average
Oregon average: 7.8 hours Oregon average shift: 7.8 hoursSee full Oregon ranking
Total staff hours (quarter) 32,637

Nursing staff breakdown

Q4 2025 · Oct 1 – Dec 31 More info This data comes from the CMS Payroll-Based Journal report covering October 1 – December 31, 2025.
Registered Nurse

Manages medical care and health needs.

RN Staff Info All 11 RN Staff are full-time employees. No contractors work on this role. 11
Average shift length Info Average shift length. Calculated as total hours divided by days worked and average staff per day. 8.9 hours
Licensed Practical Nurse

Assists with medical care and medications.

LPN Staff Info All 24 LPN Staff are full-time employees. No contractors work on this role. 24
Average shift length Info Average shift length. Calculated as total hours divided by days worked and average staff per day. 8.5 hours
Certified Nursing Assistant

Helps with daily care and mobility.

CNA Staff Info All 48 CNA Staff are full-time employees. No contractors work on this role. 48
Average shift length Info Average shift length. Calculated as total hours divided by days worked and average staff per day. 7.5 hours

Contractor staffing

Q4 2025 · Oct 1 – Dec 31 More info This data comes from the CMS Payroll-Based Journal report covering October 1 – December 31, 2025.

Total hours from contractors

8.5%

2,761 contractor hours this quarter

Physical Therapy Aide: 5 Speech Language Pathologist: 3 Respiratory Therapy Technician: 3 Physical Therapy Assistant: 2 Qualified Social Worker: 2 Medical Director: 1 Occupational Therapy Aide: 1

Staff by category

Q4 2025 · Oct 1 – Dec 31 More info This data comes from the CMS Payroll-Based Journal report covering October 1 – December 31, 2025.
Certified Nursing Assistant4804815,28592100%7.5
Licensed Practical Nurse240247,51892100%8.5
Registered Nurse110113,30192100%8.9
Medication Aide/Technician4042,03492100%11.6
Physical Therapy Aide0556437582%5.8
Physical Therapy Assistant0225247177%6.4
Respiratory Therapy Technician0334927379%6.7
Speech Language Pathologist0334837177%6.5
Qualified Social Worker0224746571%7.3
Administrator1014656267%7.5
Dietitian1014405964%7.5
Mental Health Service Worker1014285762%7.5
Nurse Practitioner1014055459%7.5
Occupational Therapy Aide0111161213%9.6
Medical Director011301213%2.5
Qualified Activities Professional101211%2
48 Certified Nursing Assistant
% of Days 100%
24 Licensed Practical Nurse
% of Days 100%
11 Registered Nurse
% of Days 100%
4 Medication Aide/Technician
% of Days 100%
5 Physical Therapy Aide
% of Days 82%
2 Physical Therapy Assistant
% of Days 77%
3 Respiratory Therapy Technician
% of Days 79%
3 Speech Language Pathologist
% of Days 77%
2 Qualified Social Worker
% of Days 71%
1 Administrator
% of Days 67%
1 Dietitian
% of Days 64%
1 Mental Health Service Worker
% of Days 62%
1 Nurse Practitioner
% of Days 59%
1 Occupational Therapy Aide
% of Days 13%
1 Medical Director
% of Days 13%
1 Qualified Activities Professional
% of Days 1%

Penalties and fines

Includes penalties issued in 2023

Federal penalties imposed by CMS for regulatory violations, including civil money penalties (fines) and denials of payment for new Medicare/Medicaid admissions.

Source: CMS Penalties Database (Data as of Jan 2026)

Total fines amount $8K Rank #86 / 294Federal fines — State benchmarkedThis home is ranked 86th out of 294 homes in Texas. Shows this facility's cumulative CMS federal fine dollars versus the Texas average among facilities with fines, and where it ranks among 294 skilled nursing facilities in the pool. Lower total dollars mean a better rank.Click the rank badge to see the full State ranking.Click here to see the full State ranking.
90% lower than Oregon average

Oregon average: $80K

Number of fines 1
60% fewer fines than Oregon average

Oregon average: 2.5

Payment Denials Info Serious action where Medicare and/or Medicaid temporarily stops payments for new residents until issues are fixed. 0
100% fewer payment denials than Oregon average

Oregon average: 0.2

Fines amount comparison
This facility $8K
Oregon average $80K
Penalty History

Penalties are imposed by CMS for violations of federal nursing home regulations.

1 penalty in the past 3 years

Oct 6, 2023 · $8K

Civil Money Penalty Info Fines imposed for noncompliance, which can be assessed per day or per instance of violation. Oct 6, 2023
$8K

Last updated: Jan 2026

Quality of care over time

These measures show how residents usually do over time at this home, based on health outcomes and preventive care.

High-risk clinical events score Info A composite score based on pressure ulcers, falls with injury, weight loss, walking ability decline, and activities of daily living decline. 4.2
52% better than Oregon average

Oregon average: 8.6

Functional decline score Info A composite score based on activities of daily living decline, walking ability decline, and incontinence. 6.4
60% better than Oregon average

Oregon average: 16.0

Long-stay resident measures
Significantly above average Info CMS star rating based on long-stay quality measure performance. 5 stars = significantly above average, 1 star = significantly below average.
Need for Help with Daily Activities Increased Info Percent of long-stay residents whose need for help with daily activities has increased 9.8%
39% better than Oregon average

Oregon average: 16.2%

Walking Ability Worsened Info Percent of long-stay residents whose ability to move independently worsened 8.4%
48% better than Oregon average

Oregon average: 16.2%

Low Risk Residents with Bowel/Bladder Incontinence Info Percent of low risk long-stay residents who lose control of their bowels or bladder 1.0%
94% better than Oregon average

Oregon average: 15.7%

Falls with Major Injury Info Percent of long-stay residents experiencing one or more falls with major injury 1.0%
70% better than Oregon average

Oregon average: 3.2%

High Risk Residents with Pressure Ulcers Info Percent of long-stay high risk residents with pressure ulcers 1.2%
73% better than Oregon average

Oregon average: 4.4%

Urinary Tract Infection Info Percent of long-stay residents with a urinary tract infection 0.0%
100% better than Oregon average

Oregon average: 0.8%

Lost Too Much Weight Info Percent of long-stay residents who lose too much weight 0.4%
89% better than Oregon average

Oregon average: 3.5%

Depressive Symptoms Info Percent of long-stay residents who have depressive symptoms 0.4%
87% better than Oregon average

Oregon average: 2.9%

Antipsychotic Use Info Percent of long-stay residents who received an antipsychotic medication 7.6%
In line with Oregon average

Oregon average: 7.9%

Pneumococcal Vaccine Info Percent of long-stay residents assessed and appropriately given the pneumococcal vaccine 100.0%
In line with Oregon average

Oregon average: 97.3%

Influenza Vaccine Info Percent of long-stay residents assessed and appropriately given the seasonal influenza vaccine 100.0%
In line with Oregon average

Oregon average: 97.9%

Hospitalizations per 1,000 days Info Number of hospitalizations per 1,000 long-stay resident days. 1.40
34% better than Oregon average

Oregon average: 2.13

ED visits per 1,000 days Info Number of outpatient emergency department visits per 1,000 long-stay resident days. 1.89
9% better than Oregon average

Oregon average: 2.07

Short-stay resident measures
Average Info CMS star rating based on short-stay quality measure performance. 5 stars = much above average, 1 star = much below average.
Pneumococcal Vaccine Info Percent of short-stay residents assessed and appropriately given the pneumococcal vaccine 100.0%
11% better than Oregon average

Oregon average: 90.4%

Antipsychotic medication increase Info Percent of short-stay residents who newly received an antipsychotic medication 0.8%
47% better than Oregon average

Oregon average: 1.4%

Influenza Vaccine Info Percent of short-stay residents assessed and appropriately given the seasonal influenza vaccine 100.0%
14% better than Oregon average

Oregon average: 88.0%

Re-hospitalized after SNF stay Info Percentage of short-stay residents who were re-hospitalized after their nursing home admission. 24.7%
5% better than Oregon average

Oregon average: 25.9%

Emergency department visits Info Percentage of short-stay residents who had an outpatient emergency department visit. 8.6%
28% better than Oregon average

Oregon average: 12.0%

Falls with major injury Info Percentage of SNF residents who experience falls with major injury during their stay. 0.0%
100% better than Oregon average

Oregon average: 0.8%

Ability to care for self at discharge Info Percentage of residents at or above expected ability to care for themselves at discharge. 54.1%
In line with Oregon average

Oregon average: 53.7%

Successful return to home or community Info Rate of successful return to home or community from a skilled nursing facility. 54.5%
8% better than Oregon average

Oregon average: 50.6%

Breakdown by payment type

Medicare

15% of new residents, usually for short-term rehab.

Typical stay 20 days

Private pay

63% of new residents, often for short stays.

Typical stay 19 days

Medicaid

22% of new residents, often for long-term daily care.

Typical stay 10 - 11 months

Facility Characteristics

Source: CMS Long-Term Care Facility Characteristics (Data as of Jan 2026)

Total residents 77
Medicare
8
10.4% of residents
Medicaid
66
85.7% of residents
Private pay or other
3
3.9% of residents
Programs & Services
Residents Group

Residents meet regularly to discuss policies, care quality, and activities

Active Resident Council

Organized group of residents that meets regularly to discuss facility policies, quality of life, and activities.

Finances and operations

Governmental community
Operated by state authorities.
Home revenue
$11.2M
Surplus of revenue
$153.4K
Governmental community Operated by state authorities.
Home revenue
$11.2M Rank #141 / 297Revenue — State benchmarkedThis home is ranked 141st out of 297 homes in Texas. Shows this facility's annual revenue compared to the Texas SNF average. Higher revenue generally means more resources for staffing and capital — read alongside Payroll %.Click the rank badge to see the full State ranking.Click here to see the full State ranking.
Surplus of revenue
$153.4K
Payroll costs Info The portion of the home's budget spent on staff, including nurses, caregivers, and other employees who support care and operations. Rank #210 / 297Payroll — State benchmarkedThis home is ranked 210th out of 297 homes in Texas. Shows total annual staff payroll benchmarked to the Texas average. Higher payroll investment relative to peers often signals better staffing and less reliance on cheaper contract labor.Click the rank badge to see the full State ranking.Click here to see the full State ranking.
$4.2M
37.1% of revenue Rank #251 / 297Payroll % — State benchmarkedThis home is ranked 251st out of 297 homes in Texas. Shows payroll as a percentage of revenue versus the Texas average. Well-run Texas SNFs typically land around 51–63% — the top third Statewide. Below 25% may signal understaffing or heavy agency use — read with Staffing ratings.Click the rank badge to see the full State ranking.Click here to see the full State ranking.
Other operating costs Info All remaining costs needed to run the home, such as food, utilities, building maintenance, supplies and administrative expenses.
$6.9M
Total costs $11.1M

What does this home offer?

Housing options icon

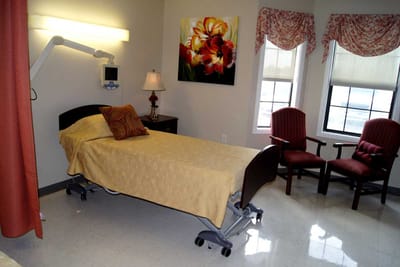
Housing Options: Private / Semi-Private Rooms

Building type icon
Building type icon

Building Type: Single-story

Dining services icon

Dining Services

Rehabilitative support icon

Rehabilitative Support

On-site medical care and health services icon

On-site Medical Care and Health Services

Personal care icon
Personal care icon

Personal Care Assistance

Social and recreational activities icon

Social and Recreational Activities

Beauty services icon

Beauty Services

Housekeeping icon
Housekeeping icon

Housekeeping Services

Transportation services icon

Transportation Services

Who this home usually serves

TYPE OF STAY

Primarily long-term care, limited rehab

Most residents stay long-term, while a smaller portion are admitted for short-term rehab.

Places of interest near Mission Nursing and Rehabilitation Center

Address 2.9 miles from city center Info Estimated distance in miles from Mission's city center to Mission Nursing and Rehabilitation Center's address, calculated via Google Maps.

Calculate Travel Distance to Mission Nursing and Rehabilitation Center

Add your location

Address

Financial Assistance for
Nursing Home in Oregon

Mission Nursing and Rehabilitation Center is located in Mission, Oregon.
Here are the financial assistance programs available to residents in Oregon.

Get Financial aid guidance

Oregon Project Independence (OPI)

OPI

Age 60+
General Oregon resident, at risk of nursing home but not Medicaid-eligible.
Income Limits ~$2,000/month individual, varies
Asset Limits $5,000 individual
OR

Cost-sharing required; rural/urban balance.

Benefits
In-home care (3-5 hours/week) Respite (up to 10 days/year) Adult day care (~$70/day) Transportation (~5 trips/month)

Oregon Medicaid Community-Based Care

OR Medicaid CBC

Age 65+ or disabled
General Oregon resident, Medicaid-eligible, nursing home-level care need.
Income Limits (2025) ~$2,829/month 300% FBR, individual
Asset Limits $2,000 (individual), $3,000 (couple).
OR

High demand in urban areas (e.g., Portland).

Benefits
Personal care (5-7 hours/day) Respite (240 hours/year) Adult day care ($70/day) Home modifications ($1,500 avg.)

Program of All-Inclusive Care for the Elderly (PACE)

Oregon PACE (e.g., Providence ElderPlace)

Age 55+
General OR resident (specific counties), NFLOC, safe with PACE support.
Income Limits (2025) ~$2,829/month (Medicaid-eligible); private pay option available.
Asset Limits $2,000 (individual), $3,000 (couple) for Medicaid enrollees.
OR

Available in 11 counties (e.g., Multnomah, Washington); Providence ElderPlace dominant provider.

Benefits
Personal care (5-7 hours/day) Medical care Meals Transportation Respite Therapies

Medicare Savings Program (MSP)

Oregon Medicare Savings Program

Age 65+ or disabled
General OR resident, Medicare Part A/B.
Income Limits (2025) ~$2,510/month (QMB), ~$3,380/month (SLMB), ~$3,598/month (QI)—individual.
Asset Limits $9,430 (individual), $14,130 (couple).
OR

Three tiers; includes Extra Help for Part D; no waitlist.

Benefits
Covers Part B premiums ($174.70/month) Deductibles ($240/year) Copays (~20%)

Family Caregiver Support Program (FCSP)

Oregon Family Caregiver Support Program

Age
General Caregivers of 60+ needing care or 55+ caregivers of others; OR resident; functional needs (2+ ADLs).
Income Limits (2025) No strict cap; prioritizes low-income ~$24,980/year
Asset Limits Not assessed; need-based.
OR

15 regions; rural priority; includes grandparent caregivers.

Benefits
Respite (4-6 hours/week or 5 days/year) Adult day care ($60/day) Training Supplies (~$500/year)

VA Aid and Attendance (A&A) and Housebound Benefits

Oregon VA Aid and Attendance/Housebound

Age 65+ or disabled veteran/spouse
General OR resident, wartime service, need for ADL help (A&A) or homebound.
Income Limits (2025) Net income < ~$1,984/month (veteran with dependent, A&A); pension offsets income.
Asset Limits ~$155,356 net worth limit
OR

High veteran demand; Oregon Veterans’ Homes option.

Benefits
Cash (~$1,433-$2,642/month veteran, ~$951-$1,318 spouse) for care costs (e.g., in-home, assisted living)

Senior Property Tax Deferral Program

Oregon Property Tax Deferral for Disabled and Senior Citizens

Age 62+
General OR resident, homeowner 5+ years, low-income.
Income Limits (2025) ~$58,000/year household, adjusted annually
Asset Limits Home value < county median; equity > 15%.
OR

Deferred taxes accrue 6% interest; repaid upon sale/death.

Benefits
Tax deferral (~$1,000-$3,000/year avg., varies by county)

Elderly Nutrition Program (ENP)

Oregon Elderly Nutrition Program

Age 60+
General OR resident (or spouse of any age); no income limit.
Income Limits (2025) None; donations encouraged.
Asset Limits Not assessed.
OR

Includes Meals on Wheels; prioritizes homebound/low-income.

Benefits
Home-delivered or congregate meals (~$5-$7/meal value, 5 meals/week avg.)

Compare Nursing Home around Pendleton

The information below is reported by the Oregon Department of Human Services, Aging and People with Disabilities.

2 facilities compared · CMS & OR Dept. of Health data

Filter by care type
Mission Nursing and Rehabilitation Center
NH

Nursing Home Licensed facility providing 24/7 skilled nursing care for residents with complex, ongoing medical needs. Staffed by RNs, LPNs, and CNAs. Inspected and star-rated annually by CMS. Accepts Medicare (short-term rehab) and Medicaid (long-term care).

MC

Memory Care Secured, specialized care for people living with Alzheimer's or dementia. Staff trained in cognitive impairment, with higher staff-to-resident ratios and an environment designed to reduce confusion and wandering risk.

Mission170--3.52 +32%-3%$8.2k192.7189 20 Hmg Park Manor Of Mission, LLC$11.2M$4.2M37.1%455761
Mission Valley Nursing and Transitional Care
NH

Nursing Home Licensed facility providing 24/7 skilled nursing care for residents with complex, ongoing medical needs. Staffed by RNs, LPNs, and CNAs. Inspected and star-rated annually by CMS. Accepts Medicare (short-term rehab) and Medicaid (long-term care).

HC

Home Care Professional care delivered in the person's own home — from companionship and errands to skilled nursing and therapy. Allows seniors to age in place. Medicare covers skilled home health when medically necessary.

RC

Respite Care Short-term temporary care — days to weeks — to give family caregivers a break. Full care provided during the stay. Often used after hospitalization or to trial a facility before a permanent placement decision.

Mission120--3.33 -3%-8%$0172.83116 11 Mission Valley Nursing And Transitional Care LLC$14.4M$6.5M45.3%676446

Frequently Asked Questions about Mission Nursing and Rehabilitation Center

What neighborhood is Mission Nursing and Rehabilitation Center in?

Mission Nursing and Rehabilitation Center is in the Mission neighborhood.

Is Mission Nursing and Rehabilitation Center in a walkable area?

Mission Nursing and Rehabilitation Center has a walk score of 20. Car-dependent. Most errands require a car, with limited nearby walkable options.

Are there photos of Mission Nursing and Rehabilitation Center?

Yes — there are 8 photos of Mission Nursing and Rehabilitation Center in the photo gallery on this page.

What is the address of Mission Nursing and Rehabilitation Center?

Mission Nursing and Rehabilitation Center is located at 1013 S Bryan Rd, Mission, TX 78572.

What is the phone number of Mission Nursing and Rehabilitation Center?

(956) 580-2100 will put you in contact with the team at Mission Nursing and Rehabilitation Center.

Is Mission Nursing and Rehabilitation Center Medicare or Medicaid certified?

Yes — Mission Nursing and Rehabilitation Center is a CMS-certified provider of Medicare and Medicaid.

Guides for Better Senior Living

Care Cost Calculator: See Prices in Your Area

Nursing Home Data Explorer

Don’t Wait Too Long: 7 Red Flag Signs Your Parent Needs Assisted Living Now

The True Cost of Assisted Living in 2025 – And How Families Are Paying For It

Understanding Senior Living Costs: Pricing Models, Discounts & Financial Assistance

Explore Open Rooms
1 Contact details
2 What type of senior care service are you looking for?
3 What budget do you have in mind for senior care?
4 How soon do you need to find care?
5 Additional details

Thank you for your interest!

Our team will be in touch shortly to help with next steps.