


Total health inspections
8
Ohio average 6.7
Last Health inspection on Jul 2025
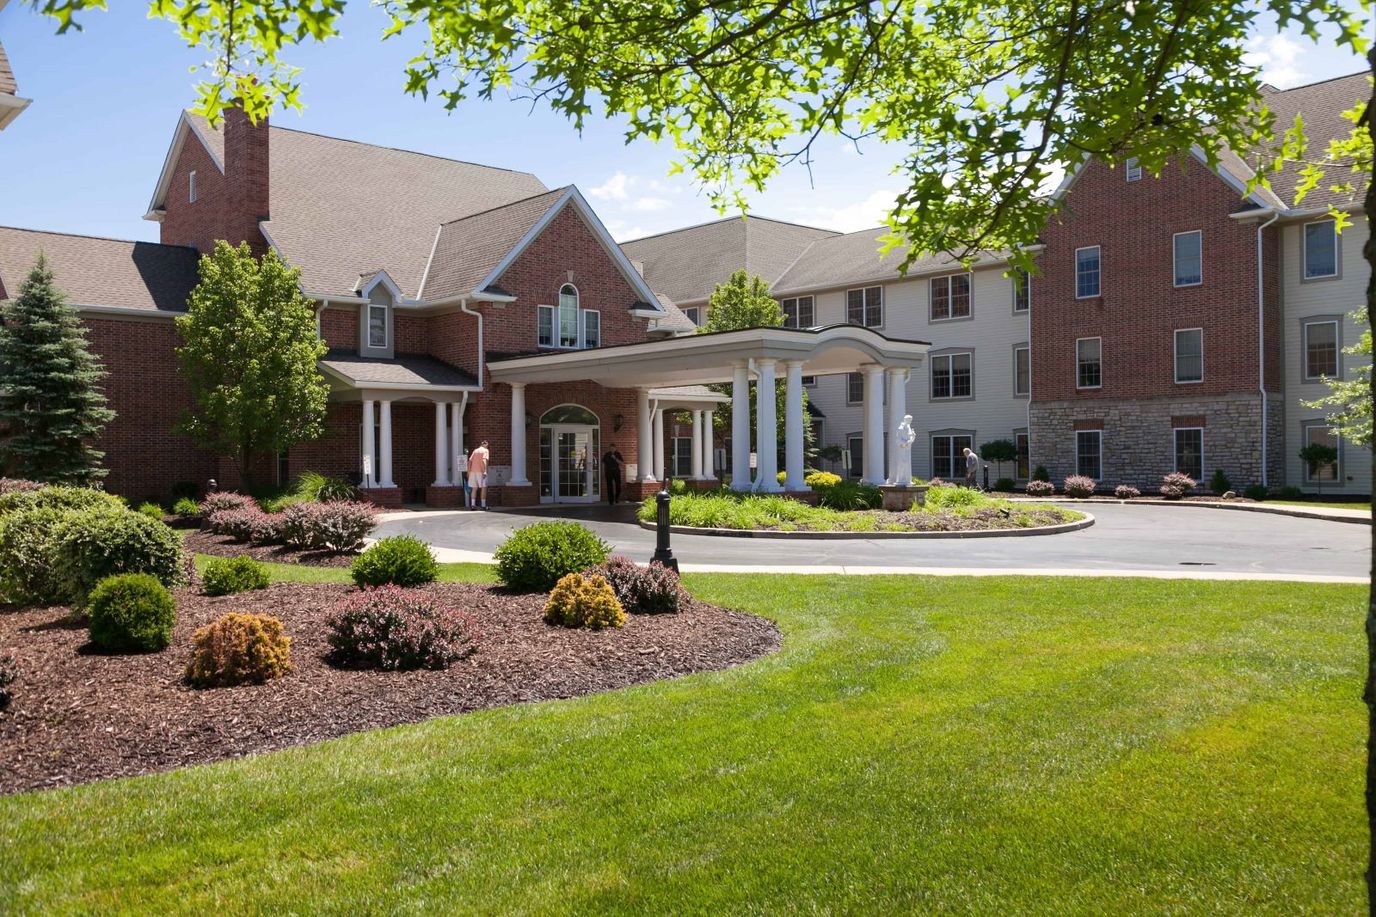

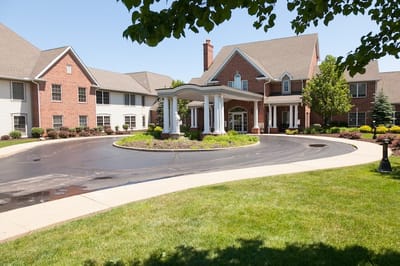
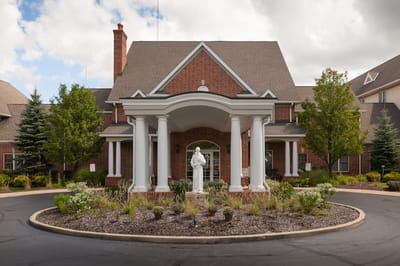
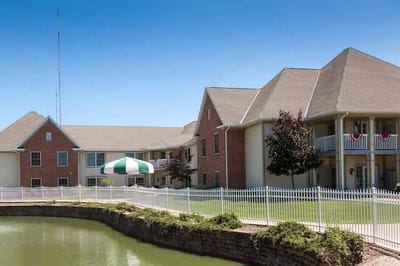
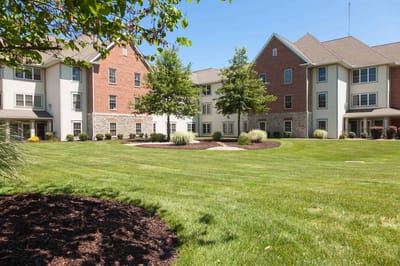
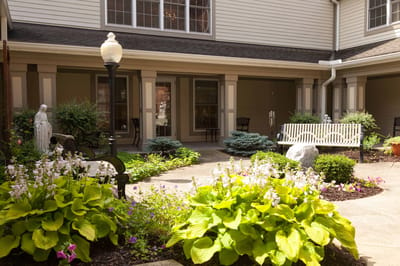
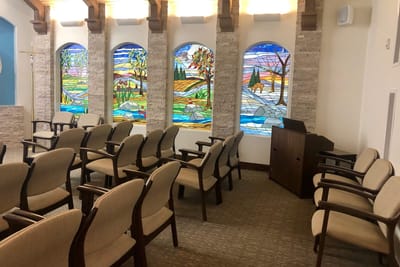
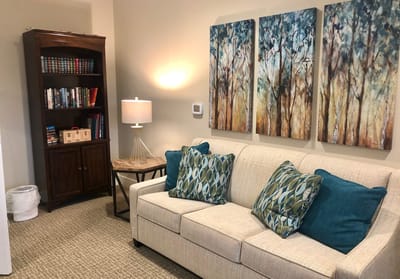
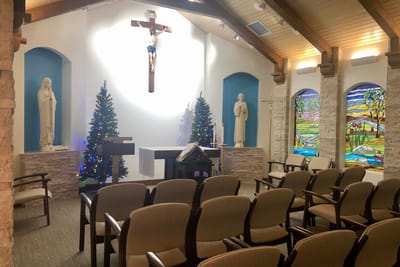
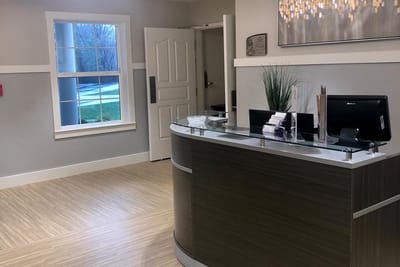
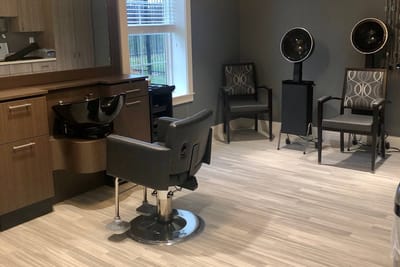

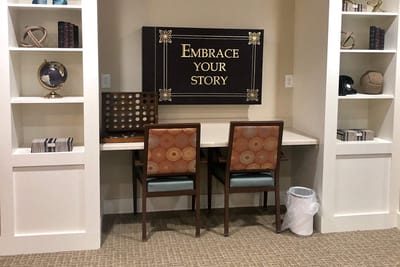
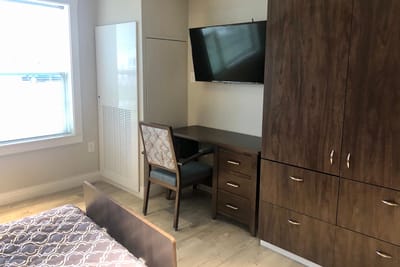

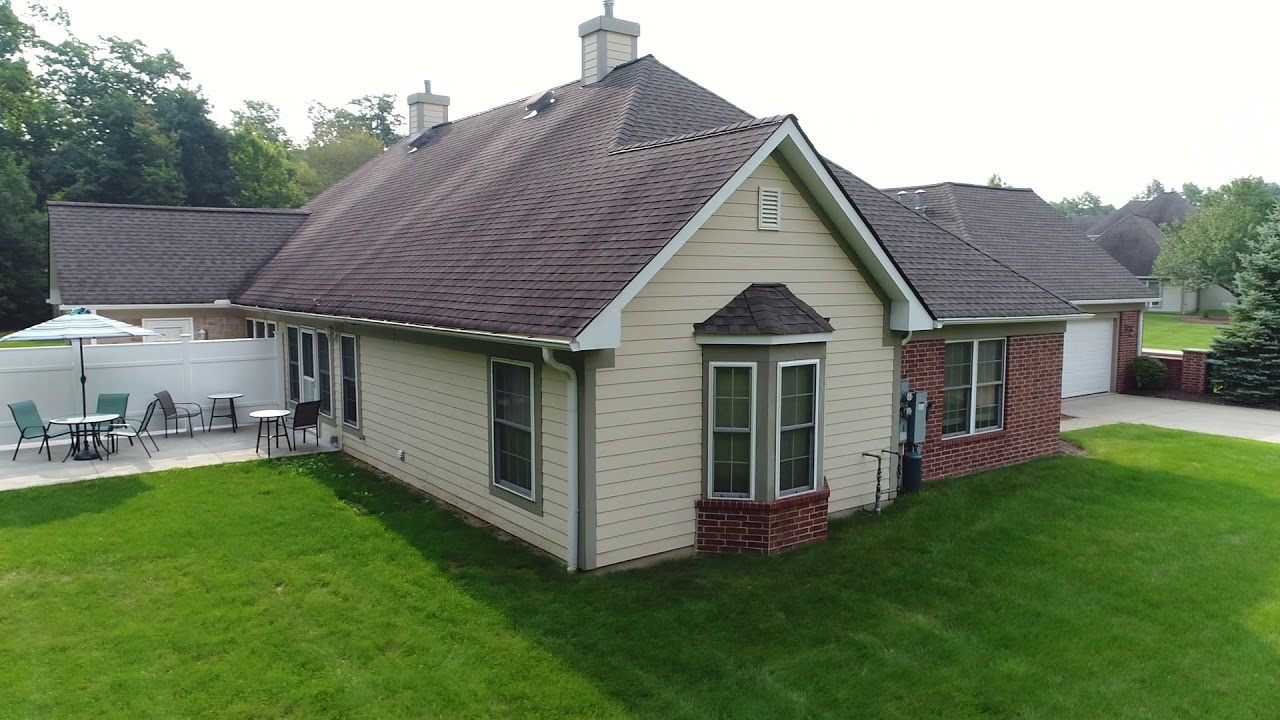
A member of the Franciscan Communities, Mount Alverna Village is a senior living community offering independent living, assisted living, memory care, skills nursing, and senior rehabilitation. In its 24-acre campus in Parma, residents can relax and roam around their landscaped courtyard, patio, walking paths and gardening areas. Additionally, they can also go to senior centers, restaurants, retail shops, city parks, and beaches that can be found in the area. With specialty programs carefully designed to meet individual needs, they seek to provide the highest level of quality care and comfort for their residents. A defining feature of this community is their extensive list of clinical capabilities which range from wound care and post-surgical care to acute and chronic complex medical care.
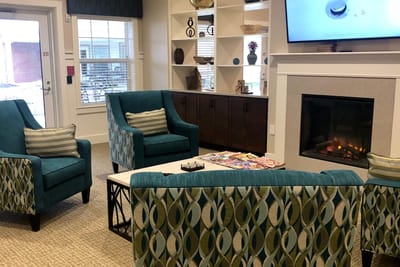
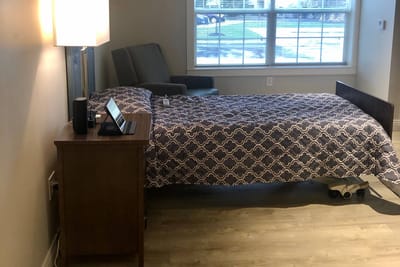
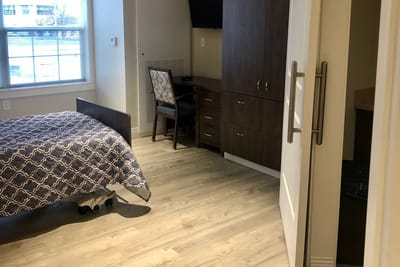
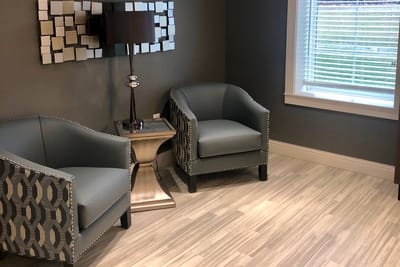
From traditional activities that promote an active lifestyle to personalized plans to enhance and enrich lives, Mount Alverna Village strives to provide a warm and welcoming environment for every senior who wants to celebrate life with peace of mind. They highlight their approach in encouraging seniors to celebrate life while giving them the independence and respect they deserve.
| Staff type | Hours / Day / Resident | vs state avg |
|---|---|---|
|
Registered Nurse (RN)
| 24m per day | ▼ 37% State avg: 38m per day · National avg: 41m per day |
|
LPN / LVN
| 1h 17m per day | ▲ 33% State avg: 58m per day · National avg: 52m per day |
|
Nurse Aide
| 2h 15m per day | ▲ 6% State avg: 2h 7m per day · National avg: 2h 20m per day |
|
Weekend Total Nursing
| 3h 34m per day | ▲ 7% State avg: 3h 20m per day · National avg: 3h 27m per day |
|
Physical Therapist
| 3m per day | ▼ 20% State avg: 3m per day · National avg: 4m per day |
|
Weekend RN
| 18m per day | ▼ 29% State avg: 25m per day · National avg: 29m per day |
Key information about the people who lead and staff this community.
In Ohio, the Department of Health, Bureau of Survey and Certification conducts unannounced onsite inspections to evaluate the quality of care and environment in all licensed facilities.
Citations
| This Facility | OH Average | vs. OH Avg |
|---|---|---|---|
|
Total citations
| 2 | 2 | This facility has total citations in line with the Ohio average (2 vs. OH avg 2).— At avg |
Every two years, the Ohio Department of Aging and the Office of the State Long-Term Care Ombudsman organizations conduct a satisfaction survey among residents in long-term care facilities to assess their quality of care and life.
Ohio average: 86 / 100
Ohio average: 89 / 100
Ohio average: 95 / 100
Ohio average: 82 / 100
Ohio average: 86 / 100
Ohio average: 89 / 100
Ohio average: 80 / 100
Ohio average: 81 / 100
Based on the RCF Resident Satisfaction Survey 2022-23, Final Results
Have you gotten or are you getting physical therapy, occupational therapy or speech therapy, while living at this care facility?
This facility63/100
Ohio average46/100
Did (Does) the therapy help you meet your goals?
This facility90/100
Ohio average88/100
Did (Do) the therapists help you set goals?
This facility90/100
Ohio average89/100
Can you decide how to spend your day?
This facility94/100
Ohio average94/100
Did (Do) you know who to speak to about your therapy progress?
This facility100/100
Ohio average85/100
Scores represent percent of positive resident responses for each item, excluding "don't know" and "not applicable" responses and instances where the question was skipped.
Based on the RCF Resident Satisfaction Survey 2022-23, Final Results
Can you enjoy the outdoors if you want to?
This facility88/100
Ohio average91/100
Do you feel safe here?
This facility100/100
Ohio average98/100
Are your personal items safe here?
This facility100/100
Ohio average92/100
Do you feel you have enough privacy?
This facility100/100
Ohio average95/100
Are you able to get around the building if you want to?
This facility100/100
Ohio average95/100
Is it easy for you to get around in your room (or apartment)?
This facility100/100
Ohio average96/100
Is it very clean here?
This facility100/100
Ohio average96/100
Can you find a place to be alone if you want to be alone?
This facility100/100
Ohio average96/100
Scores represent percent of positive resident responses for each item, excluding "don't know" and "not applicable" responses and instances where the question was skipped.
Based on the RCF Resident Satisfaction Survey 2022-23, Final Results
Did you receive a thorough orientation to MOUNT ALVERNA VILLAGE?
This facility69/100
Ohio average70/100
Were you given enough information to learn how things work here?
This facility79/100
Ohio average82/100
Did you feel warmly welcomed as a new resident?
This facility100/100
Ohio average93/100
Scores represent percent of positive resident responses for each item, excluding "don't know" and "not applicable" responses and instances where the question was skipped.
Based on the RCF Resident Satisfaction Survey 2022-23, Final Results
Are you as involved in decisions about your care as you want to be?
This facility73/100
Ohio average85/100
Are you encouraged to speak up about things you don’t like here?
This facility75/100
Ohio average81/100
Overall, are you satisfied with the care you receive here?
This facility94/100
Ohio average94/100
Do the people who work here help you with technology, if needed?
This facility94/100
Ohio average89/100
Are you friends with anyone who lives here?
This facility94/100
Ohio average81/100
Are your concerns taken care of in a timely way?
This facility100/100
Ohio average86/100
Do the people who work here seem happy to work here?
This facility100/100
Ohio average92/100
Do the people who work here go above and beyond to give you a good life?
This facility100/100
Ohio average87/100
Do the people who work here tell you when rules, policies, and procedures change?
This facility100/100
Ohio average78/100
Would you highly recommend MOUNT ALVERNA VILLAGE to someone who needs this type of care?
This facility100/100
Ohio average89/100
Scores represent percent of positive resident responses for each item, excluding "don't know" and "not applicable" responses and instances where the question was skipped.
Based on the RCF Resident Satisfaction Survey 2022-23, Final Results
Do the people who work here do things the way you want them done?
This facility93/100
Ohio average88/100
Do the people who work here check on you often enough to see if you need anything?
This facility94/100
Ohio average81/100
Do you feel confident the people who work here would come quickly anytime you needed help?
This facility100/100
Ohio average85/100
Do the people who work here make sure you are comfortable when they provide care or services?
This facility100/100
Ohio average95/100
Do the people who work here do everything they can to protect you from getting sick?
This facility100/100
Ohio average94/100
Do the people who work here support you to do as much for yourself as you are able to do?
This facility100/100
Ohio average96/100
Do the people who work here ever get angry at you?
This facility100/100
Ohio average88/100
Are the people who work here knowledgeable about your medical conditions and treatments?
This facility100/100
Ohio average90/100
Do the people who care for you explain your care and services to you?
This facility100/100
Ohio average85/100
Do the same people take care of you most of the time?
This facility100/100
Ohio average84/100
Do you have opportunities to maintain your health and wellness, if you want?
This facility100/100
Ohio average92/100
Scores represent percent of positive resident responses for each item, excluding "don't know" and "not applicable" responses and instances where the question was skipped.
Based on the RCF Resident Satisfaction Survey 2022-23, Final Results
Are you as connected to the community as you want to be?
This facility35/100
Ohio average71/100
Are there enjoyable things to do on the weekends, if you want?
This facility76/100
Ohio average63/100
Do you usually enjoy how you spend your time?
This facility88/100
Ohio average87/100
Do you have something to look forward to most days?
This facility88/100
Ohio average77/100
Do you like the activities here?
This facility94/100
Ohio average83/100
Do you feel included in life here?
This facility94/100
Ohio average89/100
Do you have plenty of opportunities to do things that are meaningful to you?
This facility94/100
Ohio average83/100
Do you have enough opportunities to go on outings and special events?
This facility94/100
Ohio average73/100
Are you able to do the activities offered here, if you want?
This facility100/100
Ohio average93/100
Scores represent percent of positive resident responses for each item, excluding "don't know" and "not applicable" responses and instances where the question was skipped.
Based on the RCF Resident Satisfaction Survey 2022-23, Final Results
Does the menu change often enough?
This facility88/100
Ohio average77/100
Do you like the food here?
This facility93/100
Ohio average81/100
Do you get enough fresh food options here?
This facility94/100
Ohio average81/100
Do you have input on the food that is served?
This facility94/100
Ohio average68/100
Do you get enough to eat here?
This facility94/100
Ohio average95/100
Do you look forward to mealtimes?
This facility94/100
Ohio average80/100
Scores represent percent of positive resident responses for each item, excluding "don't know" and "not applicable" responses and instances where the question was skipped.
Ohio average 6.7
Last Health inspection on Jul 2025
Ohio average 30.9
Ohio average 4.59
Health citations are formal notices following inspections when they fail to comply with safety and care standards.
12 of 20 citations resulted from standard inspections; and 8 of 20 resulted from complaint investigations.
Ohio average: 0.3
Ohio average: 0.9
Reporting period: October 1 – December 31, 2025 (Q4 2025). Source: CMS Payroll-Based Journal report.
Manages medical care and health needs.
Assists with medical care and medications.
Helps with daily care and mobility.
Total hours from contractors
3,224 contractor hours this quarter
| Certified Nursing Assistant | 103 | 0 | 103 | 29,149 | 92 | 100% | 7.3 |
| Licensed Practical Nurse | 38 | 0 | 38 | 12,896 | 92 | 100% | 7.9 |
| RN Director of Nursing | 11 | 0 | 11 | 3,689 | 92 | 100% | 6.9 |
| Registered Nurse | 12 | 0 | 12 | 3,641 | 92 | 100% | 7 |
| Other Dietary Services Staff | 9 | 0 | 9 | 3,122 | 92 | 100% | 7.5 |
| Clinical Nurse Specialist | 6 | 0 | 6 | 1,174 | 80 | 87% | 5.5 |
| Physical Therapy Aide | 0 | 5 | 5 | 891 | 52 | 57% | 7 |
| Dental Services Staff | 2 | 0 | 2 | 803 | 62 | 67% | 7.9 |
| Speech Language Pathologist | 0 | 3 | 3 | 742 | 44 | 48% | 6.4 |
| Respiratory Therapy Technician | 0 | 2 | 2 | 556 | 59 | 64% | 6.9 |
| Qualified Social Worker | 0 | 3 | 3 | 518 | 50 | 54% | 6.2 |
| Physical Therapy Assistant | 0 | 2 | 2 | 491 | 48 | 52% | 7.3 |
| Occupational Therapy Aide | 1 | 0 | 1 | 475 | 58 | 63% | 8.2 |
| Administrator | 1 | 0 | 1 | 472 | 59 | 64% | 8 |
| Mental Health Service Worker | 1 | 0 | 1 | 472 | 59 | 64% | 8 |
| Dietitian | 1 | 0 | 1 | 456 | 57 | 62% | 8 |
| Nurse Practitioner | 1 | 0 | 1 | 343 | 57 | 62% | 6 |
| Medical Director | 0 | 1 | 1 | 27 | 3 | 3% | 9 |
Federal penalties imposed by CMS for regulatory violations, including civil money penalties (fines) and denials of payment for new Medicare/Medicaid admissions.
Source: CMS Penalties Database
No penalties in the past 3 years
No civil money penalties or payment denials were reported in the last 3 years.
These measures show how residents usually do over time at this home, based on health outcomes and preventive care.
Ohio average: 5.8
Ohio average: 12.7
Ohio average: 6.8%
Ohio average: 8.9%
Ohio average: 22.0%
Ohio average: 3.4%
Ohio average: 3.9%
Ohio average: 0.5%
Ohio average: 6.2%
Ohio average: 24.0%
Ohio average: 8.4%
Ohio average: 92.4%
Ohio average: 94.5%
Ohio average: 78.0%
Ohio average: 1.3%
Ohio average: 75.6%
Quality measures are calculated from Minimum Data Set (MDS) assessments. For most measures, lower percentages indicate better care quality.
39% of new residents, usually for short-term rehab.
55% of new residents, often for short stays.
6% of new residents, often for long-term daily care.
Source: CMS Long-Term Care Facility Characteristics (Data as of Jan 2026)
Residents meet regularly to discuss policies, care quality, and activities
Part of a Continuing Care Retirement Community offering multiple care levels
Organized group of residents that meets regularly to discuss facility policies, quality of life, and activities.
Data sourced from CMS Long-Term Care Facility Characteristics quarterly report. Payer mix reflects the current resident census by primary payment source.
Historical financial and operational data for Mount Alverna Village from 2012–2024, based on CMS SNF Cost Reports.
Key figures below are for fiscal year ending in 06/2024.
Based on CMS SNF Cost Report for fiscal year ending in 06/2024.
This home supports both short-term rehab and long-term care, with residents staying for a wide range of durations.
Most new residents arrive under private pay (55% of admissions), and a typical private pay stay runs around 7 - 8 months.
Coverage residents most often arrive under.
Coverage residents most often leave under.

What do you like most about living here?
She doesn't live here. She was in the nursing home for physical rehab.
Are there enough caregivers to handle the residents' needs, especially during emergencies?
No
Are the common areas pleasant and comfortable for socializing or relaxing?
Yes
How do you feel about the level of social interaction available with other residents?
N/A
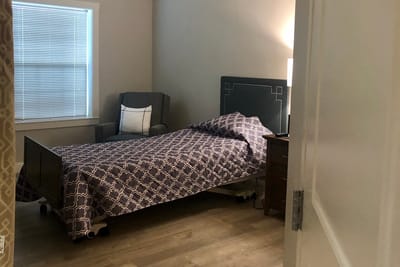
How was the units offered in this community?
Very clean.
Do you feel safe living in this community?
No
How well do you think the community handles emergencies or unexpected events?
Not sure.
How would you rate the quality and variety of the meals? (1-5)
4
Are special diets handled well?
Yes
Is the dining schedule flexible enough to meet your preferences?
Yes
Are there any hidden fees or unexpected charges?
It is $35 extra a day for a private room for rehab patients.
Would you recommend this community to others looking for senior living options?
NO!
Is there anything you wish you knew before moving in?
![]() 1.8 miles from city center
1.8 miles from city center
![]() Estimated distance in miles from Parma's city center to Mount Alverna Village's address, calculated via Google Maps.
Estimated distance in miles from Parma's city center to Mount Alverna Village's address, calculated via Google Maps.
Add your location
Info below is compiled from CMS reports & the OH Dept. of Health, senior community websites & trusted data sources such as Walk Score & BBB.
Communities are listed from highest to lowest based on our ranking methodology.
| O‘Neill Healthcare Fairview Park | NH HOS SNF | Fairview Park | 118
Facility
118
OH AVG
75
Rank
#47 / 309 |
77.1%
Facility
77.1%
OH AVG
81.7
Rank
#103 / 138 | -6% | 3.20
Facility
3.20
OH AVG
3.54
Rank
#128 / 182 | -22% | -10% | $0
Facility
$0
OH AVG
$74.0k
Rank
#1 / 183 | 11
Facility
11
OH AVG
30.9
Rank
#26 / 183 | 1.8
Facility
1.8
OH AVG
4.6
Rank
#8 / 183 | - | 91 | A+ |
66
Facility
66
OH AVG
40
Rank
#94 / 704 | Jenna Elliott | $11.7MFiscal year ending 12/2023
Facility
$11.7MFiscal year ending 12/2023
OH AVG
$10.1M
Rank
#50 / 183 | $5.3MFiscal year ending 12/2023
Facility
$5.3MFiscal year ending 12/2023
OH AVG
$3.9M
Rank
#95 / 183 | 45%Fiscal year ending 12/2023
Facility
45%Fiscal year ending 12/2023
OH AVG
40.2%
Rank
#175 / 183 | 366428 | ||||
| Algart Health Care | NH AL HOS MC RC SNF | Cleveland (Edgewater) | 36
Facility
36
OH AVG
75
Rank
#258 / 309 | - | - | 4.17
Facility
4.17
OH AVG
3.54
Rank
#29 / 182 | -44% | +18% | $0
Facility
$0
OH AVG
$74.0k
Rank
#1 / 183 | 11
Facility
11
OH AVG
30.9
Rank
#26 / 183 | 5.5
Facility
5.5
OH AVG
4.6
Rank
#143 / 183 | - | 71 | - |
62
Facility
62
OH AVG
40
Rank
#136 / 704 | Garth Ireland | $7.0MFiscal year ending 12/2023
Facility
$7.0MFiscal year ending 12/2023
OH AVG
$10.1M
Rank
#94 / 183 | $3.1MFiscal year ending 12/2023
Facility
$3.1MFiscal year ending 12/2023
OH AVG
$3.9M
Rank
#150 / 183 | 44.1%Fiscal year ending 12/2023
Facility
44.1%Fiscal year ending 12/2023
OH AVG
40.2%
Rank
#180 / 183 | 366308 | ||||
| Judson Park | NH AL HOS IL MC SNF | Cleveland (University Circle) | 36
Facility
36
OH AVG
75
Rank
#258 / 309 |
79.7%
Facility
79.7%
OH AVG
81.7
Rank
#97 / 138 | -2% | 6.53
Facility
6.53
OH AVG
3.54
Rank
#2 / 182 | -64% | +84% | $25.8k
Facility
$25.8k
OH AVG
$74.0k
Rank
#150 / 183 | 10
Facility
10
OH AVG
30.9
Rank
#23 / 183 | 2.5
Facility
2.5
OH AVG
4.6
Rank
#23 / 183 | 2 | 29 | - |
65
Facility
65
OH AVG
40
Rank
#107 / 704 | Judson | $22.8MFiscal year ending 12/2023
Facility
$22.8MFiscal year ending 12/2023
OH AVG
$10.1M
Rank
#5 / 183 | $13.9MFiscal year ending 12/2023
Facility
$13.9MFiscal year ending 12/2023
OH AVG
$3.9M
Rank
#4 / 183 | 60.7%Fiscal year ending 12/2023
Facility
60.7%Fiscal year ending 12/2023
OH AVG
40.2%
Rank
#135 / 183 | 365870 | ||||
| Mount Alverna Village | NH AL IL MC RC SNF | Parma | 153
Facility
153
OH AVG
75
Rank
#11 / 309 |
92.1%
Facility
92.1%
OH AVG
81.7
Rank
#32 / 138 | +13% | 4.22
Facility
4.22
OH AVG
3.54
Rank
#29 / 182 | -36% | +19% | $0
Facility
$0
OH AVG
$74.0k
Rank
#1 / 183 | 20
Facility
20
OH AVG
30.9
Rank
#56 / 183 | 2.5
Facility
2.5
OH AVG
4.6
Rank
#23 / 183 | - | 141 | - |
16
Facility
16
OH AVG
40
Rank
#574 / 704 | Annette Shoemaker | $25.0MFiscal year ending 06/2024
Facility
$25.0MFiscal year ending 06/2024
OH AVG
$10.1M
Rank
#1 / 183 | $14.7MFiscal year ending 06/2024
Facility
$14.7MFiscal year ending 06/2024
OH AVG
$3.9M
Rank
#2 / 183 | 58.7%Fiscal year ending 06/2024
Facility
58.7%Fiscal year ending 06/2024
OH AVG
40.2%
Rank
#182 / 183 | 366071 | ||||
| Mcgregor at Overlook | NH AL HOS IL RC SNF | East Cleveland | 148
Facility
148
OH AVG
75
Rank
#17 / 309 |
92.8%
Facility
92.8%
OH AVG
81.7
Rank
#25 / 138 | +14% | 4.17
Facility
4.17
OH AVG
3.54
Rank
#29 / 182 | -75% | +18% | $15.7k
Facility
$15.7k
OH AVG
$74.0k
Rank
#144 / 183 | 15
Facility
15
OH AVG
30.9
Rank
#42 / 183 | 3.0
Facility
3.0
OH AVG
4.6
Rank
#40 / 183 | 1 | 137 | - |
52
Facility
52
OH AVG
40
Rank
#228 / 704 | Susan Althans | $15.7MFiscal year ending 04/2024
Facility
$15.7MFiscal year ending 04/2024
OH AVG
$10.1M
Rank
#2 / 183 | $12.0MFiscal year ending 04/2024
Facility
$12.0MFiscal year ending 04/2024
OH AVG
$3.9M
Rank
#5 / 183 | 76.3%Fiscal year ending 04/2024
Facility
76.3%Fiscal year ending 04/2024
OH AVG
40.2%
Rank
#181 / 183 | 366350 |
Mount Alverna Village is located in Parma, Ohio.
Here are the financial assistance programs available to residents in Ohio.
Cathryn Kader is the Director of Nursing at Mount Alverna Village.
Mount Alverna Village has a walk score of 16. Car-dependent. Most errands require a car, with limited nearby walkable options.
Mount Alverna Village's occupancy is 92.6%.
Yes — see the floorplan options available at Mount Alverna Village on this page.
No, Mount Alverna Village has a no-pet policy.
The team at Mount Alverna Village can be reached at PWELSH@FRANCISCANCOMMUNITIES.COM.
Mount Alverna Village is registered as a non-profit in OH.
Care Cost Calculator: See Prices in Your Area
Nursing Home Data Explorer
Don’t Wait Too Long: 7 Red Flag Signs Your Parent Needs Assisted Living Now
The True Cost of Assisted Living in 2025 – And How Families Are Paying For It
Understanding Senior Living Costs: Pricing Models, Discounts & Financial Assistance


