Explore Open Rooms

1 Contact details
2 What type of senior care service are you looking for?
3 What budget do you have in mind for senior care?
4 How soon do you need to find care?
5 Additional details

Thank you for your interest!

Our team will be in touch shortly to help with next steps.

Nursing Home

Mount Washington Care Center

Nursing Home

Mount Washington Care Center

6900 Beechmont Ave, Cincinnati, OH 45230 View map
Overview of Mount Washington Care Center

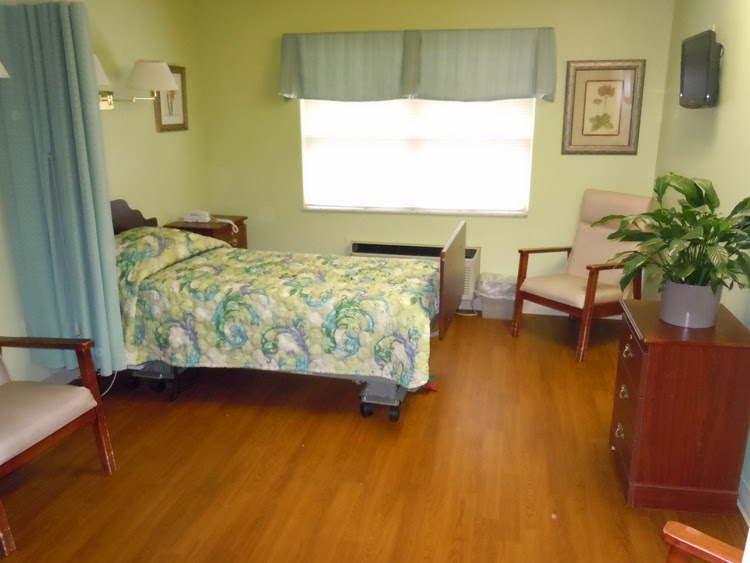
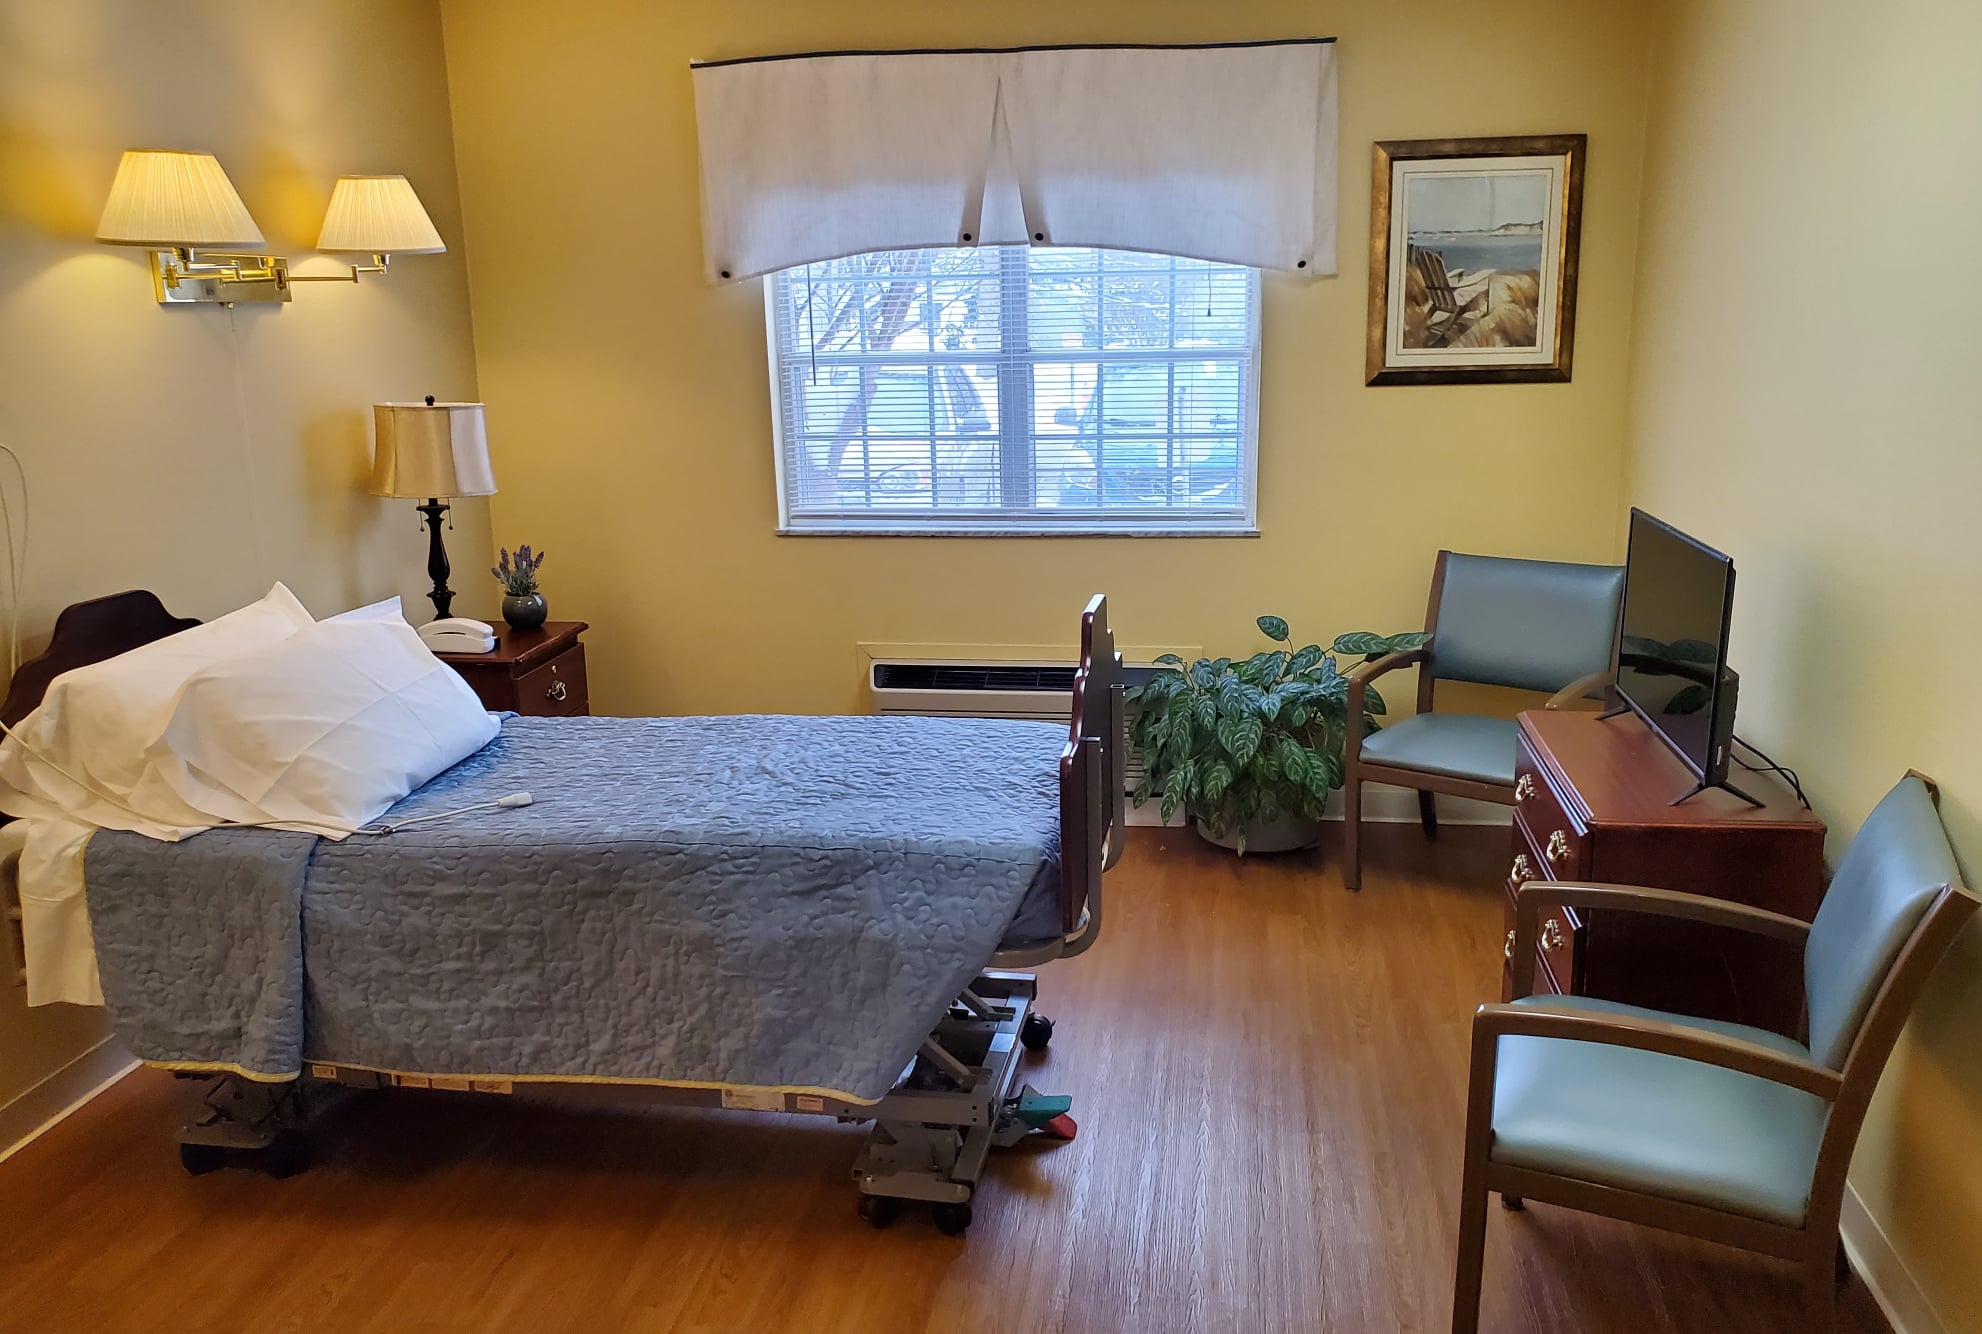
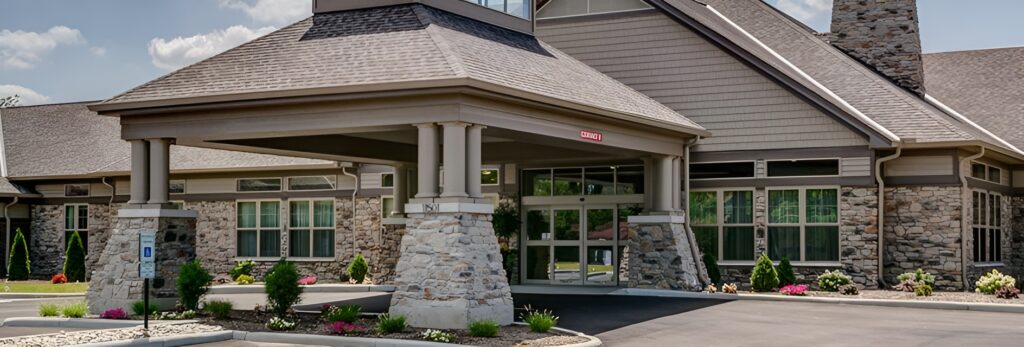
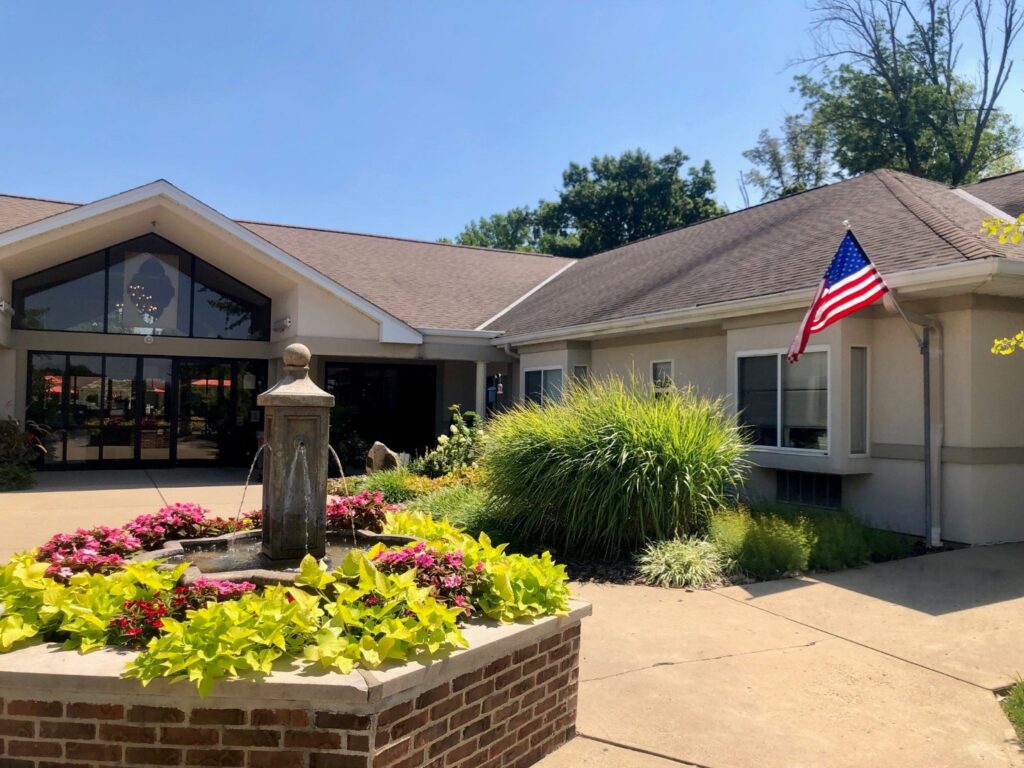
Tucked away in Cincinnati, OH, Mount Washington Care Center provides a cozy and welcoming environment for those seeking skilled nursing care and rehabilitation services. Their team is committed to serving residents’ care needs with dignity while respecting their care goals and preferences in creating their individualized care plans. To ensure residents are given well-rounded care for their varying needs, they feature an interdisciplinary team of care professionals, including RN, physicians, and therapists.

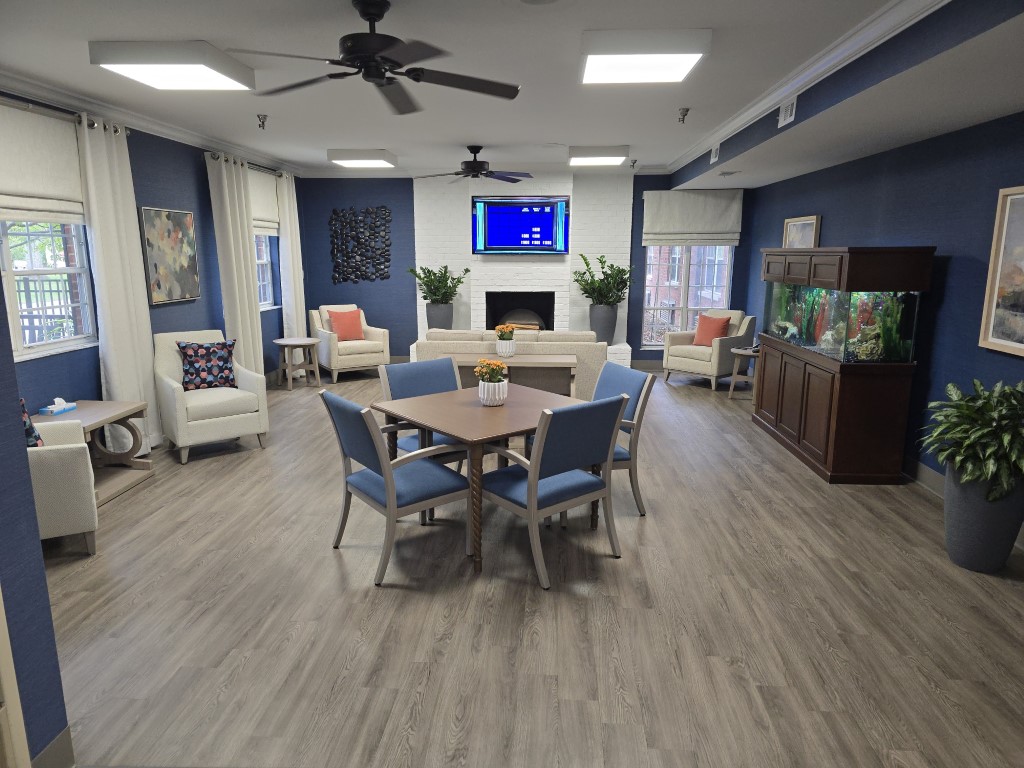
Their dedicated activity director curates an array of activities and social opportunities to help residents maintain an active and well-connected lifestyle. A team of dieticians is also available to monitor residents’ nutritional needs and ensure they enjoy healthy yet delicious meals. At Mount Washington Care Center, they continuously strive to offer residents a nurturing environment where they can enjoy both quality care and fun experiences.

(513) 231-4561

Quality ratings

Measured by Centers for Medicare & Medicaid Services (CMS)

Overall rating Info The Overall CMS Rating combines results from health inspections, staffing levels and quality measures. Health inspections carry the most weight. Staffing and quality scores can increase or decrease the final rating based on performance compared to state and national standards.
3/5
Ohio average: 3.4/5
Health Inspection Info Based on the results of the facility's three most recent standard inspections and any complaint investigations. CMS reviews the number, scope, and severity of deficiencies, with more recent findings weighted more heavily.
2/5
Ohio average: 2.9/5
Staffing Info Measures average nursing staff hours per resident per day, including Registered Nurses (RNs) and total nursing staff. Ratings are adjusted based on the level of care residents require and are compared to state and national benchmarks.
2/5
Ohio average: 2.9/5
Quality Measures Info Based on clinical and physical health indicators reported to CMS, such as hospital readmissions, falls, pressure ulcers, and improvements in mobility. These measures reflect how well residents' health needs are being managed.
5/5
Ohio average: 4.4/5

Nursing care per resident

Info This shows how many total hours of nursing staff time are available per resident each day. Higher numbers usually mean more staff support.
3h 15m per day

This home provides 15% less nursing time per resident than the Ohio average.

Ohio average: 3h 50m per day

Staffing hours breakdown

Info Hours of care per resident per day, broken down by staff type. Data from CMS Medicare.
Staff type Facility State avg National avg
Registered Nurse (RN) Info Registered nurse hours per resident per day. 48m per day 38m per day 41m per day
Nurse Aide Info Nurse aide hours per resident per day. 2h 6m per day 2h 8m per day 2h 21m per day
Total Nursing (Weekend) Info Total number of nurse staff hours per resident per day on weekends. 3h 57m per day 3h 17m per day 3h 26m per day
Physical Therapist Info Physical therapist staff hours per resident per day. 2m per day 3m per day 4m per day
RN (Weekend) Info Registered nurse hours per resident per day on weekends. 46m per day 25m per day 29m per day

Capacity and availability

Medium-capacity home

Offers a balance of services and community atmosphere.

Total beds 129

This home usually has availability

Lower occupancy suggests more openings may be available.

Lower demand than the Ohio average
Occupancy rate 64.7%
Residents per day (avg) 78
Occupancy rate
64.7%
Residents per day (avg)
78

Who this home usually serves

TYPE OF STAY

Primarily long-term care, limited rehab

Most residents stay long-term, while a smaller portion are admitted for short-term rehab.

Might be optimal for
Long-term residence Daily assistance Occasional rehab needs

Breakdown by payment type

Medicare

8% of new residents, usually for short-term rehab.

Typical stay 22 days

Private pay

75% of new residents, often for short stays.

Typical stay 4 - 5 months

Medicaid

17% of new residents, often for long-term daily care.

Typical stay 2 months

Finances and operations

Privately-owned community
Operated by a business corporation.
Home revenue
$11.8M
Operating loss
-$3.1M
Privately-owned community Operated by a business corporation.
Home revenue
$11,806,714.00
Operating loss
$-3,118,343.00
Payroll costs Info The portion of the home's budget spent on staff, including nurses, caregivers, and other employees who support care and operations.
$5.2M
44.1% of revenue
Other operating costs Info All remaining costs needed to run the home, such as food, utilities, building maintenance, supplies and administrative expenses.
$9.7M
Total costs $14.9M
Years in operation
47 years in operation
A longer operating history, which may indicate experience navigating regulations and delivering ongoing care.
Walk Score
Walk Score: 32 / 100
Somewhat walkable. A few nearby services may be reachable on foot, but most trips require transportation.
BBB Rating
BBB Rating: A+ (Accredited)
An independent rating from the Better Business Bureau based on factors such as complaint history, transparency, and business practices.
How BBB ratings work

Additional licensing details

CMS Certification Number: 365423

What does this home offer?

Accepts Medicaid icon

Accept Medicaid: Yes

Housing options icon

Housing Options: Private / Shared Rooms

Building type icon
Building type icon

Building Type: 2-story

Dining services icon

Dining Services

Housekeeping icon
Housekeeping icon

Housekeeping Services

Exercise program icon

Exercise Programs

Health Programs icon

Health Programs

Types of Care at Mount Washington Care Center

Nursing Home
Contact Mount Washington Care Center

Inspection History

In Ohio, the Department of Health, Bureau of Survey and Certification conducts unannounced onsite inspections to evaluate the quality of care and environment in all licensed facilities.

Health Inspection History

Inspections
Total health inspections 8

Ohio average 6.7


Last Health inspection on Aug 2025

Total health citations 39

Ohio average 30.9

Citations per inspection
4.88

Ohio average 4.59


Health citations are formal notices following inspections when they fail to comply with safety and care standards.

29 of 39 citations resulted from standard inspections; and 10 of 39 resulted from complaint investigations.

Breakdown of citation severity (last 3 years)
Critical Health citations More info 0
100% better than Ohio average

Ohio average: 0.3


Serious Health citations More info 1
11% worse than Ohio average

Ohio average: 0.9

0 critical citations More info Ohio average: 0.3

1 serious citation More info Ohio average: 0.9

36 moderate citations More info Ohio average: 29

2 minor citations More info Ohio average: 0.7
Citations history (last 3 years)
Quality of Care moderate citation Info Issues related to how well residents receive appropriate treatment and support for their medical and daily care needs. Aug 14, 2025
Corrected

Infection Control moderate citation Info Issues related to preventing and controlling infections, including hygiene practices and safety protocols. Mar 04, 2025
Corrected

Nutrition moderate citation Info Issues related to food quality, meal service, and resident's nutritional needs. Mar 04, 2025
Corrected

Pharmacy moderate citation Info Issues related to medication management, including how drugs are stored, administered, and monitored. Mar 04, 2025
Corrected

Compare Nursing Homes around Hamilton County The information below is reported by the Ohio Department of Health, Bureau of Survey and Certification.

5 facilities compared · CMS & OH Dept. of Health data · Updated Mar 2026

Beechwood Home
NH

Nursing Home Licensed facility providing 24/7 skilled nursing care for residents with complex, ongoing medical needs. Staffed by RNs, LPNs, and CNAs. Inspected and star-rated annually by CMS. Accepts Medicare (short-term rehab) and Medicaid (long-term care).

Cincinnati (Evanston)
80
94.5%
+20%
4.61
-34%
+30%
0
13
0
75
-
56
Baechtold, William
$8,8M
$5,6M
63.3%
365445
Private / Semi-Private Rooms
Sanctuary Pointe Nursing & Rehab Center
NH

Nursing Home Licensed facility providing 24/7 skilled nursing care for residents with complex, ongoing medical needs. Staffed by RNs, LPNs, and CNAs. Inspected and star-rated annually by CMS. Accepts Medicare (short-term rehab) and Medicaid (long-term care).

Cincinnati
124
87.0%
+11%
3.40
-53%
-4%
0
33
0
111
-
22
Chase M. Kohn Irrevocable Trust
$15,6M
$5,6M
35.7%
366432
Private / Semi-Private Rooms
Mount Washington Care Center
NH

Nursing Home Licensed facility providing 24/7 skilled nursing care for residents with complex, ongoing medical needs. Staffed by RNs, LPNs, and CNAs. Inspected and star-rated annually by CMS. Accepts Medicare (short-term rehab) and Medicaid (long-term care).

Cincinnati (Fruit Hill)
129
64.7%
-18%
3.25
+27%
-8%
0
39
1
78
A+
32
Edith Olanoff 2011 Trust Dated 10/21/2011
$11,8M
$5,2M
44.2%
365423
Private / Shared Rooms
CareCore at Meadows
NH

Nursing Home Licensed facility providing 24/7 skilled nursing care for residents with complex, ongoing medical needs. Staffed by RNs, LPNs, and CNAs. Inspected and star-rated annually by CMS. Accepts Medicare (short-term rehab) and Medicaid (long-term care).

Cincinnati
60
76.6%
-3%
2.86
-12%
-19%
1
61
2
82
-
44
-
$7,7M
$3,2M
40.9%
366175
Private / Semi-Private Rooms
Miami Haven Nursing Home
-
NH

Nursing Home Licensed facility providing 24/7 skilled nursing care for residents with complex, ongoing medical needs. Staffed by RNs, LPNs, and CNAs. Inspected and star-rated annually by CMS. Accepts Medicare (short-term rehab) and Medicaid (long-term care).

Cleves
-
-
-
-
-
-
-
-
-
0
0
0
-
-
16
-
-
-
-
-
Private / Shared Rooms

Places of interest near Mount Washington Care Center

Address 10.9 miles from city center
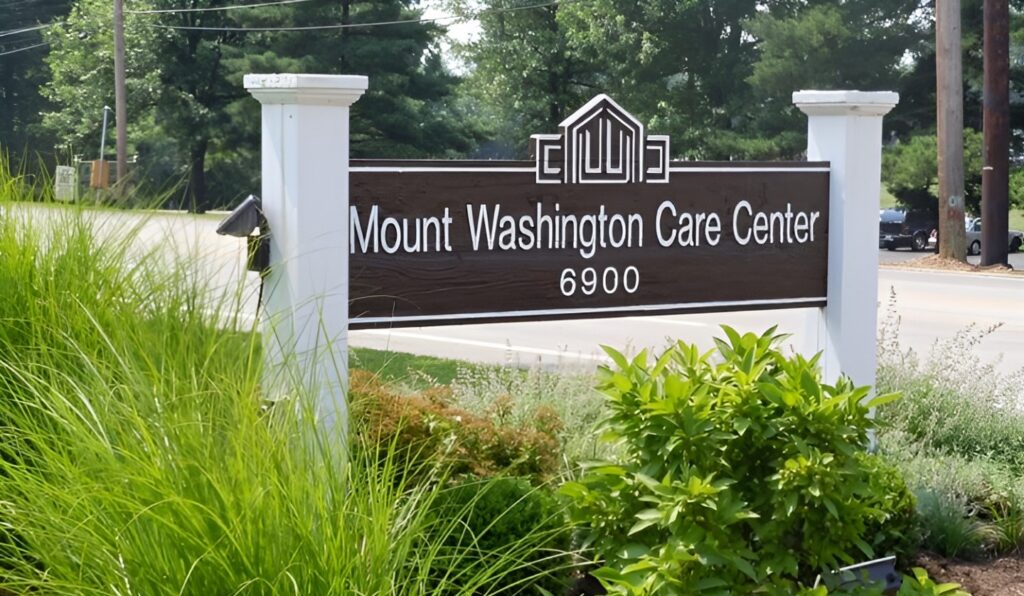
Address 6900 Beechmont Ave, Cincinnati, OH 45230

Calculate Travel Distance to Mount Washington Care Center

Add your location

Address

Staffing Data (Q2 2025)

This data corresponds to Q2 2025 and is based on CMS Payroll-Based Journal.

Total staff 163
Employees 113
Contractors 50
Staff to resident ratio 2.04:1
5% worse than Ohio average

Ohio average ratio: 2.14:1

Avg staff/day 43
Average shift 8.5 hours
5% better than Ohio average

Ohio average: 8.1 hours

Total staff hours (quarter) 33,426
Nursing staff breakdown
Registered Nurse

Manages medical care and health needs.

Total count 19
Average shift length Info Average shift length. Calculated as total hours divided by days worked and average staff per day. 9 hours

This role is partially covered by contractors.

Licensed Practical Nurse

Assists with medical care and medications.

Total count 42
Average shift length Info Average shift length. Calculated as total hours divided by days worked and average staff per day. 9.2 hours

This role is partially covered by contractors.

Certified Nursing Assistant

Helps with daily care and mobility.

Total count 77
Average shift length Info Average shift length. Calculated as total hours divided by days worked and average staff per day. 8.9 hours

This role is partially covered by contractors.

Contractor staffing

Total hours from contractors

8.7%

2,902 contractor hours this quarter

Certified Nursing Assistant: 23 Licensed Practical Nurse: 11 Physical Therapy Assistant: 3 Registered Nurse: 3 Respiratory Therapy Technician: 2 Speech Language Pathologist: 2 Qualified Social Worker: 1 Physical Therapy Aide: 1 Medical Director: 1 Occupational Therapy Aide: 1 Feeding Assistant: 1 Occupational Therapy Assistant: 1
Staff by category
Certified Nursing Assistant54237713,77491100%8.9
Licensed Practical Nurse3111428,91391100%9.2
Registered Nurse163193,71991100%9
Other Dietary Services Staff8082,73591100%7.7
Administrator1015206571%8
Mental Health Service Worker1014806470%7.5
Dental Services Staff1014806470%7.5
Speech Language Pathologist0224585864%7.9
Nurse Practitioner1014586167%7.5
Respiratory Therapy Technician0224246470%6.3
Physical Therapy Aide0114006470%6.2
Feeding Assistant0112814549%6.2
Physical Therapy Assistant0332795965%4.7
Qualified Social Worker0112454651%5.3
Occupational Therapy Aide0111812730%6.7
Medical Director011651314%5
Occupational Therapy Assistant0111689%2
77 Certified Nursing Assistant
% of Days 100%
42 Licensed Practical Nurse
% of Days 100%
19 Registered Nurse
% of Days 100%
8 Other Dietary Services Staff
% of Days 100%
1 Administrator
% of Days 71%
1 Mental Health Service Worker
% of Days 70%
1 Dental Services Staff
% of Days 70%
2 Speech Language Pathologist
% of Days 64%
1 Nurse Practitioner
% of Days 67%
2 Respiratory Therapy Technician
% of Days 70%
1 Physical Therapy Aide
% of Days 70%
1 Feeding Assistant
% of Days 49%
3 Physical Therapy Assistant
% of Days 65%
1 Qualified Social Worker
% of Days 51%
1 Occupational Therapy Aide
% of Days 30%
1 Medical Director
% of Days 14%
1 Occupational Therapy Assistant
% of Days 9%

Facility Characteristics

Source: CMS Long-Term Care Facility Characteristics (Data as of Jan 2026)

Total census
80 residents
Residents by payment source
Medicaid
43 residents (53.8%)
Private pay or other
37 residents (46.3%)
Programs & Services
Residents' Group

Residents meet regularly to discuss policies, care quality, and activities

Active Resident Council

Organized group of residents that meets regularly to discuss facility policies, quality of life, and activities.

Quality of care over time

These measures show how residents usually do over time at this home, based on health outcomes and preventive care.

High-risk clinical events score Info A composite score based on pressure ulcers, falls with injury, weight loss, walking ability decline, and activities of daily living decline. 4.2
28% better than Ohio average

Ohio average: 5.8

Functional decline score Info A composite score based on activities of daily living decline, walking ability decline, and incontinence. 9.1
28% better than Ohio average

Ohio average: 12.7

Long-stay resident measures
Significantly above average Ohio avg: 4.8 Info CMS star rating based on long-stay quality measure performance. 5 stars = significantly above average, 1 star = significantly below average.
Need for Help with Daily Activities Increased Info Percent of long-stay residents whose need for help with daily activities has increased 6.8%
In line with Ohio average

Ohio average: 6.8%

Walking Ability Worsened Info Percent of long-stay residents whose ability to move independently worsened 1.2%
86% better than Ohio average

Ohio average: 8.9%

Low Risk Residents with Bowel/Bladder Incontinence Info Percent of low risk long-stay residents who lose control of their bowels or bladder 19.3%
12% better than Ohio average

Ohio average: 22.0%

Falls with Major Injury Info Percent of long-stay residents experiencing one or more falls with major injury 5.2%
53% worse than Ohio average

Ohio average: 3.4%

High Risk Residents with Pressure Ulcers Info Percent of long-stay high risk residents with pressure ulcers 3.6%
8% better than Ohio average

Ohio average: 3.9%

Urinary Tract Infection Info Percent of long-stay residents with a urinary tract infection 1.1%
107% worse than Ohio average

Ohio average: 0.5%

Lost Too Much Weight Info Percent of long-stay residents who lose too much weight 4.0%
35% better than Ohio average

Ohio average: 6.2%

Depressive Symptoms Info Percent of long-stay residents who have depressive symptoms 14.6%
39% better than Ohio average

Ohio average: 24.0%

Antipsychotic Use Info Percent of long-stay residents who received an antipsychotic medication 3.6%
57% better than Ohio average

Ohio average: 8.4%

Pneumococcal Vaccine Info Percent of long-stay residents assessed and appropriately given the pneumococcal vaccine 96.3%
In line with Ohio average

Ohio average: 92.4%

Influenza Vaccine Info Percent of long-stay residents assessed and appropriately given the seasonal influenza vaccine 91.8%
In line with Ohio average

Ohio average: 94.5%

Hospitalizations per 1,000 days Info Number of hospitalizations per 1,000 long-stay resident days. 2.15
21% worse than Ohio average

Ohio average: 1.77

ED visits per 1,000 days Info Number of outpatient emergency department visits per 1,000 long-stay resident days. 0.84
54% better than Ohio average

Ohio average: 1.83

Short-stay resident measures
Significantly above average Ohio avg: 1.9 Info CMS star rating based on short-stay quality measure performance. 5 stars = much above average, 1 star = much below average.
Pneumococcal Vaccine Info Percent of short-stay residents assessed and appropriately given the pneumococcal vaccine 60.7%
22% worse than Ohio average

Ohio average: 78.0%

Antipsychotic medication increase Info Percent of short-stay residents who newly received an antipsychotic medication 1.4%
10% worse than Ohio average

Ohio average: 1.3%

Influenza Vaccine Info Percent of short-stay residents assessed and appropriately given the seasonal influenza vaccine 52.6%
30% worse than Ohio average

Ohio average: 75.6%

Re-hospitalized after SNF stay Info Percentage of short-stay residents who were re-hospitalized after their nursing home admission. 11.7%
53% better than Ohio average

Ohio average: 25.1%

Emergency department visits Info Percentage of short-stay residents who had an outpatient emergency department visit. 3.6%
71% better than Ohio average

Ohio average: 12.5%

Falls with major injury Info Percentage of SNF residents who experience falls with major injury during their stay. 0.0%
100% better than Ohio average

Ohio average: 0.8%

Successful return to home or community Info Rate of successful return to home or community from a skilled nursing facility. 57.9%
14% better than Ohio average

Ohio average: 50.6%

Guides for Better Senior Living

Care Cost Calculator: See Prices in Your Area

Nursing Home Data Explorer

Don’t Wait Too Long: 7 Red Flag Signs Your Parent Needs Assisted Living Now

The True Cost of Assisted Living in 2025 – And How Families Are Paying For It

Understanding Senior Living Costs: Pricing Models, Discounts & Financial Assistance

Financial Aid for Ohio Seniors

Get financial aid guidance

PASSPORT Waiver

Ohio Medicaid PASSPORT

Age 60+, Ohio resident, Medicaid-eligible, nursing home-level care need.

~$2,829/month (300% FBR, individual).

$2,000 (individual), $3,000 (couple).

Administered through regional agencies; waitlists possible.

Ohio Home Care Program (non-Medicaid)

OH HCP

Age 60+, Ohio resident, at risk of decline.

~$2,000/month (individual, varies).

$5,000 (individual).

Limited funding; regional variation.

Assisted Living Waiver (ALW)

Ohio Assisted Living Waiver

Age 21+ (65+ prioritized), OH resident, Medicaid-eligible, NFLOC.

~$2,829/month (individual); QIT required.

$2,000 (individual), $3,000 (couple).

Covers ~300 facilities; room/board not included (separate cost).

Program of All-Inclusive Care for the Elderly (PACE)

Ohio PACE (e.g., McGregor PACE)

Age 55+, OH resident (specific counties), NFLOC, safe with PACE support.

~$2,829/month (Medicaid-eligible); private pay option available.

$2,000 (individual), $3,000 (couple) for Medicaid enrollees.

Available in 9 counties (e.g., Cuyahoga, Franklin); expanding via Healthy Aging Grants.

Medicare Savings Program (MSP)

Ohio Medicare Savings Program

Age 65+ or disabled, OH resident, Medicare Part A/B.

~$2,510/month (QMB), ~$3,380/month (SLMB), ~$3,598/month (QI)—individual.

$9,430 (individual), $14,130 (couple).

Three tiers; includes Extra Help for Part D; no waitlist.

Home Energy Assistance Program (HEAP)

Ohio HEAP

Age 60+ prioritized, OH resident, low-income household.

~$3,970/month (individual, 185% FPL).

Not assessed; income-focused.

Covers gas, electric, oil; emergency aid via Winter/Summer Crisis Programs.

Family Caregiver Support Program (FCSP)

Ohio Family Caregiver Support Program

Caregivers of 60+ needing care or 55+ caregivers of others; OH resident; functional needs (2+ ADLs).

Prioritizes ~$24,980/year (individual); no strict cap.

Not assessed; need-based.

12 AAAs; rural/low-income priority; volunteer respite option.

Senior Community Service Employment Program (SCSEP)

Ohio SCSEP

Age 55+, unemployed, low-income, OH resident.

~$1,983/month (125% FPL).

Not specified; income-focused.

Priority for veterans, rural residents; AARP partnership.

VA Aid and Attendance (A&A) and Housebound Benefits

Ohio VA Aid and Attendance/Housebound

Age 65+ or disabled veteran/spouse, OH resident, wartime service, need for ADL help (A&A) or homebound.

Net income < ~$1,984/month (veteran with dependent, A&A); pension offsets income.

~$155,356 (net worth limit).

High veteran demand; supports care in multiple settings.

Homestead Exemption

Ohio Homestead Exemption

Age 65+ (or disabled), OH resident, homeowner, low-income.

~$38,500/year (individual, adjusted annually).

Not assessed; home ownership required.

Reduces taxable value by $25,000; applies to primary residence.

Save the Dream Ohio (Homeowner Assistance Fund)

Ohio Save the Dream

Age 60+ prioritized, OH resident, homeowner, hardship post-Jan 21, 2020.

~$147,600/year (family of 4, 150% AMI; varies by county).

Not assessed; hardship-focused.

Covers delinquent mortgages, utilities, taxes; max $25,000 mortgage aid.

Tour Icon
Planning a tour? Check our touring checklist.
Chat Icon
Thinking of living here? We can help you speak to a current resident