Mt. Baker Care Center

Nursing Home in Bellingham

CMS overall rating Info The Overall CMS Rating combines results from health inspections, staffing levels and quality measures. Health inspections carry the most weight. Staffing and quality scores can increase or decrease the final rating based on performance compared to state and national standards.

Overview of Mt. Baker Care Center

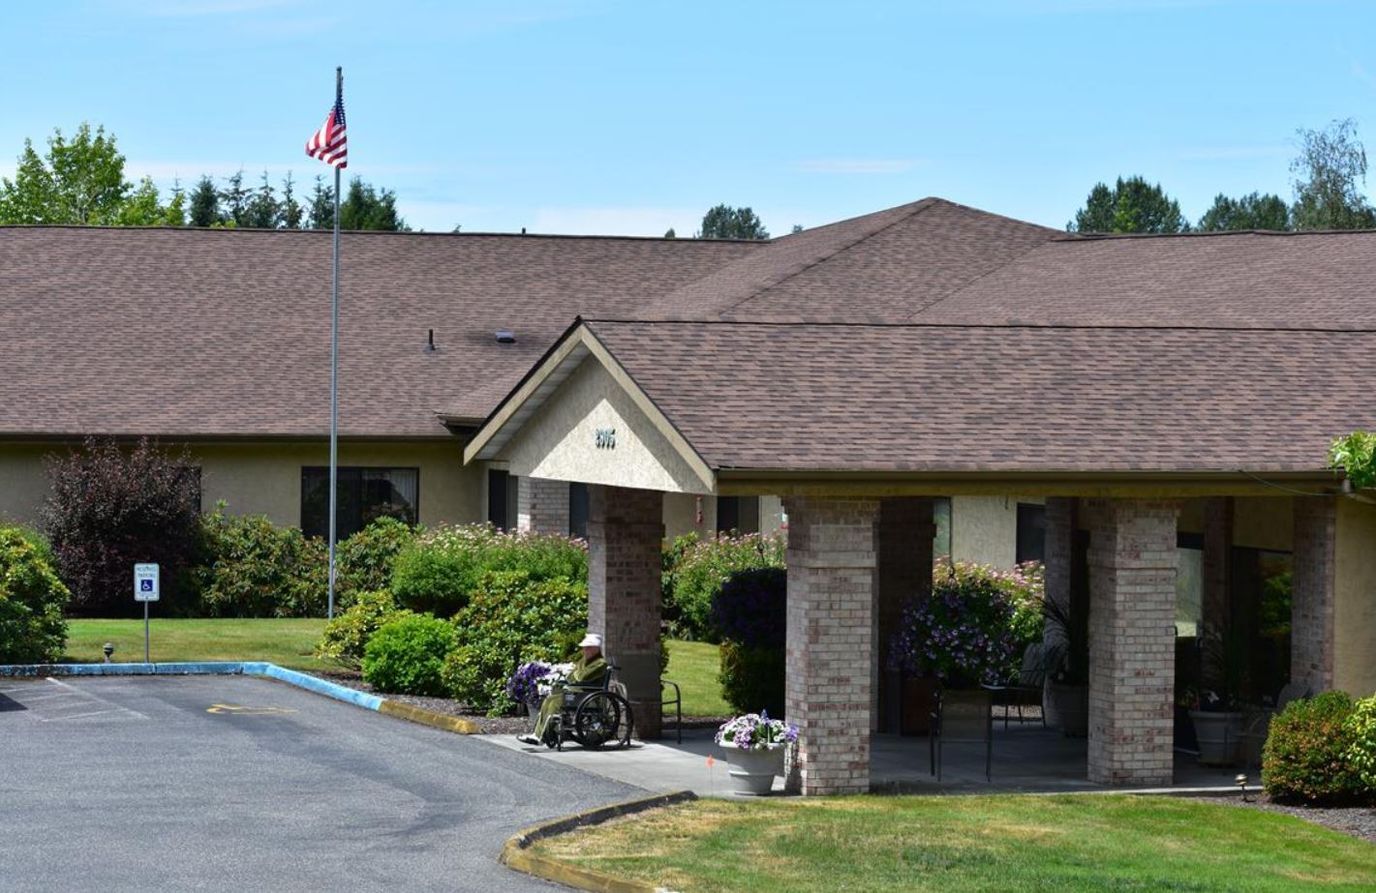
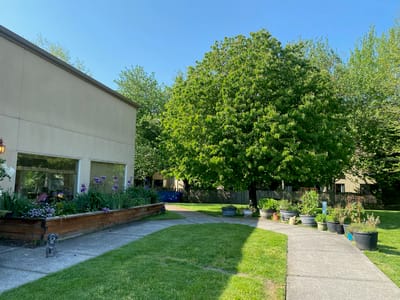
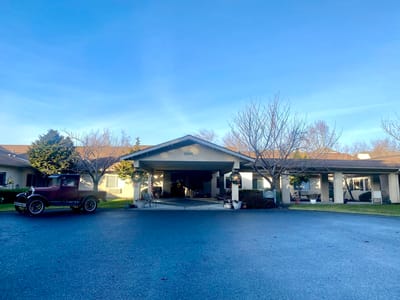
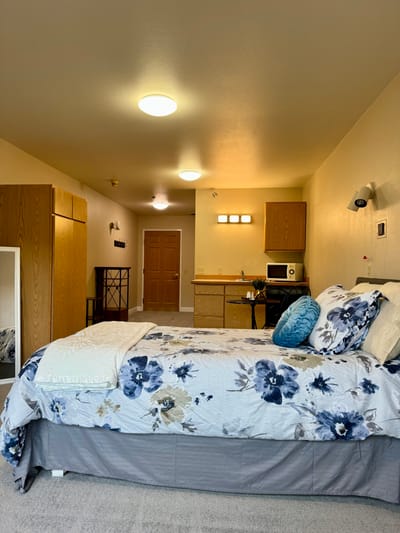
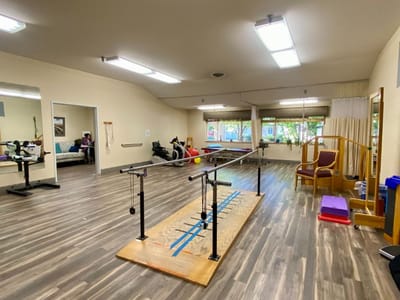
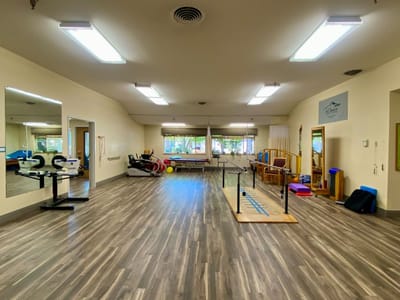
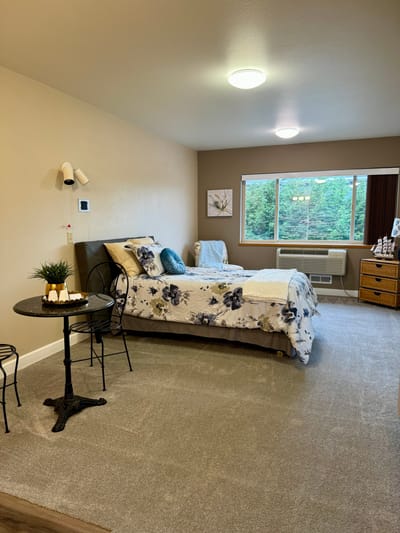
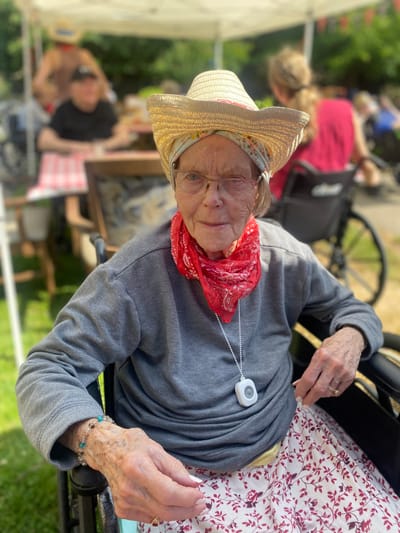
Mt. Baker Care Center is a remarkable senior living community set in the scenic grounds of Bellingham, WA, offering skilled nursing care, palliative care, and rehabilitation therapy. Experience a wonderful retirement within the cozy and elegant residences of the community. With a dedicated and well-trained team caring for residents’ special needs and aspirations, the community strives to deliver the highest quality of care and support for seniors to do what they love.

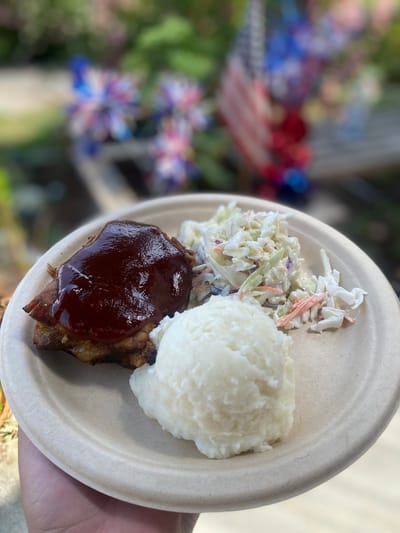
Delivering top-tier care since 1991, seniors can rest assured to enjoy their golden years at their finest. Moreover, the community fosters a vibrant and welcoming environment for seniors to feel a sense of belonging and thrive to reach their full potential. Eat well with nutritious and tasty meals catering to dietary needs and preferences. Mt. Baker Care Center doubles its efforts to provide seniors with a haven to find solace with its campus surrounded by scenic views and serene lands.

(360) 734-4181

Managed by Catherine Reis-El Bara

Administrator

25 years of experience

Catherine Reis-El Bara has been the Administrator at Mt. Baker Care Center since 2014, bringing 25 years of long-term care experience, including 18 years as a facility Administrator. She oversees all facility operations, compliance, staff management, and financial reporting, ensuring quality care for residents.

Quality ratings

Measured by Centers for Medicare & Medicaid Services (CMS)

Overall rating Info The Overall CMS Rating combines results from health inspections, staffing levels and quality measures. Health inspections carry the most weight. Staffing and quality scores can increase or decrease the final rating based on performance compared to state and national standards.
5/5 ▲ 1.5 Washington average: 3.5/5
Health Inspection Info Based on the results of the facility's three most recent standard inspections and any complaint investigations. CMS reviews the number, scope, and severity of deficiencies, with more recent findings weighted more heavily.
5/5 ▲ 2.1 Washington average: 2.9/5
Staffing Info Measures average nursing staff hours per resident per day, including Registered Nurses (RNs) and total nursing staff. Ratings are adjusted based on the level of care residents require and are compared to state and national benchmarks.
5/5 ▲ 1.2 Washington average: 3.9/5
Quality Measures Info Based on clinical and physical health indicators reported to CMS, such as hospital readmissions, falls, pressure ulcers, and improvements in mobility. These measures reflect how well residents' health needs are being managed.
4/5 ▼ 0.1 Washington average: 4.1/5

Staffing hours breakdown

Info Daily nursing hours per resident by staff type, reported to CMS. Higher is generally better — compare this facility to state and national averages to see where staffing stands.

Hours per resident per day — compared to Washington state averages

Total nursing care / resident Info This home is ranked 11th out of 66 homes in Washington.

Total adjusted nursing hours per resident per day, combining RN, LPN, and aide time. CMS adjusts this for case-mix so facilities can be fairly compared.
4h 39m per day
This facility Washington avg (4h 22m per day)
vs Washington avg
+7%

0 of 5 metrics below state avg

Standout metric Physical Therapist is +80% above state avg
Staff typeHours / dayvs state avg
Registered Nurse (RN) Info RNs hold the highest nursing license and can assess residents, interpret test results, and direct care plans. More RN hours per day often signals stronger clinical oversight and faster response to health changes. 1h 14m per day ▲ 40% State avg: 53m per day · National avg: 41m per day
Nurse Aide Info Certified Nurse Aides (CNAs) provide the most direct day-to-day assistance: bathing, dressing, feeding, and mobility. Nurse aide hours are typically the largest staffing category and directly affect residents' quality of life. 3h 14m per day ▲ 20% State avg: 2h 41m per day · National avg: 2h 21m per day
Total Nursing (Weekend) Info Combined nursing hours (RN + LPN + Nurse Aide) per resident per day on weekends. Staffing often drops on weekends — this figure reveals whether the facility maintains adequate coverage outside of weekday hours. 4h 34m per day ▲ 21% State avg: 3h 47m per day · National avg: 3h 26m per day
Physical Therapist Info Hours per resident per day provided by licensed Physical Therapists (PTs) or PT Assistants. PT services help residents recover mobility after injury or illness and are especially important for post-acute (short-stay) rehabilitation. 9m per day ▲ 80% State avg: 5m per day · National avg: 4m per day
RN (Weekend) Info Registered nurse hours specifically on weekends. Facilities sometimes reduce RN presence on Saturdays and Sundays — a low weekend RN figure compared to weekday hours can indicate reduced clinical oversight when most administrative staff are absent. 58m per day ▲ 53% State avg: 38m per day · National avg: 29m per day

Capacity and availability

Smaller home

May offer a more intimate, personalized care environment.

Total beds 47

This home usually has availability

Lower occupancy suggests more openings may be available.

Lower demand than the Washington average: 72.5%
Occupancy rate 80.6%
Avg. Length of Stay 92 days
Occupancy rate
80.6%
Avg. Length of Stay
92 days

Who this home usually serves

TYPE OF STAY

Mostly short-term rehab stays

Most residents typically stay for a few weeks or months before returning home or moving on.

Might be optimal for
Short stays Recovery Medicare-covered care

Breakdown by payment type

Medicare

57% of new residents, usually for short-term rehab.

Typical stay 1 - 2 months

Private pay

41% of new residents, often for short stays.

Typical stay 2 - 3 months

Medicaid

2% of new residents, often for long-term daily care.

Typical stay 5 - 6 years

Finances and operations

Privately-owned community
Home revenue
$14.5M
Profit
$2.0M
Privately-owned community
Home revenue
$14.5M
Profit
$2.0M
Payroll costs Info The portion of the home's budget spent on staff, including nurses, caregivers, and other employees who support care and operations.
$5.2M
36.2% of revenue
Other operating costs Info All remaining costs needed to run the home, such as food, utilities, building maintenance, supplies and administrative expenses.
$7.2M
Total costs $12.5M
Bed community size
47-bed community
A moderately sized community that may balance personal attention with shared amenities and social activities.
Walk Score
Walk Score: 44 / 100
Somewhat walkable. A few nearby services may be reachable on foot, but most trips require transportation.

About this community

License Details

Facility TypeBh
StatusOp
ExpirationSeptember 30, 2026
CountyWhatcom
License Number1606
CMS Certification Number505376
AwardsBest in Senior Living for both Assisted Living and Skilled Nursing in Whatcom County

Payment & Insurance

2 services
Accept Medicaid
Accept Medicare

Therapy & Rehabilitation

3 services
Rehabilitation Services
Respite Care
Short-Term Rehab

Staffing & Medical

2 services
Skilled Nursing
24-Hour Staffing

Amenities & Lifestyle

0 amenities
ActivitiesActivities range from group excursions and gardening activities to sing-a-longs and Sunday worship service.
Specific ProgramsSummit Place Assisted Living, Rehabilitation Therapy, Generations, Palliative Care, Enrichment Activities, Specialized Services, Dietary Services

Dining & Nutrition

Food DescriptionUsing the freshest ingredients and locally-grown produce, nearly all dishes that reach our residents are made from scratch by professionally trained staff.
Meals IncludedYes
Meal ScheduleMeals served at regularly scheduled times in the social dining room.
Special DietsYes

What does this home offer?

Housing options icon

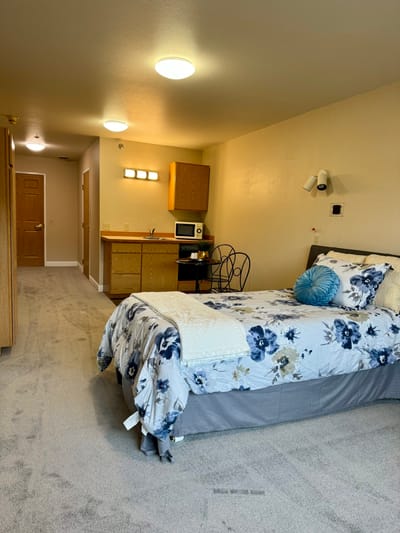
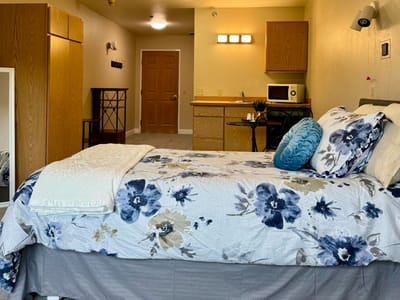
Housing Options: Private Rooms

Building type icon
Building type icon

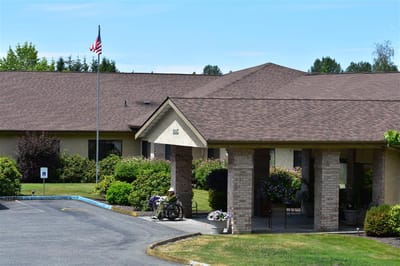
Building Type: Single-story

Fitness and recreation icon

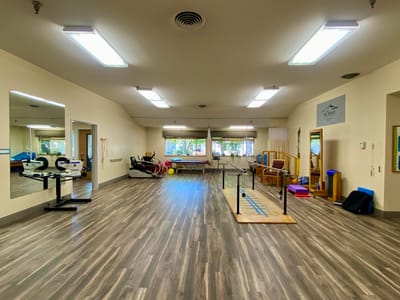
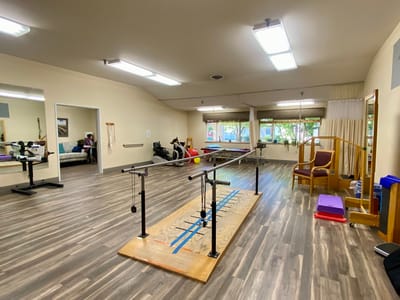
Fitness and Recreation

Types of Care at Mt. Baker Care Center

Nursing Home

Access & Eligibility

Ways to qualify for care at this community, including accepted programs and payment options.

Medicaid Accepted

This facility is certified for eligible Medicaid services.

Medicare Accepted

This facility is certified for eligible Medicare services.

Payment & Funding Options

Medicaid Medicare

Inspection History

In Washington, the Department of Social and Health Services, Residential Care Services conducts unannounced inspections and issues reports on the quality of care in all licensed settings.

7 visits/inspections Info Inspections are mandatory, regular evaluations conducted by state health departments or regulatory agencies. They ensure the community provides safe, compliant care, covering areas like resident health, staff and management.

Washington average: 8 complaint visits

Washington average: 9 inspections

Latest inspection

Date July 2, 2025
Routine

18 deficiencies

Deficiencies indicate regulatory issues. A higher number implies the facility had several areas requiring improvement.

Washington average: 31 deficiencies

Inspection Report Summary for Mt. Baker Care Center

The most recent inspection on July 2, 2025, identified deficiencies related to medication use, care planning, pressure ulcer prevention, monitoring of high-risk medications, and infection control practices. Earlier inspections showed a mixed pattern, with some surveys finding no deficiencies and others citing issues in resident care, medication management, and infection control. Deficiencies commonly involved incomplete care plans, medication errors, and lapses in infection prevention, with complaint investigations substantiating medication errors and oxygen therapy neglect. No fines, immediate jeopardy findings, or license actions were listed in the available reports. The inspection history shows ongoing challenges in clinical care areas, with no clear trend of consistent improvement or worsening over time.

Health Inspection History

Inspections
Total health inspections 5

Washington average 7.8


Last Health inspection on Jul 2025

Total health citations 18

Washington average 48.9

Citations per inspection
3.6

Washington average 6.92


Health citations are formal notices following inspections when they fail to comply with safety and care standards.

16 of 18 citations resulted from standard inspections; and 2 of 18 resulted from complaint investigations.

Breakdown of citation severity (last 3 years)
Critical Health citations More info 0
100% better than Washington average

Washington average: 0.3


Serious Health citations More info 0
100% better than Washington average

Washington average: 1.7

0 critical citations More info Washington average: 0.3

0 serious citations More info Washington average: 1.7

18 moderate citations More info Washington average: 46.3

0 minor citations More info Washington average: 0.5
Citations history (last 3 years)
Abuse/Neglect moderate citation Info Issues related to protecting resident's from harm, including abuse, neglect, or mistreatment. Jul 02, 2025
Corrected

Infection Control moderate citation Info Issues related to preventing and controlling infections, including hygiene practices and safety protocols. Jul 02, 2025
Corrected

Pharmacy moderate citation Info Issues related to medication management, including how drugs are stored, administered, and monitored. Jul 02, 2025
Corrected

Quality of Care moderate citation Info Issues related to how well residents receive appropriate treatment and support for their medical and daily care needs. Jul 02, 2025
Corrected

Compare Nursing Homes around Bellingham The information below is reported by the Washington Department of Social and Health Services, Residential Care Services.

1 facility compared · CMS & WA Dept. of Health data · Updated Apr 2026

Filter by care type
Mt. Baker Care Center
NH

Nursing Home Licensed facility providing 24/7 skilled nursing care for residents with complex, ongoing medical needs. Staffed by RNs, LPNs, and CNAs. Inspected and star-rated annually by CMS. Accepts Medicare (short-term rehab) and Medicaid (long-term care).

Bellingham (South Bellingham)70 80.6% +11%4.65 -10%+10%0183.6055- 44 Clay Management Group Llc$12.9M$5.2M40.6%505376

Financial Assistance for
Nursing Home in Washington

Get Financial aid guidance

Community Options Program Entry System (COPES)

WA Medicaid COPES

Age 65+ or disabled
General Washington resident, Medicaid-eligible, nursing home-level care need.
Income Limits (2025) ~$2,829/month 300% FBR, individual
Asset Limits $2,000 (individual), $3,000 (couple).
WA

High demand in urban areas (e.g., Seattle).

Benefits
Personal care (5-7 hours/day) Respite (240 hours/year) Adult day care ($70/day) Home modifications ($1,500 avg.)

Washington Family Caregiver Support Program

WA NFCSP

Age Caregiver of someone 60+ (or with dementia)
General Washington resident.
Income Limits No strict limit; prioritizes low-income.
Asset Limits Not applicable.
WA

High urban demand; rural outreach.

Benefits
In-home respite (4-6 hours/day) Adult day care (~$70/day) Short-term facility care (up to 5 days)

Community First Choice (CFC)

Washington Community First Choice

Age 65+ (or disabled 18+)
General WA resident, Medicaid-eligible, need help with 2+ ADLs/IADLs.
Income Limits (2025) ~$2,829/month; QIT optional.
Asset Limits $2,000 (individual), $3,000 (couple).
WA

Broader than COPES; serves ~20,000; self-directed option.

Benefits
Personal care (4-6 hours/day) Respite (~240 hours/year) Assistive devices Training Transportation

Older Americans Act (OAA) Services

Washington OAA Services

Age 60+
General WA resident; no income/asset limits.
Income Limits (2025) None; donations encouraged.
Asset Limits Not assessed.
WA

13 AAAs; includes Meals on Wheels; rural focus.

Benefits
Meals (~$5-$7/meal) Transportation Homemaker services (~4 hours/week) Respite (~5 days/year) Legal aid

Medicare Savings Program (MSP)

Washington Medicare Savings Program

Age 65+ or disabled
General WA resident, Medicare Part A/B.
Income Limits (2025) ~$2,510/month (QMB), ~$3,380/month (SLMB), ~$3,598/month (QI)—individual.
Asset Limits $9,430 (individual), $14,130 (couple).
WA

Includes Extra Help for Part D; no waitlist.

Benefits
Covers Part B premiums ($174.70/month) Deductibles ($240/year) Copays (~20%)

Low-Income Home Energy Assistance Program (LIHEAP)

Washington LIHEAP

Age 60+ prioritized
General WA resident, low-income household.
Income Limits (2025) ~$3,970/month 185% FPL
Asset Limits Not assessed.
WA

Covers gas, electric, wood; emergency aid available.

Benefits
Heating/cooling aid ($300-$1,000/season) Crisis aid ($500 max)

Senior Community Service Employment Program (SCSEP)

Washington SCSEP

Age 55+
General unemployed, low-income, WA resident.
Income Limits (2025) ~$1,983/month 125% FPL
Asset Limits Not specified.
WA

Priority for veterans, rural residents; AARP partnership.

Benefits
Paid training (~20 hours/week at ~$7.25/hour) Job placement

VA Aid and Attendance (A&A) and Housebound Benefits

Washington VA Aid and Attendance/Housebound

Age 65+ or disabled veteran/spouse
General WA resident, wartime service, ADL help (A&A) or homebound.
Income Limits (2025) Net income < ~$1,984/month (veteran with dependent, A&A); pension offsets income.
Asset Limits ~$155,356 net worth
WA

High veteran use; supports rural/urban needs.

Benefits
Cash (~$1,433-$2,642/month veteran, ~$951-$1,318 spouse) for care costs

Senior Citizens Property Tax Exemption

Washington Senior Property Tax Exemption

Age 61+ or disabled retiree
General WA resident, homeowner, income-based.
Income Limits (2025) ~$45,000-$70,000/year varies by county, e.g., King: $70,000
Asset Limits Not assessed; home value cap varies ~$250,000-$400,000
WA

Saves ~$500-$1,500/year; offered statewide.

Benefits
Tax exemption (~$500-$1,500/year depending on county)

Senior Farmers’ Market Nutrition Program (SFMNP)

Washington SFMNP

Age 60+
General WA resident, low-income.
Income Limits (2025) ~$2,322/month 185% FPL
Asset Limits Not assessed.
WA

Vouchers (~$80/season); serves ~20,000 via AAAs.

Benefits
Vouchers (~$80/season) for produce at farmers’ markets

Places of interest near Mt. Baker Care Center

Address 3.4 miles from city center Info Estimated distance in miles from Bellingham's city center to Mt. Baker Care Center's address, calculated via Google Maps.

Calculate Travel Distance to Mt. Baker Care Center

Add your location

Address

Staffing Data (Q2 2025)

This data corresponds to Q2 2025 and is based on CMS Payroll-Based Journal.

Total staff 130
Employees 129
Contractors 1
Staff to resident ratio 2.36:1
28% better than Washington average

Washington average ratio: 1.85:1

Avg staff/day 52
Average shift 7.3 hours
10% worse than Washington average

Washington average: 8.1 hours

Total staff hours (quarter) 34,428
Nursing staff breakdown
Registered Nurse

Manages medical care and health needs.

Total count 16
Average shift length Info Average shift length. Calculated as total hours divided by days worked and average staff per day. 7.7 hours

No contractors work on this role.

Licensed Practical Nurse

Assists with medical care and medications.

Total count 13
Average shift length Info Average shift length. Calculated as total hours divided by days worked and average staff per day. 7 hours

No contractors work on this role.

Certified Nursing Assistant

Helps with daily care and mobility.

Total count 63
Average shift length Info Average shift length. Calculated as total hours divided by days worked and average staff per day. 7.5 hours

No contractors work on this role.

Contractor staffing

Total hours from contractors

0.1%

48 contractor hours this quarter

Medical Director: 1
Staff by category
Certified Nursing Assistant6306315,80791100%7.5
Registered Nurse160164,51491100%7.7
Licensed Practical Nurse130133,75991100%7
Other Dietary Services Staff6061,51691100%7.1
Dental Services Staff3031,3226774%7.5
Clinical Nurse Specialist6061,2977785%6.5
Medication Aide/Technician3031,2768998%8.1
Qualified Social Worker2028926673%7.2
Speech Language Pathologist2028177380%7.4
Respiratory Therapy Technician4047587077%6.6
Physical Therapy Assistant4045476673%7.6
Nurse Practitioner1015126470%8
Administrator1014645864%8
Physical Therapy Aide1013876167%6.3
RN Director of Nursing1012234752%4.7
Dietitian1011151618%7.2
Occupational Therapy Aide1011032932%3.6
Nurse Aide in Training101711112%6.4
Medical Director0114867%8
63 Certified Nursing Assistant
% of Days 100%
16 Registered Nurse
% of Days 100%
13 Licensed Practical Nurse
% of Days 100%
6 Other Dietary Services Staff
% of Days 100%
3 Dental Services Staff
% of Days 74%
6 Clinical Nurse Specialist
% of Days 85%
3 Medication Aide/Technician
% of Days 98%
2 Qualified Social Worker
% of Days 73%
2 Speech Language Pathologist
% of Days 80%
4 Respiratory Therapy Technician
% of Days 77%
4 Physical Therapy Assistant
% of Days 73%
1 Nurse Practitioner
% of Days 70%
1 Administrator
% of Days 64%
1 Physical Therapy Aide
% of Days 67%
1 RN Director of Nursing
% of Days 52%
1 Dietitian
% of Days 18%
1 Occupational Therapy Aide
% of Days 32%
1 Nurse Aide in Training
% of Days 12%
1 Medical Director
% of Days 7%

Facility Characteristics

Source: CMS Long-Term Care Facility Characteristics (Data as of Jan 2026)

Total residents 55
Medicare
14
25.5% of residents
Medicaid
19
34.5% of residents
Private pay or other
22
40% of residents
Programs & Services
Residents Group

Residents meet regularly to discuss policies, care quality, and activities

Active Resident Council

Organized group of residents that meets regularly to discuss facility policies, quality of life, and activities.

Quality of care over time

These measures show how residents usually do over time at this home, based on health outcomes and preventive care.

High-risk clinical events score Info A composite score based on pressure ulcers, falls with injury, weight loss, walking ability decline, and activities of daily living decline. 16.1
60% worse than Washington average

Washington average: 10.0

Functional decline score Info A composite score based on activities of daily living decline, walking ability decline, and incontinence. 32.3
55% worse than Washington average

Washington average: 20.9

Long-stay resident measures
Below average Washington avg: 3.6 Info CMS star rating based on long-stay quality measure performance. 5 stars = significantly above average, 1 star = significantly below average.
Need for Help with Daily Activities Increased Info Percent of long-stay residents whose need for help with daily activities has increased 27.7%
69% worse than Washington average

Washington average: 16.4%

Walking Ability Worsened Info Percent of long-stay residents whose ability to move independently worsened 38.0%
74% worse than Washington average

Washington average: 21.8%

Low Risk Residents with Bowel/Bladder Incontinence Info Percent of low risk long-stay residents who lose control of their bowels or bladder 31.2%
28% worse than Washington average

Washington average: 24.3%

Falls with Major Injury Info Percent of long-stay residents experiencing one or more falls with major injury 12.0%
360% worse than Washington average

Washington average: 2.6%

High Risk Residents with Pressure Ulcers Info Percent of long-stay high risk residents with pressure ulcers 1.2%
77% better than Washington average

Washington average: 4.9%

Urinary Tract Infection Info Percent of long-stay residents with a urinary tract infection 1.3%
24% better than Washington average

Washington average: 1.7%

Lost Too Much Weight Info Percent of long-stay residents who lose too much weight 1.5%
74% better than Washington average

Washington average: 5.8%

Depressive Symptoms Info Percent of long-stay residents who have depressive symptoms 51.3%
217% worse than Washington average

Washington average: 16.2%

Antipsychotic Use Info Percent of long-stay residents who received an antipsychotic medication 17.1%
18% worse than Washington average

Washington average: 14.5%

Pneumococcal Vaccine Info Percent of long-stay residents assessed and appropriately given the pneumococcal vaccine 96.2%
In line with Washington average

Washington average: 96.2%

Influenza Vaccine Info Percent of long-stay residents assessed and appropriately given the seasonal influenza vaccine 97.6%
In line with Washington average

Washington average: 93.8%

Hospitalizations per 1,000 days Info Number of hospitalizations per 1,000 long-stay resident days. 1.95
41% worse than Washington average

Washington average: 1.38

ED visits per 1,000 days Info Number of outpatient emergency department visits per 1,000 long-stay resident days. 0.69
54% better than Washington average

Washington average: 1.51

Short-stay resident measures
Significantly above average Washington avg: 3.6 Info CMS star rating based on short-stay quality measure performance. 5 stars = much above average, 1 star = much below average.
Pneumococcal Vaccine Info Percent of short-stay residents assessed and appropriately given the pneumococcal vaccine 97.8%
11% better than Washington average

Washington average: 88.1%

Antipsychotic medication increase Info Percent of short-stay residents who newly received an antipsychotic medication 1.1%
25% better than Washington average

Washington average: 1.4%

Influenza Vaccine Info Percent of short-stay residents assessed and appropriately given the seasonal influenza vaccine 96.9%
18% better than Washington average

Washington average: 82.0%

Re-hospitalized after SNF stay Info Percentage of short-stay residents who were re-hospitalized after their nursing home admission. 19.4%
In line with Washington average

Washington average: 19.9%

Emergency department visits Info Percentage of short-stay residents who had an outpatient emergency department visit. 6.4%
52% better than Washington average

Washington average: 13.2%

Falls with major injury Info Percentage of SNF residents who experience falls with major injury during their stay. 0.0%
100% better than Washington average

Washington average: 0.8%

Ability to care for self at discharge Info Percentage of residents at or above expected ability to care for themselves at discharge. 58.0%
8% better than Washington average

Washington average: 53.7%

Successful return to home or community Info Rate of successful return to home or community from a skilled nursing facility. 58.5%
16% better than Washington average

Washington average: 50.6%

Guides for Better Senior Living

Care Cost Calculator: See Prices in Your Area

Nursing Home Data Explorer

Don’t Wait Too Long: 7 Red Flag Signs Your Parent Needs Assisted Living Now

The True Cost of Assisted Living in 2025 – And How Families Are Paying For It

Understanding Senior Living Costs: Pricing Models, Discounts & Financial Assistance

Tour Icon
Planning a tour? Check our touring checklist.
Chat Icon
Thinking of living here? We can help you speak to a current resident
Explore Open Rooms
1 Contact details
2 What type of senior care service are you looking for?
3 What budget do you have in mind for senior care?
4 How soon do you need to find care?
5 Additional details

Thank you for your interest!

Our team will be in touch shortly to help with next steps.