New York Congregational Nursing and Rehabilitation Center
CMS overall rating Info CMS (the Centers for Medicare & Medicaid Services) is the federal agency that rates nursing home quality. Its Overall Rating runs from 1 to 5 stars, combining health inspections, staffing, and quality measures, with inspections weighted most heavily.

New York Congregational Nursing and Rehabilitation Center

CMS overall rating Info CMS (the Centers for Medicare & Medicaid Services) is the federal agency that rates nursing home quality. Its Overall Rating runs from 1 to 5 stars, combining health inspections, staffing, and quality measures, with inspections weighted most heavily.
Calculator: See prices in your area
New York Congregational Nursing and Rehabilitation Center accepts Medicare, Medicaid, and private pay.

Overview of New York Congregational Nursing and Rehabilitation Center

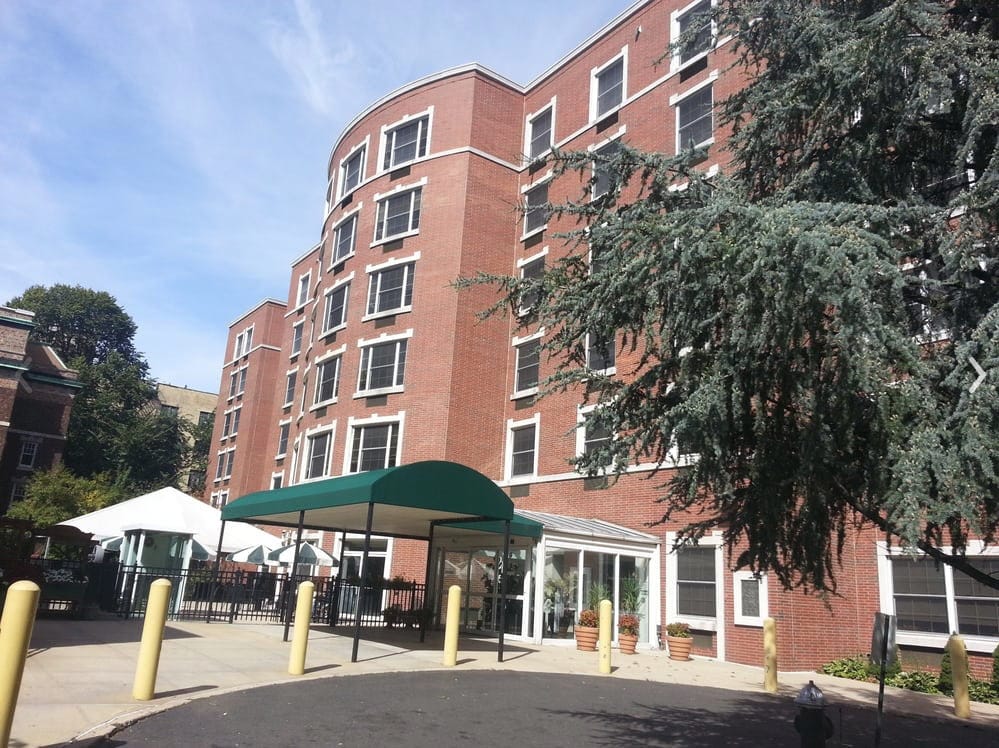
Since 1997, the New York Congregational Nursing and Rehab Center has been a trusted provider of nursing, counseling, and rehabilitation therapy to individuals in need. They offer a culturally diverse environment that celebrates the unique needs and backgrounds of their residents. Its experienced team understands that each individual is different, and they strive to create personalized care plans that leverage each resident’s strengths to aid in their recovery.

The facility also offers a variety of amenities, including culinary arts, pet-friendly accommodations, and an atmosphere of compassionate care. In addition to nursing and rehabilitation therapy, they offer a wide range of medical services and pastoral care. Nutritional counseling and beauty parlor services are also available to ensure residents feel comfortable and supported during their stay. For anyone seeking exceptional healthcare services in a supportive and nurturing environment, the New York Congregational Nursing and Rehab Center is an ideal choice. 

(718) 576-7000

Quality ratings

Measured by Centers for Medicare & Medicaid Services (CMS)

Overall rating Info The Overall CMS Rating combines results from health inspections, staffing levels and quality measures. Health inspections carry the most weight. Staffing and quality scores can increase or decrease the final rating based on performance compared to state and national standards.
▲ 62.7% Above NY avg. ▲ 62.7% Above NY avg.NY average: 3.1Click the badge to see the full State ranking.Click here to see the full State ranking.
Health Inspection Info Based on the results of the facility's three most recent standard inspections and any complaint investigations. CMS reviews the number, scope, and severity of deficiencies, with more recent findings weighted more heavily.
▲ 41.3% Above NY avg. ▲ 41.3% Above NY avg.NY average: 2.8Click the badge to see the full State ranking.Click here to see the full State ranking.
Staffing Info Measures average nursing staff hours per resident per day, including Registered Nurses (RNs) and total nursing staff. Ratings are adjusted based on the level of care residents require and are compared to state and national benchmarks.
▼ 26.4% Below NY avg. ▼ 26.4% Below NY avg.NY average: 2.7Click the badge to see the full State ranking.Click here to see the full State ranking.
Quality Measures Info Based on clinical and physical health indicators reported to CMS, such as hospital readmissions, falls, pressure ulcers, and improvements in mobility. These measures reflect how well residents' health needs are being managed.
▲ 30.9% Above NY avg. ▲ 30.9% Above NY avg.NY average: 3.8Click the badge to see the full State ranking.Click here to see the full State ranking.

Staffing hours breakdown

Info Daily nursing hours per resident by staff type, reported to CMS. Higher is generally better — compare this facility to state and national averages to see where staffing stands.

Hours per resident per day — compared to New York state averages

Total nursing care / resident Info This home is ranked 296th out of 407 homes in New York for nurse hours. Total adjusted nursing hours per resident per day, combining RN, LPN, and aide time. CMS adjusts this for case-mix so facilities can be fairly compared.
2h 52m per day
Rank #296 / 407Nurse hours — State benchmarkedThis home is ranked 296th out of 407 homes in New York. Shows adjusted nurse hours per resident per day benchmarked to the New York average, with a ranking across 407 New York facilities. More hours mean more direct care. The national average is about 3.5 hrs; below 3.0 is a red flag.Rankings are based only on facilities in New York that report data for that category. Facilities without available data are excluded from the ranking.Click the rank badge to see the full State ranking.Click here to see the full State ranking.
This facility New York avg (3h 35m per day)
vs New York avg
-20%

5 of 6 metrics below state avg

Standout metric Weekend RN is +10% above state avg
Staff typeHours / Day / Residentvs state avg
Registered Nurse (RN) Info RNs hold the highest nursing license and can assess residents, interpret test results, and direct care plans. More RN hours per day often signals stronger clinical oversight and faster response to health changes. 39m per day ▼ 8% State avg: 42m per day · National avg: 41m per day
LPN / LVN Info Licensed Practical Nurses (LPNs) or Licensed Vocational Nurses (LVNs) deliver routine hands-on care — medication administration, wound dressing, and monitoring vital signs. They work under RN supervision and make up a large share of daily bedside care. 22m per day ▼ 52% State avg: 46m per day · National avg: 52m per day
Nurse Aide Info Certified Nurse Aides (CNAs) provide the most direct day-to-day assistance: bathing, dressing, feeding, and mobility. Nurse aide hours are typically the largest staffing category and directly affect residents' quality of life. 1h 50m per day ▼ 16% State avg: 2h 11m per day · National avg: 2h 21m per day
Weekend Total Nursing Info Combined nursing hours (RN + LPN + Nurse Aide) per resident per day on weekends. Staffing often drops on weekends — this figure reveals whether the facility maintains adequate coverage outside of weekday hours. 2h 37m per day ▼ 18% State avg: 3h 10m per day · National avg: 3h 26m per day
Physical Therapist Info Hours per resident per day provided by licensed Physical Therapists (PTs) or PT Assistants. PT services help residents recover mobility after injury or illness and are especially important for post-acute (short-stay) rehabilitation. 5m per day ▼ 29% State avg: 7m per day · National avg: 4m per day
Weekend RN Info Registered nurse hours specifically on weekends. Facilities sometimes reduce RN presence on Saturdays and Sundays — a low weekend RN figure compared to weekday hours can indicate reduced clinical oversight when most administrative staff are absent. 31m per day ▲ 10% State avg: 28m per day · National avg: 29m per day

Capacity and availability

Avg. Length of Stay
161 days
Bed community size
200-bed community Rank #169 / 748Bed count — State benchmarkedThis home is ranked 169th out of 748 homes in New York. Shows this facility's certified or reported bed count compared to other New York facilities. Larger communities may offer more amenities, programs, and on-site services for residents and families.Rankings are based only on facilities in New York that report data for that category. Facilities without available data are excluded from the ranking.Click the rank badge to see the full State ranking.Click here to see the full State ranking.
A large-scale community that may provide a wide range of amenities, services, and structured programs.
Walk Score
Walk Score: 95 / 100 Rank #132 / 1173Walk Score — State benchmarkedThis home is ranked 132nd out of 1173 homes in New York. Shows how walkable this facility's neighborhood is compared to the average Walk Score across New York facilities. Higher scores benefit residents, families, and staff.Rankings are based only on facilities in New York that report data for that category. Facilities without available data are excluded from the ranking.Click the rank badge to see the full State ranking.Click here to see the full State ranking.
Walker's paradise. Daily errands do not require a car, with many shops and services nearby.

About this community

License Details

CountyKings

Contact New York Congregational Nursing and Rehabilitation Center

Inspection History

In New York, the Department of Health, Office of Aging and Long Term Care performs unannounced onsite inspections to monitor compliance with state and federal healthcare regulations.

Since 2022 · 4 years of data 0 enforcement actions 22 violations 4 inspections

Inspection Scorecard Info This scorecard compares key inspection, citation, and complaint metrics at this facility against the New York state average. Metrics rated ≥15% worse than average are highlighted in red; those ≥15% better are highlighted in green.

Since 2022 vs. New York state average
Overall vs. NY average 0 Worse No metrics in this bucket. 0 Better No metrics in this bucket.
Latest Inspection August 14, 2025 Abbreviated Survey

Inspections Info State inspections evaluate whether the facility meets health and safety standards.

This FacilityNY Averagevs. NY Avg
Total inspections Info Combined count of all routine and focused inspections. Excludes complaint investigations. 4
Complaint visits Info On-site visits triggered by formal complaints filed by residents, families, or staff. 0

Violations Info Violations are formal regulatory issues recorded during state inspections.

This FacilityNY Averagevs. NY Avg
Total violations Info Formal regulatory issues recorded by inspectors across all inspection types. 22
Violations per year Info Average violations per year since 2022. 5.5
Violations per inspection Info Average violations per inspection. 5.5

Health Inspection History

Inspections since 2019
Total health inspections 5

New York average 3.6


Last Health inspection on Aug 2025

Total health citations
22 Rank #288 / 414Health citations — State benchmarkedThis home is ranked 288th out of 414 homes in New York. Shows this facility's total health deficiency citations benchmarked to the New York State average, with a ranking across all 414 NY facilities. Lower citation counts earn a better rank.Rankings are based only on facilities in New York that report data for that category. Facilities without available data are excluded from the ranking.Click the rank badge to see the full State ranking.Click here to see the full State ranking.

New York average 18.5

Citations per inspection
4.4 Rank #182 / 414Citations per inspection — State benchmarkedThis home is ranked 182nd out of 414 homes in New York. Shows average deficiency citations per CMS inspection for this facility versus the New York mean across 414 facilities with citation data. Lower is better.Rankings are based only on facilities in New York that report data for that category. Facilities without available data are excluded from the ranking.Click the rank badge to see the full State ranking.Click here to see the full State ranking.

New York average 5.05


Health citations are formal notices following inspections when they fail to comply with safety and care standards.

20 of 22 citations resulted from standard inspections; and 2 of 22 resulted from complaint investigations.

Breakdown of citation severity (last 7 years)
Critical health citations
0
100% better than New York average

New York average: 0.2


Serious health citations
0
100% better than New York average

New York average: 0.2

0 critical citations New York average: 0.2

0 serious citations New York average: 0.2

22 moderate citations New York average: 17.4

0 minor citations New York average: 0.7
Citations history (last 7 years)
Quality of Care moderate citation Aug 14, 2025
Corrected

Abuse/Neglect moderate citation Jul 03, 2025

Infection Control moderate citation Sep 15, 2023
Corrected

Nutrition moderate citation Sep 15, 2023
Corrected

Lawsuit overview for New York Congregational Nursing and Rehabilitation Center

Summary of court-record activity tied to this facility, compiled from publicly available case dockets.

Source: State court e-filing records

Total Cases Info Every lawsuit on record involving this facility since the earliest filing. Long-term volume signals overall legal exposure. 1
Active Cases Info Lawsuits still moving through the courts. Active claims can affect day-to-day operations, settlement risk, and insurance posture. 1
Since Info Year of the earliest case on record. A long history with steady filings suggests persistent issues; a recent first filing means newer exposure. 2025
Most Recent Info Most recent filing on record. Recent activity means legal disputes are still being raised against this facility. 2025
Next Court Date Info Next scheduled court appearance on record across active cases. Apr 23, 2026

Staffing Data

Reporting period: October 1 – December 31, 2025 (Q4 2025). Source: CMS Payroll-Based Journal report.

Total staff 217
Employees 189
Contractors 28
Staff to resident ratio 1.23 : 1
600% more staff per resident than New York average
New York average ratio: 0.18 : 1 New York average ratio: 0.18 : 1See full New York ranking
Avg staff/day 98
Average shift 6.8 hours
12% worse than New York average
New York average: 7.7 hours New York average shift: 7.7 hoursSee full New York ranking
Total staff hours (quarter) 61,701

Nursing staff breakdown

Q4 2025 · Oct 1 – Dec 31 More info This data comes from the CMS Payroll-Based Journal report covering October 1 – December 31, 2025.
Registered Nurse

Manages medical care and health needs.

RN Staff Info 43 total: 41 full-time employees and 2 contractors. 43
Average shift length Info Average shift length. Calculated as total hours divided by days worked and average staff per day. 7.3 hours
Licensed Practical Nurse

Assists with medical care and medications.

LPN Staff Info All 19 LPN Staff are full-time employees. No contractors work on this role. 19
Average shift length Info Average shift length. Calculated as total hours divided by days worked and average staff per day. 6.5 hours
Certified Nursing Assistant

Helps with daily care and mobility.

CNA Staff Info All 102 CNA Staff are full-time employees. No contractors work on this role. 102
Average shift length Info Average shift length. Calculated as total hours divided by days worked and average staff per day. 6.6 hours

Contractor staffing

Q4 2025 · Oct 1 – Dec 31 More info This data comes from the CMS Payroll-Based Journal report covering October 1 – December 31, 2025.

Total hours from contractors

11.1%

6,849 contractor hours this quarter

Physical Therapy Assistant: 8 Physical Therapy Aide: 5 Respiratory Therapy Technician: 5 Speech Language Pathologist: 4 Qualified Social Worker: 4 Registered Nurse: 2

Staff by category

Q4 2025 · Oct 1 – Dec 31 More info This data comes from the CMS Payroll-Based Journal report covering October 1 – December 31, 2025.
Certified Nursing Assistant102010232,03792100%6.6
Registered Nurse412438,18092100%7.3
Licensed Practical Nurse190196,40392100%6.5
Clinical Nurse Specialist7072,5639199%6.8
Physical Therapy Assistant0881,4938188%7.6
Respiratory Therapy Technician0551,4558289%7.8
Speech Language Pathologist0441,4317582%8
Occupational Therapy Aide6061,3968289%6.5
Other Dietary Services Staff4041,2378795%7
Physical Therapy Aide0551,2047379%7.1
Mental Health Service Worker3031,1506571%8
Qualified Social Worker0441,0167784%7.4
Other Social Services Staff2025884852%7.6
Administrator1015286672%8
Nurse Practitioner1015286672%8
Respiratory Therapist1013654953%7.4
Dietitian1011201516%8
Qualified Activities Professional101811%8
102 Certified Nursing Assistant
% of Days 100%
43 Registered Nurse
% of Days 100%
19 Licensed Practical Nurse
% of Days 100%
7 Clinical Nurse Specialist
% of Days 99%
8 Physical Therapy Assistant
% of Days 88%
5 Respiratory Therapy Technician
% of Days 89%
4 Speech Language Pathologist
% of Days 82%
6 Occupational Therapy Aide
% of Days 89%
4 Other Dietary Services Staff
% of Days 95%
5 Physical Therapy Aide
% of Days 79%
3 Mental Health Service Worker
% of Days 71%
4 Qualified Social Worker
% of Days 84%
2 Other Social Services Staff
% of Days 52%
1 Administrator
% of Days 72%
1 Nurse Practitioner
% of Days 72%
1 Respiratory Therapist
% of Days 53%
1 Dietitian
% of Days 16%
1 Qualified Activities Professional
% of Days 1%

Penalties and fines

Federal penalties imposed by CMS for regulatory violations, including civil money penalties (fines) and denials of payment for new Medicare/Medicaid admissions.

Source: CMS Penalties Database

No penalties in the past 3 years

No civil money penalties or payment denials were reported in the last 3 years.

Quality of care over time

These measures show how residents usually do over time at this home, based on health outcomes and preventive care.

High-risk clinical events score Info A composite score based on pressure ulcers, falls with injury, weight loss, walking ability decline, and activities of daily living decline. 11.1
13% worse than New York average

New York average: 9.8

Functional decline score Info A composite score based on activities of daily living decline, walking ability decline, and incontinence. 18.7
In line with New York average

New York average: 18.1

Long-stay resident measures
Average Info CMS star rating based on long-stay quality measure performance. 5 stars = significantly above average, 1 star = significantly below average.
Need for Help with Daily Activities Increased Info Percent of long-stay residents whose need for help with daily activities has increased 20.4%
24% worse than New York average

New York average: 16.4%

Walking Ability Worsened Info Percent of long-stay residents whose ability to move independently worsened 22.5%
35% worse than New York average

New York average: 16.6%

Low Risk Residents with Bowel/Bladder Incontinence Info Percent of low risk long-stay residents who lose control of their bowels or bladder 13.3%
38% better than New York average

New York average: 21.4%

Falls with Major Injury Info Percent of long-stay residents experiencing one or more falls with major injury 0.4%
85% better than New York average

New York average: 3.0%

High Risk Residents with Pressure Ulcers Info Percent of long-stay high risk residents with pressure ulcers 5.4%
24% better than New York average

New York average: 7.2%

Urinary Tract Infection Info Percent of long-stay residents with a urinary tract infection 1.8%
30% worse than New York average

New York average: 1.4%

Lost Too Much Weight Info Percent of long-stay residents who lose too much weight 6.8%
12% worse than New York average

New York average: 6.1%

Depressive Symptoms Info Percent of long-stay residents who have depressive symptoms 3.6%
80% better than New York average

New York average: 18.1%

Antipsychotic Use Info Percent of long-stay residents who received an antipsychotic medication 6.5%
48% better than New York average

New York average: 12.6%

Pneumococcal Vaccine Info Percent of long-stay residents assessed and appropriately given the pneumococcal vaccine 85.6%
6% worse than New York average

New York average: 91.4%

Influenza Vaccine Info Percent of long-stay residents assessed and appropriately given the seasonal influenza vaccine 87.9%
8% worse than New York average

New York average: 95.2%

Hospitalizations per 1,000 days Info Number of hospitalizations per 1,000 long-stay resident days. 2.14
25% worse than New York average

New York average: 1.71

ED visits per 1,000 days Info Number of outpatient emergency department visits per 1,000 long-stay resident days. 1.20
11% better than New York average

New York average: 1.35

Short-stay resident measures
Significantly below average Info CMS star rating based on short-stay quality measure performance. 5 stars = much above average, 1 star = much below average.
Pneumococcal Vaccine Info Percent of short-stay residents assessed and appropriately given the pneumococcal vaccine 48.6%
37% worse than New York average

New York average: 76.6%

Antipsychotic medication increase Info Percent of short-stay residents who newly received an antipsychotic medication 3.2%
152% worse than New York average

New York average: 1.3%

Influenza Vaccine Info Percent of short-stay residents assessed and appropriately given the seasonal influenza vaccine 58.3%
26% worse than New York average

New York average: 78.8%

Re-hospitalized after SNF stay Info Percentage of short-stay residents who were re-hospitalized after their nursing home admission. 20.2%
In line with New York average

New York average: 20.6%

Emergency department visits Info Percentage of short-stay residents who had an outpatient emergency department visit. 12.2%
26% worse than New York average

New York average: 9.7%

Falls with major injury Info Percentage of SNF residents who experience falls with major injury during their stay. 1.8%
132% worse than New York average

New York average: 0.8%

Ability to care for self at discharge Info Percentage of residents at or above expected ability to care for themselves at discharge. 36.8%
31% worse than New York average

New York average: 53.7%

Successful return to home or community Info Rate of successful return to home or community from a skilled nursing facility. 36.5%
28% worse than New York average

New York average: 50.6%

Breakdown by payment type

Medicare

25% of new residents, usually for short-term rehab.

Typical stay 3 - 4 months

Private pay

38% of new residents, often for short stays.

Typical stay 3 - 4 months

Medicaid

38% of new residents, often for long-term daily care.

Typical stay 8 - 9 months

Facility Characteristics

Source: CMS Long-Term Care Facility Characteristics (Data as of Jan 2026)

Total residents 177
Medicare
17
9.6% of residents
Medicaid
107
60.5% of residents
Private pay or other
53
29.9% of residents
Programs & Services
Residents Group

Residents meet regularly to discuss policies, care quality, and activities

Active Resident Council

Organized group of residents that meets regularly to discuss facility policies, quality of life, and activities.

Finances and operations

Based on CMS SNF Cost Report for fiscal year ending in 12/2023.

Privately-owned community
Operated by a single business entity.
Net patient revenue Info Net patient revenue — what the home actually collects for resident care, after contractual allowances, bad debt and discounts are subtracted from its gross charges (CMS cost report, Worksheet G-3). It covers resident care only; money the home earns from other sources is shown separately as "Other income."
$29.3M
Net patient income Info Net patient income: net patient revenue minus the home's total operating expenses. A positive figure means it earns more from resident care than it spends to deliver it; a negative figure means the opposite. It excludes non-operating "other income."
-$2.2M
Privately-owned community Operated by a single business entity.
Net patient revenue Info Net patient revenue — what the home actually collects for resident care, after contractual allowances, bad debt and discounts are subtracted from its gross charges (CMS cost report, Worksheet G-3). It covers resident care only; money the home earns from other sources is shown separately as "Other income."
$29.3M Rank #166 / 403Revenue — State benchmarkedThis home is ranked 166th out of 403 homes in New York. Shows this facility's annual revenue compared to the New York average. Higher revenue generally means more resources for staffing and capital — read alongside Payroll %.Rankings are based only on facilities in New York that report data for that category. Facilities without available data are excluded from the ranking.Click the rank badge to see the full State ranking.Click here to see the full State ranking.
Net patient income Info Net patient income: net patient revenue minus the home's total operating expenses. A positive figure means it earns more from resident care than it spends to deliver it; a negative figure means the opposite. It excludes non-operating "other income."
-$2.2M
Other income Info Money the home earns outside of resident care — such as investments, grants, rentals and other non-operating sources (CMS cost report, Worksheet G-3). It is tracked separately from net patient revenue: it is not part of that figure, and it is not included in net patient income.
$607.5K
Payroll costs Info Staff salaries plus wage-related costs — benefits such as payroll taxes, health insurance and retirement — from the home's own accounting records (CMS cost report, Worksheet A). Contract or agency labor is counted separately, under other operating costs. Rank #153 / 403Payroll — State benchmarkedThis home is ranked 153rd out of 403 homes in New York. Shows total annual staff payroll benchmarked to the New York average. Higher payroll investment relative to peers often signals better staffing and less reliance on cheaper contract labor.Rankings are based only on facilities in New York that report data for that category. Facilities without available data are excluded from the ranking.Click the rank badge to see the full State ranking.Click here to see the full State ranking.
$17.6M 60% of net patient revenue Info Payroll as a share of revenue: staff salaries and wage-related benefits divided by net patient revenue. A higher figure means more of each revenue dollar goes to staff pay. Rank #170 / 403Payroll % — State benchmarkedThis home is ranked 170th out of 403 homes in New York. Shows payroll as a percentage of revenue versus the New York average. Well-run New York facilities typically land around 53–65% — the top third Statewide. Below 25% may signal understaffing or heavy agency use — read with Staffing ratings.Rankings are based only on facilities in New York that report data for that category. Facilities without available data are excluded from the ranking.Click the rank badge to see the full State ranking.Click here to see the full State ranking.
Other operating costs Info Everything it costs to run the home apart from payroll — food, utilities, supplies, maintenance, contract labor and administration. Calculated as total operating expense minus payroll (staff salaries and wage-related benefits).
$13.9M
Total costs Info The home's total operating expense for the year — all the costs of running it, salaries included (CMS cost report, Worksheet G-3).
$31.5M

Who this home usually serves

TYPE OF STAY

Mostly long-term care residents

Most residents stay for extended periods and receive ongoing daily care.

New residents most often arrive under private pay (38% of admissions), and a typical private pay stay runs around 3 - 4 months.

Admissions
424 total

Coverage residents most often arrive under.

Medicare 25%
Private pay 38%
Medicaid 38%
Discharges
423 total

Coverage residents most often leave under.

Medicare 24%
Private pay 38%
Medicaid 38%

Places of interest near New York Congregational Nursing and Rehabilitation Center

Address 2.3 miles from city center Info Estimated distance in miles from Brooklyn's city center to New York Congregational Nursing and Rehabilitation Center's address, calculated via Google Maps. — 2.21 miles to nearest hospital (One Brooklyn Health-Brookdale University Hospital Medical Center)

Calculate Travel Distance to New York Congregational Nursing and Rehabilitation Center

Add your location

Address

Compare Nursing Homes around Brooklyn

The information below is reported by the New York State Department of Health.

5 facilities compared · CMS & NY Dept. of Health data

Hopkins Center For Rehabilitation And Healthcare
NH
NC
Brooklyn (Boerum Hill)
288
Facility 288
NY AVG 160
Rank #75 / 748
99.0%
Facility 99.0%
NY AVG 88.3%
Rank #1 / 436
+12%
2.88
Facility 2.88
NY AVG 3.58
Rank #296 / 407
-16%-20%
$0
Facility $0
NY AVG $67.6k
Rank #1 / 415
85
Facility 85
NY AVG 83
Rank #254 / 593
14
Facility 14
NY AVG 18.5
Rank #153 / 414
4.7
Facility 4.7
NY AVG 5.1
Rank #199 / 414
-283-
97
Facility 97
NY AVG 63
Rank #81 / 1173
Hopkins Ventures LLC
$52.1M
Facility $52.1M
NY AVG $32.0M
Rank #82 / 403
$20.6M
Facility $20.6M
NY AVG $10.7M
Rank #66 / 403
39.5%
Facility 39.5%
NY AVG 37%
Rank #114 / 403
335847
Ditmas Park Nursing & Rehab
NH
Brooklyn (Flatbush)
240
Facility 240
NY AVG 160
Rank #113 / 748
95.0%
Facility 95.0%
NY AVG 88.3%
Rank #412 / 436
+8%- +50%-
$0
Facility $0
NY AVG $67.6k
Rank #1 / 415
85
Facility 85
NY AVG 83
Rank #254 / 593
7
Facility 7
NY AVG 18.5
Rank #31 / 414
2.3
Facility 2.3
NY AVG 5.1
Rank #31 / 414
-194A-
93
Facility 93
NY AVG 63
Rank #192 / 1173
Bmo Family Holdings LLC
$62.0M
Facility $62.0M
NY AVG $32.0M
Rank #44 / 403
$9.0M
Facility $9.0M
NY AVG $10.7M
Rank #67 / 403
14.4%
Facility 14.4%
NY AVG 37%
Rank #331 / 403
335648
New York Congregational Nursing and Rehabilitation Center
NH
Brooklyn (Little Haiti)
200
Facility 200
NY AVG 160
Rank #169 / 748
--
2.87
Facility 2.87
NY AVG 3.58
Rank #296 / 407
+57%-20%
$0
Facility $0
NY AVG $67.6k
Rank #1 / 415
-
22
Facility 22
NY AVG 18.5
Rank #288 / 414
4.4
Facility 4.4
NY AVG 5.1
Rank #182 / 414
-26-
95
Facility 95
NY AVG 63
Rank #132 / 1173
Jhsl 135 Opco LLC
$29.3M
Facility $29.3M
NY AVG $32.0M
Rank #166 / 403
$17.6M
Facility $17.6M
NY AVG $10.7M
Rank #153 / 403
60%
Facility 60%
NY AVG 37%
Rank #170 / 403
335560
The Phoenix Rehabilitation And Nursing Center
NH
RC
Brooklyn (Fort Greene)
400
Facility 400
NY AVG 160
Rank #25 / 748
98.0%
Facility 98.0%
NY AVG 88.3%
Rank #41 / 436
+11%
2.59
Facility 2.59
NY AVG 3.58
Rank #379 / 407
+2%-28%
$0
Facility $0
NY AVG $67.6k
Rank #1 / 415
-
8
Facility 8
NY AVG 18.5
Rank #42 / 414
2.7
Facility 2.7
NY AVG 5.1
Rank #44 / 414
-392-
96
Facility 96
NY AVG 63
Rank #108 / 1173
-
$62.6M
Facility $62.6M
NY AVG $32.0M
Rank #39 / 403
$22.5M
Facility $22.5M
NY AVG $10.7M
Rank #51 / 403
35.9%
Facility 35.9%
NY AVG 37%
Rank #279 / 403
335516
Palm Gardens Center For Nursing And Rehabilitation
NH
HC
NC
Brooklyn (Kensington)
240
Facility 240
NY AVG 160
Rank #113 / 748
94.2%
Facility 94.2%
NY AVG 88.3%
Rank #150 / 436
+7%
2.67
Facility 2.67
NY AVG 3.58
Rank #351 / 407
+8%-25%
$0
Facility $0
NY AVG $67.6k
Rank #1 / 415
83
Facility 83
NY AVG 83
Rank #303 / 593
10
Facility 10
NY AVG 18.5
Rank #76 / 414
3.3
Facility 3.3
NY AVG 5.1
Rank #86 / 414
-224A+
80
Facility 80
NY AVG 63
Rank #457 / 1173
Palm Gardens Care Center, LLC (For Profit)
$51.0M
Facility $51.0M
NY AVG $32.0M
Rank #66 / 403
$26.6M
Facility $26.6M
NY AVG $10.7M
Rank #41 / 403
52.2%
Facility 52.2%
NY AVG 37%
Rank #53 / 403
335328

Financial Assistance for
Nursing Home in New York

New York Congregational Nursing and Rehabilitation Center is located in Brooklyn, New York.
Here are the financial assistance programs available to residents in New York.

Get Financial aid guidance

Community First Choice Option

NY Medicaid CFCO

Age 65+ or disabled
General New York resident, Medicaid- eligible, care need (not necessarily nursing home level).
Income Limits (2025) ~$2,829/month 300% FBR, individual
Asset Limits $30,182 individual, higher due to NY Medicaid expansion
NY

Higher asset limit; urban density increases demand.

Benefits
Personal care (5-7 hours/day) Respite care (240 hours/year) Home modifications ($1,500 avg.) Assistive technology ($500 avg.)

Expanded In-Home Services for the Elderly Program (EISEP)

NY EISEP

Age 60+
General New York resident, at risk of decline but not nursing home level.
Income Limits ~$2,500/month individual, varies
Asset Limits $15,000 individual
NY

Cost-sharing required above certain income; urban/rural balance.

Benefits
In-home care (3-5 hours/week) Respite (up to 10 days/year) Case management Transportation (~5 trips/month)

Senior Citizen Rent Increase Exemption (SCRIE)

NY SCRIE

Age 62+
General NYC resident, live in rent-controlled/stabilized apartment, spend >1/3 of income on rent.
Income Limits (2025) $50,000/year household
Asset Limits No strict asset cap, but income-focused eligibility.
NY

Limited to NYC’s rent-regulated units; high demand in urban areas.

Benefits
Rent freeze (e.g., covers increases of $50-$200+/month); tax credit for landlord

Senior Citizen Homeowners’ Exemption (SCHE)

NY SCHE

Age 65+
General NYC resident, own and live in a 1-3 family home, co-op, or condo.
Income Limits (2025) $58,399/year household
Asset Limits No strict asset cap, income-driven eligibility.
NY

Applies only in NYC; excludes large apartment buildings.

Benefits
Property tax reduction (5-50%, e.g., $500-$5,000/year based on income and property value)

New York Foundation for Senior Citizens (NYFSC) Home Sharing Program

NYFSC Home Sharing

Age One participant must be 60+ (host or guest)
General NYC resident, able to share living space.
Income Limits No strict limit, but targets those needing cost relief.
Asset Limits Not applicable; focus on housing need.
NY

Primarily NYC-focused; limited slots due to demand.

Benefits
Shared housing (reduces rent/living costs by 30-50%, e.g., $500-$1,000/month savings); optional light assistance between housemates

Frequently Asked Questions about New York Congregational Nursing and Rehabilitation Center

What neighborhood is New York Congregational Nursing and Rehabilitation Center in?

New York Congregational Nursing and Rehabilitation Center is in the Little Haiti neighborhood of Brooklyn.

Is New York Congregational Nursing and Rehabilitation Center in a walkable area?

New York Congregational Nursing and Rehabilitation Center has a walk score of 95. Walker's paradise. Daily errands do not require a car, with many shops and services nearby.

What is the occupancy rate at New York Congregational Nursing and Rehabilitation Center?

New York Congregational Nursing and Rehabilitation Center's occupancy is 97%.

How many beds does New York Congregational Nursing and Rehabilitation Center have?

New York Congregational Nursing and Rehabilitation Center has 200 beds.

Are there photos of New York Congregational Nursing and Rehabilitation Center?

Yes — there are 5 photos of New York Congregational Nursing and Rehabilitation Center in the photo gallery on this page.

What is the address of New York Congregational Nursing and Rehabilitation Center?

New York Congregational Nursing and Rehabilitation Center is located at 135 Linden Blvd, Brooklyn, NY 11226.

What is the phone number of New York Congregational Nursing and Rehabilitation Center?

(718) 576-7000 will put you in contact with the team at New York Congregational Nursing and Rehabilitation Center.

Guides for Better Senior Living

Care Cost Calculator: See Prices in Your Area

Nursing Home Data Explorer

Don’t Wait Too Long: 7 Red Flag Signs Your Parent Needs Assisted Living Now

The True Cost of Assisted Living in 2025 – And How Families Are Paying For It

Understanding Senior Living Costs: Pricing Models, Discounts & Financial Assistance