Nursing Home

NHC Place at the Trace

Nursing Home

NHC Place at the Trace

8353 TN-100, Nashville, TN 37221 View map
Overview of Nhc Place at the Trace

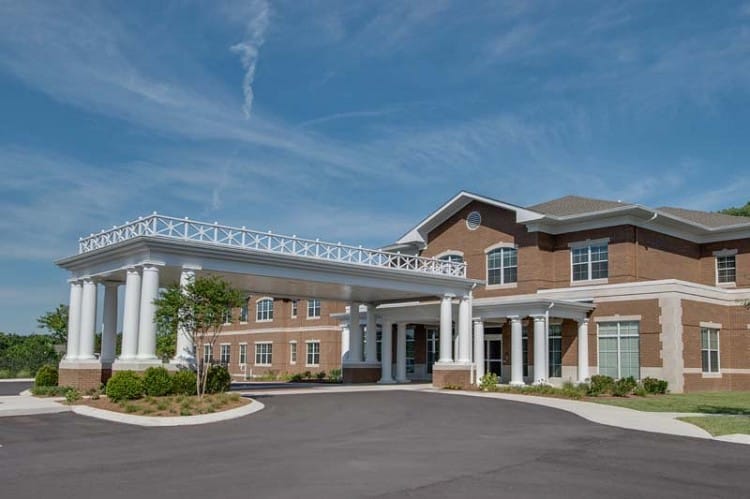
The National HealthcCare Corporation, or the Nhc Place at the Trace strives in providing short-term skilled nursing and rehablitative care; they have been awarded twice for its recognition for the ‘Customer Approved Award’ and the ‘Employee Approved Award’ by the Customers for Outstanding Experience. NHC Place at the Meadows strives in working everyday with quality service to its residents, so that residents maintain a level of independence and individuality because they aim to be a community that approaches “caring in a better way day by day”. 

(629) 888-5800

Quality ratings

Measured by Centers for Medicare & Medicaid Services (CMS)

Overall rating Info Official CMS rating based on health inspections, staffing and quality measures.
4/5
Tennessee average: 3.0/5
Health Inspection Info Official CMS rating based on deficiencies found during state health inspections.
3/5
Tennessee average: 2.9/5
Staffing Info Official CMS rating based on nurse staffing hours per resident per day.
4/5
Tennessee average: 2.4/5
Quality Measures Info Official CMS rating based on clinical outcomes for residents.
5/5
Tennessee average: 3.7/5

Nursing care per resident

Info Average daily nursing hours per resident (adjusted for acuity). Higher values indicate more nursing time per resident.
3h 58m per day

This home provides 9% more nursing time per resident than the Tennessee average.

Tennessee average: 3h 38m per day

Staffing hours breakdown

Info Hours of care per resident per day, broken down by staff type. Data from CMS Medicare.
Staff type Facility State avg National avg
Registered Nurse (RN) Info Registered nurse hours per resident per day. 1h 11m per day 25m per day 29m per day

Capacity and availability

Smaller home

May offer a more intimate, personalized care environment.

Total beds 99

This home usually has availability

Lower occupancy suggests more openings may be available.

Lower demand than the Tennessee average
Occupancy rate 83.2%
Residents per day (avg) 86
Occupancy rate
83.2%
Residents per day (avg)
86

Who this home usually serves

TYPE OF STAY

Mostly short-term rehab stays

Most residents typically stay for a few weeks or months before returning home or moving on.

Might be optimal for
Short stays Recovery Medicare-covered care

Breakdown by payment type

Medicare

60% of new residents, usually for short-term rehab.

Typical stay 28 days

Private pay

40% of new residents, often for short stays.

Typical stay 3 - 4 months

Finances and operations

Privately-owned community
Operated by a business corporation.
Home revenue
$14.2M
Operating loss
-$50.9K
Privately-owned community Operated by a business corporation.
Home revenue
$14,177,773.00
Operating loss
$-50,944.00
Payroll costs Info The portion of the home's budget spent on staff, including nurses, caregivers, and other employees who support care and operations.
$6.5M
45.7% of revenue
Other operating costs Info All remaining costs needed to run the home, such as food, utilities, building maintenance, supplies and administrative expenses.
$7.8M
Total costs $14.2M
Bed community size
99-bed community
A larger shared setting that may offer more common spaces and organized community services.
Walk Score
Walk Score: 22 / 100
Car-dependent. Most errands require a car, with limited nearby walkable options.

About this community

Occupancy

Occupancy rate
83%
16% higher than Tennessee average

Tennessee average: 72%

Occupied beds
82 / 99
Average residents 82 per day

License details

Facility type
Assisted Care Living Facility
Status Withdrew Appl

Additional licensing details

CMS Certification Number: 445525

Ownership & operating entity

NHC Place at the Trace is legally operated by HEALTH CENTER OF NASHVILLE LLC, and administrated by Pending.

Care Services

Nursing Services
Rehabilitation Services
Memory Care
Independent Living
Skilled Nursing
Licensed Nurses/CNAs

All Levels of Care

Assisted Living
Memory Care
Skilled Nursing

Amenities & Lifestyle

restaurant-style dining rooms
landscaped courtyards
recreational amenities

Programs & Activities

Specific Programs
Health Center, Assisted Living, Memory Care, Caris Hospice, HomeCare
Contact NHC Place at the Trace

Health Inspection History

Inspections
Total health inspections 3

Tennessee average 3.5


Last Health inspection on Feb 2025

Total health citations 14
Citations per inspection
4.67

Health citations are formal notices following inspections when they fail to comply with safety and care standards.

All 14 citations resulted from standard inspections.

Breakdown of citation severity (last 3 years)
Critical Health citations More info 0
100% better than Tennessee average

Tennessee average: 1.1


Serious Health citations More info 0
100% better than Tennessee average

Tennessee average: 0.6

0 critical citations More info Tennessee average: 1.1

0 serious citations More info Tennessee average: 0.6

14 moderate citations More info Tennessee average: 13.7

0 minor citations More info Tennessee average: 0.1
Citations history (last 3 years)
Infection Control moderate citation Feb 12, 2025
Corrected

Nutrition moderate citation Feb 12, 2025
Corrected

Pharmacy moderate citation Feb 12, 2025
Corrected

Pharmacy moderate citation Feb 12, 2025
Corrected

Compare Nursing Homes around Nashville

The information below is reported by the Tennessee Department of Health, Division of Health Care Facilities.
NHC Place at the Trace
SNF

Nursing Home 24/7 care needed

AL

Assisted Living For seniors needing help with daily tasks but not full-time nursing.

Nashville (Bellevue)
90
22
HEALTH CENTER OF NASHVILLE LLC
83.2%
$14,122,771.00
$6,472,616.00
45.8%
86
4/5
3.9661
3/5
4/5
5/5
14
-
+40%
+9%
+14%
Bethany Center for Rehabilitation and Healing
SNF

Nursing Home 24/7 care needed

AL

Assisted Living For seniors needing help with daily tasks but not full-time nursing.

Nashville (Townhomes of Shadow Glen)
180
69
BETHANY VENTURES TN LLC
93.7%
$18,109,976.00
$10,476,270.00
57.8%
160.40
2/5
2.8210
2/5
1/5
5/5
12
2
-53%
-22%
+28%
AHC Cumberland
SNF

Nursing Home 24/7 care needed

AL

Assisted Living For seniors needing help with daily tasks but not full-time nursing.

Nashville (Bordeaux)
-
9
-
-
-
-
-
-
-
-
-
-
-
-
-
-
-
-
AHC of Nashville
SNF

Nursing Home 24/7 care needed

AL

Assisted Living For seniors needing help with daily tasks but not full-time nursing.

TN 37203
49
-
-
318.5%
$10,332,267.00
$3,761,703.00
36.4%
-
-
-
-
-
-
-
-
-49%
-
+336%
Green Hills Center for Rehabilitation
SNF

Nursing Home 24/7 care needed

AL

Assisted Living For seniors needing help with daily tasks but not full-time nursing.

-
-
72
-
-
-
-
-
-
-
-
-
-
-
-
-
-
-
-

Places of interest near NHC Place at the Trace

Address 13.6 miles from city center — 9.35 miles to nearest hospital (Nashville Psychotherapy)

Address 8353 TN-100, Nashville, TN 37221

Calculate Travel Distance to NHC Place at the Trace

Add your location

Address

Staffing Data

Source: CMS Payroll-Based Journal (Q2 2025)

188
Total Staff
184
Employees
4
Contractors
44,851
Total Hours (Quarter)
58
Avg Staff/Day
8.5
Avg Shift (hrs)
Nursing Staff Breakdown
Role Count Avg Shift (hrs) Uses Contractors?
Registered Nurse239.5 No
Licensed Practical Nurse269 No
Certified Nursing Assistant669.3 No
Staff by Category
Administration
3 staff
7.2hs shift avg
Nursing Staff
123 staff
9.2hs shift avg
Physicians & Practitioners
5 staff
7.9hs shift avg
Therapy Services
42 staff
7.1hs shift avg
Activities & Recreation
2 staff
7.5hs shift avg
Social Services
3 staff
6.5hs shift avg
Dietary Services
6 staff
7.6hs shift avg
Other Services
4 staff
8.2hs shift avg
Contractor Analysis
0.1%
of total hours from contractors
26 contractor hours this quarter
Qualified Activities Professional: 1 Medical Director: 2 Occupational Therapy Assistant: 1
Role Employees Contractors Total Staff Total Hours Days Worked % of Days Avg Shift (hrs)
Certified Nursing Assistant6606614,56891100%9.3
Registered Nurse230238,21191100%9.5
Licensed Practical Nurse260267,76591100%9
Physical Therapy Assistant9092,1968189%7.4
Speech Language Pathologist7071,8857684%7.4
Nurse Aide in Training8081,5478593%7.6
Mental Health Service Worker3031,5407279%8.1
Respiratory Therapy Technician9091,2938290%7.2
Other Dietary Services Staff4049376875%7.4
Physical Therapy Aide9099257886%6.9
Qualified Social Worker3036226673%6.5
Administrator1014926268%7.9
Dental Services Staff1014905763%8.6
Clinical Nurse Specialist4044895763%7.7
Occupational Therapy Aide6064857380%5.2
Nurse Practitioner1014645864%8
Dietitian2024405560%8
Respiratory Therapist1014065257%7.8
Qualified Activities Professional112821112%7.5
Occupational Therapy Assistant0111533%5
Medical Director022133%0.2

Facility Characteristics

Source: CMS Long-Term Care Facility Characteristics (Data as of Jan 2026)

Total census
83 residents
Residents by payment source
Medicare
26 residents (31.3%)
Private pay or other
57 residents (68.7%)
Programs & Services
Residents' Group

Residents meet regularly to discuss policies, care quality, and activities

Nurse Aide Training

State-approved Nurse Aide Training and Competency Evaluation Program on-site

Active Resident Council

Organized group of residents that meets regularly to discuss facility policies, quality of life, and activities.

Quality of care over time

These measures show how residents usually do over time at this home, based on health outcomes and preventive care.

High-risk clinical events score Info A composite score based on pressure ulcers, falls with injury, weight loss, walking ability decline, and activities of daily living decline. 11.9
13% worse than Tennessee average

Tennessee average: 10.5

Functional decline score Info A composite score based on activities of daily living decline, walking ability decline, and incontinence. 22.7
16% worse than Tennessee average

Tennessee average: 19.5

Long-stay resident measures
Significantly above average Tennessee avg: 3.9 Info CMS star rating based on long-stay quality measure performance. 5 stars = significantly above average, 1 star = significantly below average.
Need for Help with Daily Activities Increased Info Percent of long-stay residents whose need for help with daily activities has increased 23.2%
45% worse than Tennessee average

Tennessee average: 16.0%

Walking Ability Worsened Info Percent of long-stay residents whose ability to move independently worsened 23.3%
7% worse than Tennessee average

Tennessee average: 21.7%

Low Risk Residents with Bowel/Bladder Incontinence Info Percent of low risk long-stay residents who lose control of their bowels or bladder 21.5%
In line with Tennessee average

Tennessee average: 20.7%

Falls with Major Injury Info Percent of long-stay residents experiencing one or more falls with major injury 0.6%
85% better than Tennessee average

Tennessee average: 3.7%

High Risk Residents with Pressure Ulcers Info Percent of long-stay high risk residents with pressure ulcers 6.0%
11% worse than Tennessee average

Tennessee average: 5.4%

Urinary Tract Infection Info Percent of long-stay residents with a urinary tract infection 2.3%
12% worse than Tennessee average

Tennessee average: 2.1%

Lost Too Much Weight Info Percent of long-stay residents who lose too much weight 6.2%
In line with Tennessee average

Tennessee average: 6.3%

Depressive Symptoms Info Percent of long-stay residents who have depressive symptoms 6.0%
45% better than Tennessee average

Tennessee average: 11.0%

Antipsychotic Use Info Percent of long-stay residents who received an antipsychotic medication 14.7%
11% better than Tennessee average

Tennessee average: 16.5%

Pneumococcal Vaccine Info Percent of long-stay residents assessed and appropriately given the pneumococcal vaccine 100.0%
11% better than Tennessee average

Tennessee average: 89.9%

Influenza Vaccine Info Percent of long-stay residents assessed and appropriately given the seasonal influenza vaccine 98.0%
In line with Tennessee average

Tennessee average: 94.5%

Hospitalizations per 1,000 days Info Number of hospitalizations per 1,000 long-stay resident days. 1.25
21% better than Tennessee average

Tennessee average: 1.58

ED visits per 1,000 days Info Number of outpatient emergency department visits per 1,000 long-stay resident days. 0.67
57% better than Tennessee average

Tennessee average: 1.57

Short-stay resident measures
Significantly above average Tennessee avg: 3.4 Info CMS star rating based on short-stay quality measure performance. 5 stars = much above average, 1 star = much below average.
Pneumococcal Vaccine Info Percent of short-stay residents assessed and appropriately given the pneumococcal vaccine 96.4%
21% better than Tennessee average

Tennessee average: 79.7%

Antipsychotic medication increase Info Percent of short-stay residents who newly received an antipsychotic medication 2.0%
15% worse than Tennessee average

Tennessee average: 1.7%

Influenza Vaccine Info Percent of short-stay residents assessed and appropriately given the seasonal influenza vaccine 94.3%
18% better than Tennessee average

Tennessee average: 79.8%

Re-hospitalized after SNF stay Info Percentage of short-stay residents who were re-hospitalized after their nursing home admission. 21.8%
In line with Tennessee average

Tennessee average: 22.2%

Emergency department visits Info Percentage of short-stay residents who had an outpatient emergency department visit. 7.3%
35% better than Tennessee average

Tennessee average: 11.2%

Falls with major injury Info Percentage of SNF residents who experience falls with major injury during their stay. 0.7%
6% better than Tennessee average

Tennessee average: 0.8%

Ability to care for self at discharge Info Percentage of residents at or above expected ability to care for themselves at discharge. 62.5%
16% better than Tennessee average

Tennessee average: 53.7%

Successful return to home or community Info Rate of successful return to home or community from a skilled nursing facility. 68.4%
35% better than Tennessee average

Tennessee average: 50.6%

Guides for Better Senior Living

Care Cost Calculator: See Prices in Your Area

Nursing Home Data Explorer

Don’t Wait Too Long: 7 Red Flag Signs Your Parent Needs Assisted Living Now

The True Cost of Assisted Living in 2025 – And How Families Are Paying For It

Understanding Senior Living Costs: Pricing Models, Discounts & Financial Assistance

Financial Aid for Tennessee Seniors

Get financial aid guidance

CHOICES Program

TN Medicaid CHOICES

Age 65+ or disabled, Tennessee resident, Medicaid-eligible, nursing home-level care need.

~$2,829/month (300% FBR, individual).

$2,000 (individual), $3,000 (couple).

Managed care model; high rural demand.

Tennessee Options for Community Living

TN Options

Age 60+, Tennessee resident, at risk of nursing home.

~$2,000/month (individual, varies).

$5,000 (individual).

Limited funding; rural/urban balance.

Medicare Savings Program (MSP)

Tennessee Medicare Savings Program

Age 65+ or disabled, TN resident, Medicare Part A/B.

~$2,510/month (QMB), ~$3,380/month (SLMB), ~$3,598/month (QI)—individual.

$9,430 (individual), $14,130 (couple).

Three tiers; includes Extra Help for Part D; no waitlist.

Low-Income Home Energy Assistance Program (LIHEAP)

Tennessee LIHEAP

Age 60+ prioritized, TN resident, low-income household.

~$3,970/month (individual, 185% FPL).

Not assessed; income-focused.

Covers gas, electric, propane; emergency aid available.

Family Caregiver Support Program (FCSP)

Tennessee Family Caregiver Support Program

Caregivers of 60+ needing care or 55+ caregivers of others; TN resident; functional needs (2+ ADLs).

No strict cap; prioritizes low-income (~$24,980/year).

Not assessed; need-based.

Includes grandparent caregivers; high rural demand.

Senior Community Service Employment Program (SCSEP)

Tennessee SCSEP

Age 55+, unemployed, low-income, TN resident.

~$1,983/month (125% FPL).

Not specified; income-focused.

Priority for veterans, rural residents; AARP/Goodwill partnership.

VA Aid and Attendance (A&A) and Housebound Benefits

Tennessee VA Aid and Attendance/Housebound

Age 65+ or disabled veteran/spouse, TN resident, wartime service, need for ADL help (A&A) or homebound.

Net income < ~$1,984/month (veteran with dependent, A&A); pension offsets income.

~$155,356 (net worth limit).

High veteran population; supports rural/urban care needs.

Elderly Nutrition Program

Tennessee Elderly Nutrition Program

Age 60+, TN resident; no income limit but prioritizes low-income.

None; donations encouraged.

Not assessed.

Serves ~50,000 annually; 200+ congregate sites plus Meals on Wheels.

Property Tax Relief Program

Tennessee Property Tax Relief Program

Age 65+, TN resident, homeowner/renter (or widow/er 50+, disabled 18+).

~$45,000/year (household, excludes half of Social Security).

Not assessed; income-focused.

Rebates up to $1,000; serves ~100,000 annually.

Tour Icon
Planning a tour? Check our touring checklist.
Chat Icon
Thinking of living here? We can help you speak to a current resident