Explore Open Rooms

1 Contact details
2 What type of senior care service are you looking for?
3 What budget do you have in mind for senior care?
4 How soon do you need to find care?
5 Additional details

Thank you for your interest!

Our team will be in touch shortly to help with next steps.

Nursing Home

Niles Canyon Post Acute

Nursing Home

Niles Canyon Post Acute

38650 Mission Blvd, Fremont, CA 94536 View map
Overview of Niles Canyon Post Acute

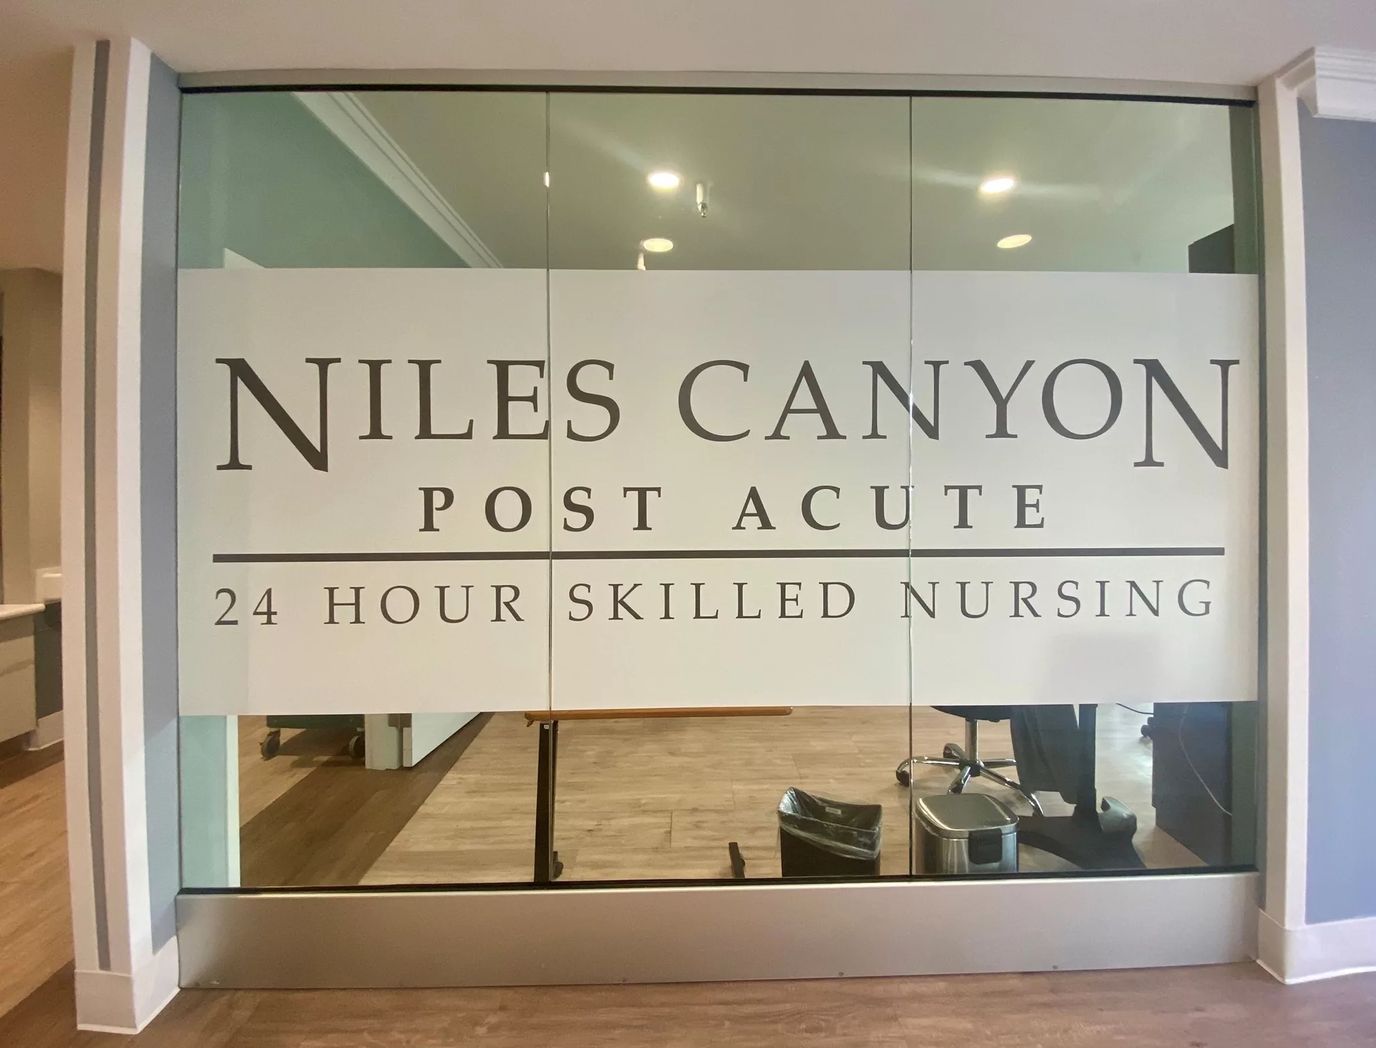
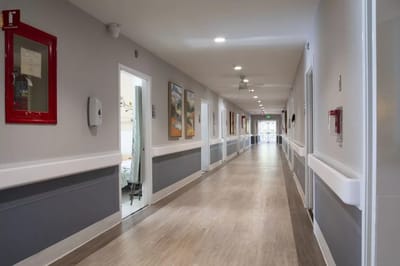
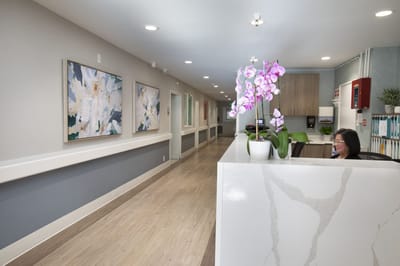
Niles Canyon, located in Fremont, CA, is a post acute care facility offering nursing, rehabilitation and post acute care services to its residents. This care facility’s nursing services aims to provide residents services that can improve their medical conditions. Each resident is also provided individual care plans, to ensure that their specific healthcare needs are met. This includes providing the residents with round the clock skilled nursing care, medication management and education, and mental health services.
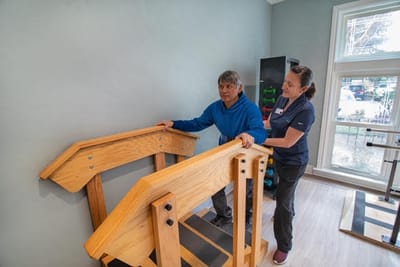
Other services they offer include wound care and infection prevention, nutrition and hydration program, and therapy services. Additionally, all the care providers are licensed and are constantly training, to ensure that the care they provide their residents keeps improving.

(510) 793-3000

Quality ratings

Measured by Centers for Medicare & Medicaid Services (CMS)

Overall rating Info The Overall CMS Rating combines results from health inspections, staffing levels and quality measures. Health inspections carry the most weight. Staffing and quality scores can increase or decrease the final rating based on performance compared to state and national standards.
5/5
California average: 3.6/5
Health Inspection Info Based on the results of the facility's three most recent standard inspections and any complaint investigations. CMS reviews the number, scope, and severity of deficiencies, with more recent findings weighted more heavily.
5/5
California average: 3.2/5
Staffing Info Measures average nursing staff hours per resident per day, including Registered Nurses (RNs) and total nursing staff. Ratings are adjusted based on the level of care residents require and are compared to state and national benchmarks.
3/5
California average: 3.5/5
Quality Measures Info Based on clinical and physical health indicators reported to CMS, such as hospital readmissions, falls, pressure ulcers, and improvements in mobility. These measures reflect how well residents' health needs are being managed.
4/5
California average: 4.3/5

Nursing care per resident

Info This shows how many total hours of nursing staff time are available per resident each day. Higher numbers usually mean more staff support.
4h 15m per day

This home provides 3% less nursing time per resident than the California average.

California average: 4h 23m per day

Staffing hours breakdown

Info Hours of care per resident per day, broken down by staff type. Data from CMS Medicare.
Staff type Facility State avg National avg
Registered Nurse (RN) Info Registered nurse hours per resident per day. 26m per day 39m per day 41m per day
Nurse Aide Info Nurse aide hours per resident per day. 2h 57m per day 2h 39m per day 2h 21m per day
Total Nursing (Weekend) Info Total number of nurse staff hours per resident per day on weekends. 4h 3m per day 4h 5m per day 3h 26m per day
Physical Therapist Info Physical therapist staff hours per resident per day. 6m per day 5m per day 4m per day
RN (Weekend) Info Registered nurse hours per resident per day on weekends. 23m per day 30m per day 29m per day

Capacity and availability

Smaller home

May offer a more intimate, personalized care environment.

Total beds 73

This home usually has availability

Lower occupancy suggests more openings may be available.

Lower demand than the California average
Occupancy rate 77.3%
Residents per day (avg) 61
Occupancy rate
77.3%
Residents per day (avg)
61

Who this home usually serves

TYPE OF STAY

Mostly short-term rehab stays

Most residents typically stay for a few weeks or months before returning home or moving on.

Might be optimal for
Short stays Recovery Medicare-covered care

Breakdown by payment type

Medicare

61% of new residents, usually for short-term rehab.

Typical stay 1 - 2 months

Private pay

4% of new residents, often for short stays.

Typical stay 8 months

Medicaid

34% of new residents, often for long-term daily care.

Typical stay 4 - 5 months

Finances and operations

Privately-owned community
Operated by a business corporation.
Home revenue
$9.4M
Profit
$1.2M
Privately-owned community Operated by a business corporation.
Home revenue
$9,396,777.00
Profit
$1,220,705.00
Payroll costs Info The portion of the home's budget spent on staff, including nurses, caregivers, and other employees who support care and operations.
$4.4M
46.8% of revenue
Other operating costs Info All remaining costs needed to run the home, such as food, utilities, building maintenance, supplies and administrative expenses.
$3.8M
Total costs $8.2M
Walk Score
Walk Score: 30 / 100
Somewhat walkable. A few nearby services may be reachable on foot, but most trips require transportation.
BBB Rating
BBB Rating: A- (Not Accredited)
An independent rating from the Better Business Bureau based on factors such as complaint history, transparency, and business practices.
How BBB ratings work

About this community

Care Services

Nursing Services
Rehabilitation Services
Licensed Nurses/CNAs
24-Hour Staffing
Short-Term Rehab

Programs & Activities

Specific Programs
Nursing Services, Rehabilitation Services, Post-Acute Care, Activities Program, Social Services

Types of Care at Niles Canyon Post Acute

Nursing Home
Contact Niles Canyon Post Acute

Inspection History

In California, the Department of Social Services (for assisted living facilities) and the Department of Public Health (for nursing homes) conduct inspections to ensure resident safety and regulatory compliance.

Health Inspection History

Inspections
Total health inspections 3

California average 12.5


Last Health inspection on Jun 2025

Total health citations 10

California average 50.2

Citations per inspection
3.33

California average 4.65


Health citations are formal notices following inspections when they fail to comply with safety and care standards.

All 10 citations resulted from standard inspections.

Breakdown of citation severity (last 3 years)
Critical Health citations More info 0
100% better than California average

California average: 0.4


Serious Health citations More info 0
100% better than California average

California average: 1

0 critical citations More info California average: 0.4

0 serious citations More info California average: 1

9 moderate citations More info California average: 47.2

1 minor citation More info California average: 1.5
Citations history (last 3 years)
Resident Rights moderate citation Info Issues related to resident's rights, including dignity, privacy, and the ability to make decisions about their care. Jun 26, 2025
Corrected

Nutrition moderate citation Info Issues related to food quality, meal service, and resident's nutritional needs. Feb 17, 2024
Corrected

Environmental moderate citation Info Issues related to building safety, cleanliness, maintenance, and overall living conditions. Apr 15, 2022
Corrected

Infection Control moderate citation Info Issues related to preventing and controlling infections, including hygiene practices and safety protocols. Apr 15, 2022
Corrected

Compare Nursing Homes around Fremont The information below is reported by the California Department of Social Services and Department of Public Health.

5 facilities compared · CMS & CA Dept. of Health data · Updated Mar 2026

Mission Valley Post Acute
AL

Assisted Living A licensed, long-term care setting for seniors or individuals with disabilities who need help with daily activities — like bathing, dressing, and medication management — but not 24-hour skilled nursing. Offers housing, meals, and around-the-clock support while aiming to maximize resident independence.

NH

Nursing Home Licensed facility providing 24/7 skilled nursing care for residents with complex, ongoing medical needs. Staffed by RNs, LPNs, and CNAs. Inspected and star-rated annually by CMS. Accepts Medicare (short-term rehab) and Medicaid (long-term care).

Fremont (Centerville)
85
85.3%
+1%
3.63
-16%
-14%
0
22
0
81
A-
72
Bills, Kelly
$15,2M
$4,7M
30.8%
55276
Niles Canyon Post Acute
NH

Nursing Home Licensed facility providing 24/7 skilled nursing care for residents with complex, ongoing medical needs. Staffed by RNs, LPNs, and CNAs. Inspected and star-rated annually by CMS. Accepts Medicare (short-term rehab) and Medicaid (long-term care).

Fremont (Canyon Heights - Vallejo Mills)
73
77.3%
-9%
4.24
-63%
+1%
2
10
0
61
A-
30
-
$9,3M
$4,4M
47.5%
55562
Windsor Country Drive Care Center
AL

Assisted Living A licensed, long-term care setting for seniors or individuals with disabilities who need help with daily activities — like bathing, dressing, and medication management — but not 24-hour skilled nursing. Offers housing, meals, and around-the-clock support while aiming to maximize resident independence.

NH

Nursing Home Licensed facility providing 24/7 skilled nursing care for residents with complex, ongoing medical needs. Staffed by RNs, LPNs, and CNAs. Inspected and star-rated annually by CMS. Accepts Medicare (short-term rehab) and Medicaid (long-term care).

Fremont (Centerville)
126
83.8%
-1%
3.81
+4%
-10%
0
33
1
109
C+
79
-
$22,7M
$8,2M
36.1%
55885
Fremont Healthcare Center
AL

Assisted Living A licensed, long-term care setting for seniors or individuals with disabilities who need help with daily activities — like bathing, dressing, and medication management — but not 24-hour skilled nursing. Offers housing, meals, and around-the-clock support while aiming to maximize resident independence.

NH

Nursing Home Licensed facility providing 24/7 skilled nursing care for residents with complex, ongoing medical needs. Staffed by RNs, LPNs, and CNAs. Inspected and star-rated annually by CMS. Accepts Medicare (short-term rehab) and Medicaid (long-term care).

Fremont (Sundale)
115
90.7%
+7%
4.14
+49%
-2%
1
22
0
103
A+
78
Fremont Holding Company Gp Llc
$21,0M
$7,1M
33.8%
56422
Park Central Care & Rehabilitation Center
NH

Nursing Home Licensed facility providing 24/7 skilled nursing care for residents with complex, ongoing medical needs. Staffed by RNs, LPNs, and CNAs. Inspected and star-rated annually by CMS. Accepts Medicare (short-term rehab) and Medicaid (long-term care).

Fremont (Centerville)
99
58.5%
-31%
4.42
-35%
+5%
0
20
1
81
A+
75
Thekkek, Antony
$8,2M
$5,5M
66.7%
56298

Places of interest near Niles Canyon Post Acute

Address 2.8 miles from city center — 1.61 miles to nearest hospital (Neurology: Fremont Center: Palo Alto Medical Foundation)

Address 38650 Mission Blvd, Fremont, CA 94536

Calculate Travel Distance to Niles Canyon Post Acute

Add your location

Address

Staffing Data (Q2 2025)

This data corresponds to Q2 2025 and is based on CMS Payroll-Based Journal.

Total staff 94
Employees 72
Contractors 22
Staff to resident ratio 1.65:1
1649023% better than California average

California average ratio: 0.00:1

Avg staff/day 42
Average shift 7.5 hours
0% compared with California average

California average: 7.7 hours

Total staff hours (quarter) 28,668
Nursing staff breakdown
Registered Nurse

Manages medical care and health needs.

Total count 3
Average shift length Info Average shift length. Calculated as total hours divided by days worked and average staff per day. 7.6 hours

No contractors work on this role.

Licensed Practical Nurse

Assists with medical care and medications.

Total count 15
Average shift length Info Average shift length. Calculated as total hours divided by days worked and average staff per day. 7.3 hours

No contractors work on this role.

Certified Nursing Assistant

Helps with daily care and mobility.

Total count 45
Average shift length Info Average shift length. Calculated as total hours divided by days worked and average staff per day. 8 hours

No contractors work on this role.

Contractor staffing

Total hours from contractors

10.1%

2,882 contractor hours this quarter

Physical Therapy Assistant: 6 Speech Language Pathologist: 5 Respiratory Therapy Technician: 4 Qualified Social Worker: 3 Physical Therapy Aide: 2 Occupational Therapy Assistant: 1 Medical Director: 1
Staff by category
Certified Nursing Assistant4504515,05091100%8
Licensed Practical Nurse150156,12291100%7.3
Registered Nurse3031,0708695%7.6
Other Dietary Services Staff2029276875%8.2
Speech Language Pathologist0559197077%6.2
Physical Therapy Aide0226027279%6.1
Physical Therapy Assistant0665707178%7
Nurse Aide in Training2025146167%8.2
Nurse Practitioner1015126470%8
RN Director of Nursing1015126470%8
Clinical Nurse Specialist1014725965%8
Administrator1014645864%8
Respiratory Therapy Technician0444507077%6.2
Qualified Social Worker0331464549%3.2
Occupational Therapy Aide1011422426%5.9
Medical Director0111302629%5
Occupational Therapy Assistant011661415%4.7
45 Certified Nursing Assistant
% of Days 100%
15 Licensed Practical Nurse
% of Days 100%
3 Registered Nurse
% of Days 95%
2 Other Dietary Services Staff
% of Days 75%
5 Speech Language Pathologist
% of Days 77%
2 Physical Therapy Aide
% of Days 79%
6 Physical Therapy Assistant
% of Days 78%
2 Nurse Aide in Training
% of Days 67%
1 Nurse Practitioner
% of Days 70%
1 RN Director of Nursing
% of Days 70%
1 Clinical Nurse Specialist
% of Days 65%
1 Administrator
% of Days 64%
4 Respiratory Therapy Technician
% of Days 77%
3 Qualified Social Worker
% of Days 49%
1 Occupational Therapy Aide
% of Days 26%
1 Medical Director
% of Days 29%
1 Occupational Therapy Assistant
% of Days 15%

Facility Characteristics

Source: CMS Long-Term Care Facility Characteristics (Data as of Jan 2026)

Total census
57 residents
Residents by payment source
Medicare
13 residents (22.8%)
Medicaid
34 residents (59.6%)
Private pay or other
10 residents (17.5%)
Programs & Services
Residents' Group

Residents meet regularly to discuss policies, care quality, and activities

Active Resident Council

Organized group of residents that meets regularly to discuss facility policies, quality of life, and activities.

Quality of care over time

These measures show how residents usually do over time at this home, based on health outcomes and preventive care.

High-risk clinical events score Info A composite score based on pressure ulcers, falls with injury, weight loss, walking ability decline, and activities of daily living decline. 6.0
9% better than California average

California average: 6.6

Functional decline score Info A composite score based on activities of daily living decline, walking ability decline, and incontinence. 7.6
33% better than California average

California average: 11.3

Long-stay resident measures
Above average California avg: 4.3 Info CMS star rating based on long-stay quality measure performance. 5 stars = significantly above average, 1 star = significantly below average.
Need for Help with Daily Activities Increased Info Percent of long-stay residents whose need for help with daily activities has increased 5.1%
54% better than California average

California average: 11.1%

Walking Ability Worsened Info Percent of long-stay residents whose ability to move independently worsened 12.0%
In line with California average

California average: 12.0%

Low Risk Residents with Bowel/Bladder Incontinence Info Percent of low risk long-stay residents who lose control of their bowels or bladder 5.7%
50% better than California average

California average: 11.3%

Falls with Major Injury Info Percent of long-stay residents experiencing one or more falls with major injury 1.6%
In line with California average

California average: 1.7%

High Risk Residents with Pressure Ulcers Info Percent of long-stay high risk residents with pressure ulcers 1.4%
71% better than California average

California average: 5.0%

Urinary Tract Infection Info Percent of long-stay residents with a urinary tract infection 2.2%
80% worse than California average

California average: 1.2%

Lost Too Much Weight Info Percent of long-stay residents who lose too much weight 9.9%
136% worse than California average

California average: 4.2%

Depressive Symptoms Info Percent of long-stay residents who have depressive symptoms 0.0%
100% better than California average

California average: 6.7%

Antipsychotic Use Info Percent of long-stay residents who received an antipsychotic medication 0.0%
100% better than California average

California average: 10.1%

Pneumococcal Vaccine Info Percent of long-stay residents assessed and appropriately given the pneumococcal vaccine 100.0%
In line with California average

California average: 98.5%

Influenza Vaccine Info Percent of long-stay residents assessed and appropriately given the seasonal influenza vaccine 100.0%
In line with California average

California average: 98.2%

Hospitalizations per 1,000 days Info Number of hospitalizations per 1,000 long-stay resident days. 4.12
83% worse than California average

California average: 2.25

ED visits per 1,000 days Info Number of outpatient emergency department visits per 1,000 long-stay resident days. 2.36
48% worse than California average

California average: 1.59

Short-stay resident measures
Above average California avg: 3.5 Info CMS star rating based on short-stay quality measure performance. 5 stars = much above average, 1 star = much below average.
Pneumococcal Vaccine Info Percent of short-stay residents assessed and appropriately given the pneumococcal vaccine 100.0%
6% better than California average

California average: 94.0%

Antipsychotic medication increase Info Percent of short-stay residents who newly received an antipsychotic medication 1.2%
15% better than California average

California average: 1.5%

Influenza Vaccine Info Percent of short-stay residents assessed and appropriately given the seasonal influenza vaccine 100.0%
7% better than California average

California average: 93.2%

Re-hospitalized after SNF stay Info Percentage of short-stay residents who were re-hospitalized after their nursing home admission. 29.9%
29% worse than California average

California average: 23.2%

Emergency department visits Info Percentage of short-stay residents who had an outpatient emergency department visit. 12.7%
13% worse than California average

California average: 11.2%

Falls with major injury Info Percentage of SNF residents who experience falls with major injury during their stay. 0.7%
13% better than California average

California average: 0.8%

Ability to care for self at discharge Info Percentage of residents at or above expected ability to care for themselves at discharge. 50.0%
7% worse than California average

California average: 53.7%

Successful return to home or community Info Rate of successful return to home or community from a skilled nursing facility. 64.5%
27% better than California average

California average: 50.6%

Penalties and fines

Federal penalties imposed by CMS for regulatory violations, including civil money penalties (fines) and denials of payment for new Medicare/Medicaid admissions.

Source: CMS Penalties Database (Data as of Jan 2026)

Total fines amount $6K
88% lower than California average

California average: $55K

Number of fines 2
15% fewer fines than California average

California average: 2.4

Payment Denials Info Serious action where Medicare and/or Medicaid temporarily stops payments for new residents until issues are fixed. 0
100% fewer payment denials than California average

California average: 0.5

Fines amount comparison
This facility $6K
California average $55K
Penalty History

Penalties are imposed by CMS for violations of federal nursing home regulations.

Civil Money Penalty Info Fines imposed for noncompliance, which can be assessed per day or per instance of violation. Jun 26, 2023
$2K
Civil Money Penalty Info Fines imposed for noncompliance, which can be assessed per day or per instance of violation. Jun 5, 2023
$4K

Last updated: Jan 2026

Guides for Better Senior Living

Care Cost Calculator: See Prices in Your Area

Nursing Home Data Explorer

Don’t Wait Too Long: 7 Red Flag Signs Your Parent Needs Assisted Living Now

The True Cost of Assisted Living in 2025 – And How Families Are Paying For It

Understanding Senior Living Costs: Pricing Models, Discounts & Financial Assistance

Financial Aid for California Seniors

Get financial aid guidance

Multipurpose Senior Services Program

MSSP (Medi-Cal Waiver)

Age 65+, California resident, Medi-Cal eligible, nursing home risk.

~$2,829/month (300% FBR, individual).

$2,000 (individual), $3,000 (couple).

County-managed; waitlists possible.

In-Home Supportive Services (IHSS)

California IHSS

Age 65+, California resident, Medicaid-eligible or low-income.

~$1,732/month (individual, Medi-Cal threshold).

$2,000 (individual).

Can hire family as caregivers.

Multipurpose Senior Services Program (MSSP)

CA MSSP

Age 65+, California resident, Medi-Cal-eligible, nursing home-eligible but community-capable.

~$2,829/month (300% FBR, individual).

$2,000 (individual).

Available in 38 counties; waitlists common.

Property Tax Postponement Program (PTP)

CA PTP

Age 62+, California resident, own and live in home, 40% equity.

~$51,500/year (household, adjusted annually).

Equity-based; no strict asset cap.

Deferred taxes accrue interest (5% as of 2024); repaid upon sale/death.

Assisted Living Waiver (ALW)

CA ALW

Age 65+ or disabled, California resident, Medi-Cal-eligible, nursing home-eligible.

~$2,829/month (300% FBR, individual).

$2,000 (individual).

Available in 15 counties (e.g., LA, Sacramento); waitlists common.

California CARES Program

CA CARES

Caregivers of California residents 60+ needing help with 3+ daily activities; no caregiver age limit.

No strict limit; cost-sharing above ~$2,500/month threshold.

Not applicable; need-based.

High demand in urban areas; complements IHSS respite.

Low-Income Home Energy Assistance Program (LIHEAP)

CA LIHEAP

Age 60+ priority, California resident, low-income, utility/heating need.

~$2,510/month (200% of poverty level, individual).

Not applicable; income-focused.

High demand in inland/coastal extremes; weatherization capped at $5,000/home.

Tour Icon
Planning a tour? Check our touring checklist.
Chat Icon
Thinking of living here? We can help you speak to a current resident