Northville Manor
Nursing Home, Hospice Care, Memory Care, Nursing Care & Respite Care · Northville, MI
CMS overall rating Info CMS (the Centers for Medicare & Medicaid Services) is the federal agency that rates nursing home quality. Its Overall Rating runs from 1 to 5 stars, combining health inspections, staffing, and quality measures, with inspections weighted most heavily.

Northville Manor

Nursing Home, Hospice Care, Memory Care, Nursing Care & Respite Care · Northville, MI
CMS overall rating Info CMS (the Centers for Medicare & Medicaid Services) is the federal agency that rates nursing home quality. Its Overall Rating runs from 1 to 5 stars, combining health inspections, staffing, and quality measures, with inspections weighted most heavily.
Calculator: See prices in your area
Northville Manor accepts Medicare, Medicaid, and private pay.

Overview of Northville Manor

Northville Manor is a nursing home in Northville, MI, offering long-term care, memory care, hospice care, rehabilitation, respite care, and skilled nursing. Here, older adults have a worry-free retirement, especially with a nurturing and inviting environment. With 24-hour care, fine dining, and transportation services, residents experience a maintenance-free lifestyle. To meet residents’ unique needs and habits, personalized care plans are also provided for their recovery.

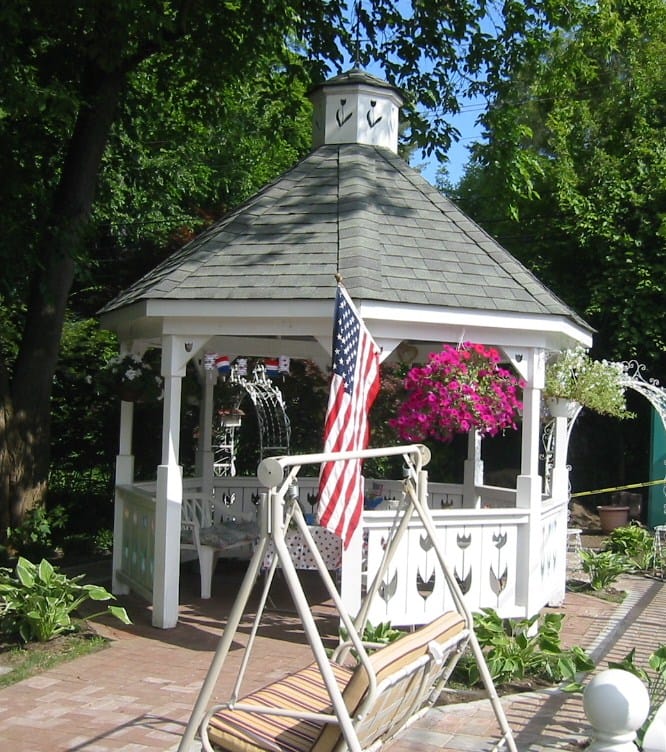
Family visits, light exercises, and various recreational opportunities help residents stay happy and encourage them to maintain holistic wellness. A bird aviary, an enclosed outdoor courtyard, and fireplaces are just some of the top-notch amenities dedicated to residents’ relaxation. Set in the tree-lined neighborhood of Northville, near restaurants, shops, churches, and schools, the community is easily accessible. As one of the trusted options for senior living in Michigan, this nursing home ensures older adults are well-cared for.

Quality ratings

Measured by Centers for Medicare & Medicaid Services (CMS)

Overall rating Info The Overall CMS Rating combines results from health inspections, staffing levels and quality measures. Health inspections carry the most weight. Staffing and quality scores can increase or decrease the final rating based on performance compared to state and national standards.
▼ 4.4% Below MI avg. ▼ 4.4% Below MI avg.MI average: 3.1Click the badge to see the full State ranking.Click here to see the full State ranking.
Health Inspection Info Based on the results of the facility's three most recent standard inspections and any complaint investigations. CMS reviews the number, scope, and severity of deficiencies, with more recent findings weighted more heavily.
▼ 29.3% Below MI avg. ▼ 29.3% Below MI avg.MI average: 2.8Click the badge to see the full State ranking.Click here to see the full State ranking.
Staffing Info Measures average nursing staff hours per resident per day, including Registered Nurses (RNs) and total nursing staff. Ratings are adjusted based on the level of care residents require and are compared to state and national benchmarks.
▲ 14.4% Above MI avg. ▲ 14.4% Above MI avg.MI average: 3.5Click the badge to see the full State ranking.Click here to see the full State ranking.
Quality Measures Info Based on clinical and physical health indicators reported to CMS, such as hospital readmissions, falls, pressure ulcers, and improvements in mobility. These measures reflect how well residents' health needs are being managed.
▲ 33.0% Above MI avg. ▲ 33.0% Above MI avg.MI average: 3.8Click the badge to see the full State ranking.Click here to see the full State ranking.

Staffing hours breakdown

Info Daily nursing hours per resident by staff type, reported to CMS. Higher is generally better — compare this facility to state and national averages to see where staffing stands.

Hours per resident per day — compared to Michigan state averages

Total nursing care / resident Info This home is ranked 108th out of 142 homes in Michigan for nurse hours. Total adjusted nursing hours per resident per day, combining RN, LPN, and aide time. CMS adjusts this for case-mix so facilities can be fairly compared.
3h 42m per day
Rank #108 / 142Nurse hours — State benchmarkedThis home is ranked 108th out of 142 homes in Michigan. Shows adjusted nurse hours per resident per day benchmarked to the Michigan average, with a ranking across 142 Michigan facilities. More hours mean more direct care. The national average is about 3.5 hrs; below 3.0 is a red flag.Rankings are based only on facilities in Michigan that report data for that category. Facilities without available data are excluded from the ranking.Click the rank badge to see the full State ranking.Click here to see the full State ranking.
This facility Michigan avg (4h 18m per day)
vs Michigan avg
-14%

4 of 6 metrics below state avg

Standout metric Weekend RN is +8% above state avg
Staff typeHours / Day / Residentvs state avg
Registered Nurse (RN) Info RNs hold the highest nursing license and can assess residents, interpret test results, and direct care plans. More RN hours per day often signals stronger clinical oversight and faster response to health changes. 48m per day ▲ 5% State avg: 46m per day · National avg: 41m per day
LPN / LVN Info Licensed Practical Nurses (LPNs) or Licensed Vocational Nurses (LVNs) deliver routine hands-on care — medication administration, wound dressing, and monitoring vital signs. They work under RN supervision and make up a large share of daily bedside care. 21m per day ▼ 60% State avg: 53m per day · National avg: 52m per day
Nurse Aide Info Certified Nurse Aides (CNAs) provide the most direct day-to-day assistance: bathing, dressing, feeding, and mobility. Nurse aide hours are typically the largest staffing category and directly affect residents' quality of life. 2h 4m per day ▼ 11% State avg: 2h 20m per day · National avg: 2h 20m per day
Weekend Total Nursing Info Combined nursing hours (RN + LPN + Nurse Aide) per resident per day on weekends. Staffing often drops on weekends — this figure reveals whether the facility maintains adequate coverage outside of weekday hours. 2h 59m per day ▼ 15% State avg: 3h 31m per day · National avg: 3h 27m per day
Physical Therapist Info Hours per resident per day provided by licensed Physical Therapists (PTs) or PT Assistants. PT services help residents recover mobility after injury or illness and are especially important for post-acute (short-stay) rehabilitation. 2m per day ▼ 43% State avg: 4m per day · National avg: 4m per day
Weekend RN Info Registered nurse hours specifically on weekends. Facilities sometimes reduce RN presence on Saturdays and Sundays — a low weekend RN figure compared to weekday hours can indicate reduced clinical oversight when most administrative staff are absent. 31m per day ▲ 8% State avg: 29m per day · National avg: 29m per day

Capacity and availability

This home usually has availability

Lower occupancy than the Michigan average: 75.8%
Occupancy rate
74.1% Rank #106 / 395Occupancy rate — State benchmarkedThis home is ranked 106th out of 395 homes in Michigan. Shows this facility's occupancy rate versus the Michigan average, with its Statewide rank out of 395. Higher occupancy signals strong local demand and financial stability.Rankings are based only on facilities in Michigan that report data for that category. Facilities without available data are excluded from the ranking.Click the rank badge to see the full State ranking.Click here to see the full State ranking.
Avg. Length of Stay
286 days
Bed community size
37-bed community Rank #308 / 435Bed count — State benchmarkedThis home is ranked 308th out of 435 homes in Michigan. Shows this facility's certified or reported bed count compared to other Michigan facilities. Larger communities may offer more amenities, programs, and on-site services for residents and families.Rankings are based only on facilities in Michigan that report data for that category. Facilities without available data are excluded from the ranking.Click the rank badge to see the full State ranking.Click here to see the full State ranking.
A moderately sized community that may balance personal attention with shared amenities and social activities.
Walk Score
Walk Score: 81 / 100 Rank #27 / 703Walk Score — State benchmarkedThis home is ranked 27th out of 703 homes in Michigan. Shows how walkable this facility's neighborhood is compared to the average Walk Score across Michigan facilities. Higher scores benefit residents, families, and staff.Rankings are based only on facilities in Michigan that report data for that category. Facilities without available data are excluded from the ranking.Click the rank badge to see the full State ranking.Click here to see the full State ranking.
Very walkable. Most errands can be accomplished on foot, and many essentials are within a short walk.

Therapy & Rehabilitation

1 service
Respite Care

Staffing & Medical

1 service
24-Hour Staffing

Amenities & Lifestyle

Activitiesdaily activities, recreation therapy, regular get-togethers at the gazebo, regular get-togethers on the veranda
Wellness ProgramPersonalized one-on-one care
Specific ProgramsAlzheimer's / Dementia care programs, daily activities/recreation therapy, pain control management, religious services
Religious Services

Contact Northville Manor

Staffing Data

Reporting period: October 1 – December 31, 2025 (Q4 2025). Source: CMS Payroll-Based Journal report.

Total staff 41
Employees 35
Contractors 6
Staff to resident ratio 1.46 : 1
14% fewer staff per resident than Michigan average
Michigan average ratio: 1.70 : 1 Michigan average ratio: 1.70 : 1See full Michigan ranking
Avg staff/day 12
Average shift 9 hours
14% better than Michigan average
Michigan average: 7.9 hours Michigan average shift: 7.9 hoursSee full Michigan ranking
Total staff hours (quarter) 9,885

Nursing staff breakdown

Q4 2025 · Oct 1 – Dec 31 More info This data comes from the CMS Payroll-Based Journal report covering October 1 – December 31, 2025.
Registered Nurse

Manages medical care and health needs.

RN Staff Info All 3 RN Staff are full-time employees. No contractors work on this role. 3
Average shift length Info Average shift length. Calculated as total hours divided by days worked and average staff per day. 12.2 hours
Licensed Practical Nurse

Assists with medical care and medications.

LPN Staff Info All 3 LPN Staff are full-time employees. No contractors work on this role. 3
Average shift length Info Average shift length. Calculated as total hours divided by days worked and average staff per day. 10.5 hours
Certified Nursing Assistant

Helps with daily care and mobility.

CNA Staff Info All 19 CNA Staff are full-time employees. No contractors work on this role. 19
Average shift length Info Average shift length. Calculated as total hours divided by days worked and average staff per day. 11.1 hours

Contractor staffing

Q4 2025 · Oct 1 – Dec 31 More info This data comes from the CMS Payroll-Based Journal report covering October 1 – December 31, 2025.

Total hours from contractors

2.8%

274 contractor hours this quarter

Physical Therapy Assistant: 1 Respiratory Therapy Technician: 1 Qualified Social Worker: 1 Speech Language Pathologist: 1 Feeding Assistant: 1 Occupational Therapy Assistant: 1

Staff by category

Q4 2025 · Oct 1 – Dec 31 More info This data comes from the CMS Payroll-Based Journal report covering October 1 – December 31, 2025.
Certified Nursing Assistant190195,41492100%11.1
Registered Nurse3031,4678795%12.2
Licensed Practical Nurse3039216874%10.5
Nurse Practitioner1014886166%8
Administrator1014005054%8
Dietitian1013725358%7
Dental Services Staff1013044145%7.4
Clinical Nurse Specialist3031453235%4.4
Physical Therapy Assistant0111275762%2.2
Respiratory Therapy Technician0111024043%2.6
Mental Health Service Worker1015889%7.3
Medical Director101241415%1.7
Feeding Assistant011241314%1.8
Occupational Therapy Aide1011833%6
Qualified Social Worker011111213%0.9
Occupational Therapy Assistant011633%2
Speech Language Pathologist011578%0.7
19 Certified Nursing Assistant
% of Days 100%
3 Registered Nurse
% of Days 95%
3 Licensed Practical Nurse
% of Days 74%
1 Nurse Practitioner
% of Days 66%
1 Administrator
% of Days 54%
1 Dietitian
% of Days 58%
1 Dental Services Staff
% of Days 45%
3 Clinical Nurse Specialist
% of Days 35%
1 Physical Therapy Assistant
% of Days 62%
1 Respiratory Therapy Technician
% of Days 43%
1 Mental Health Service Worker
% of Days 9%
1 Medical Director
% of Days 15%
1 Feeding Assistant
% of Days 14%
1 Occupational Therapy Aide
% of Days 3%
1 Qualified Social Worker
% of Days 13%
1 Occupational Therapy Assistant
% of Days 3%
1 Speech Language Pathologist
% of Days 8%

Penalties and fines

Federal penalties imposed by CMS for regulatory violations, including civil money penalties (fines) and denials of payment for new Medicare/Medicaid admissions.

Source: CMS Penalties Database (Data as of Jan 2026)

Total fines amount $8K Rank #1 / 145Federal fines — State benchmarkedThis home is ranked 1st out of 145 homes in Michigan. Shows this facility's cumulative CMS federal fine dollars versus the Michigan average among facilities with fines, and where it ranks among 145 facilities in the pool. Lower total dollars mean a better rank.Rankings are based only on facilities in Michigan that report data for that category. Facilities without available data are excluded from the ranking.Click the rank badge to see the full State ranking.Click here to see the full State ranking.
89% lower than Michigan average

Michigan average: $76K

Number of fines 1
51% fewer fines than Michigan average

Michigan average: 2.0

Payment Denials Info Serious action where Medicare and/or Medicaid temporarily stops payments for new residents until issues are fixed. 0
100% fewer payment denials than Michigan average

Michigan average: 0.8

Fines amount comparison
This facility $8K
Michigan average $76K

No penalties in the past 3 years

No civil money penalties or payment denials were reported in the last 3 years.

Quality of care over time

These measures show how residents usually do over time at this home, based on health outcomes and preventive care.

High-risk clinical events score Info A composite score based on pressure ulcers, falls with injury, weight loss, walking ability decline, and activities of daily living decline. 3.8
55% better than Michigan average

Michigan average: 8.4

Functional decline score Info A composite score based on activities of daily living decline, walking ability decline, and incontinence. 5.2
68% better than Michigan average

Michigan average: 16.3

Long-stay resident measures
Need for Help with Daily Activities Increased Info Percent of long-stay residents whose need for help with daily activities has increased 3.8%
70% better than Michigan average

Michigan average: 12.5%

Walking Ability Worsened Info Percent of long-stay residents whose ability to move independently worsened 2.7%
83% better than Michigan average

Michigan average: 15.3%

Low Risk Residents with Bowel/Bladder Incontinence Info Percent of low risk long-stay residents who lose control of their bowels or bladder 9.2%
56% better than Michigan average

Michigan average: 21.0%

Falls with Major Injury Info Percent of long-stay residents experiencing one or more falls with major injury 0.0%
100% better than Michigan average

Michigan average: 3.2%

High Risk Residents with Pressure Ulcers Info Percent of long-stay high risk residents with pressure ulcers 2.8%
52% better than Michigan average

Michigan average: 5.7%

Urinary Tract Infection Info Percent of long-stay residents with a urinary tract infection 0.0%
100% better than Michigan average

Michigan average: 1.7%

Lost Too Much Weight Info Percent of long-stay residents who lose too much weight 9.8%
72% worse than Michigan average

Michigan average: 5.7%

Depressive Symptoms Info Percent of long-stay residents who have depressive symptoms 1.5%
61% better than Michigan average

Michigan average: 3.9%

Antipsychotic Use Info Percent of long-stay residents who received an antipsychotic medication 27.6%
84% worse than Michigan average

Michigan average: 15.0%

Pneumococcal Vaccine Info Percent of long-stay residents assessed and appropriately given the pneumococcal vaccine 73.3%
23% worse than Michigan average

Michigan average: 94.9%

Influenza Vaccine Info Percent of long-stay residents assessed and appropriately given the seasonal influenza vaccine 57.7%
39% worse than Michigan average

Michigan average: 95.0%

Short-stay resident measures
Pneumococcal Vaccine Info Percent of short-stay residents assessed and appropriately given the pneumococcal vaccine 62.8%
24% worse than Michigan average

Michigan average: 82.5%

Breakdown by payment type

Medicare

8% of new residents, usually for short-term rehab.

Typical stay 6 - 7 months

Private pay

49% of new residents, often for short stays.

Typical stay 1 - 2 years

Medicaid

43% of new residents, often for long-term daily care.

Typical stay 1 - 2 months

Facility Characteristics

Source: CMS Long-Term Care Facility Characteristics (Data as of Jan 2026)

Total residents 28
Medicare
1
3.6% of residents
Medicaid
24
85.7% of residents
Private pay or other
3
10.7% of residents
Programs & Services
Residents Group

Residents meet regularly to discuss policies, care quality, and activities

Active Resident Council

Organized group of residents that meets regularly to discuss facility policies, quality of life, and activities.

Finances and operations

Based on CMS SNF Cost Report for fiscal year ending in 12/2023.

For-profit
Operated by a single business entity.
Net patient revenue Info Net patient revenue — what the home actually collects for resident care, after contractual allowances, bad debt and discounts are subtracted from its gross charges (CMS cost report, Worksheet G-3). It covers resident care only; money the home earns from other sources is shown separately as "Other income."
$2.8M
Net patient income Info Net patient income: net patient revenue minus the home's total operating expenses. A positive figure means it earns more from resident care than it spends to deliver it; a negative figure means the opposite. It excludes non-operating "other income."
-$286.6K
For-profit Operated by a single business entity.
Net patient revenue Info Net patient revenue — what the home actually collects for resident care, after contractual allowances, bad debt and discounts are subtracted from its gross charges (CMS cost report, Worksheet G-3). It covers resident care only; money the home earns from other sources is shown separately as "Other income."
$2.8M Rank #1 / 143Revenue — State benchmarkedThis home is ranked 1st out of 143 homes in Michigan. Shows this facility's annual revenue compared to the Michigan average. Higher revenue generally means more resources for staffing and capital — read alongside Payroll %.Rankings are based only on facilities in Michigan that report data for that category. Facilities without available data are excluded from the ranking.Click the rank badge to see the full State ranking.Click here to see the full State ranking.
Net patient income Info Net patient income: net patient revenue minus the home's total operating expenses. A positive figure means it earns more from resident care than it spends to deliver it; a negative figure means the opposite. It excludes non-operating "other income."
-$286.6K
Other income Info Money the home earns outside of resident care — such as investments, grants, rentals and other non-operating sources (CMS cost report, Worksheet G-3). It is tracked separately from net patient revenue: it is not part of that figure, and it is not included in net patient income.
$100.7K
Payroll costs Info Staff salaries plus wage-related costs — benefits such as payroll taxes, health insurance and retirement — from the home's own accounting records (CMS cost report, Worksheet A). Contract or agency labor is counted separately, under other operating costs. Rank #140 / 143Payroll — State benchmarkedThis home is ranked 140th out of 143 homes in Michigan. Shows total annual staff payroll benchmarked to the Michigan average. Higher payroll investment relative to peers often signals better staffing and less reliance on cheaper contract labor.Rankings are based only on facilities in Michigan that report data for that category. Facilities without available data are excluded from the ranking.Click the rank badge to see the full State ranking.Click here to see the full State ranking.
$1.5M 55.9% of net patient revenue Info Payroll as a share of revenue: staff salaries and wage-related benefits divided by net patient revenue. A higher figure means more of each revenue dollar goes to staff pay. Rank #143 / 143Payroll % — State benchmarkedThis home is ranked 143rd out of 143 homes in Michigan. Shows payroll as a percentage of revenue versus the Michigan average. Well-run Michigan facilities typically land around 49–59% — the top third Statewide. Below 25% may signal understaffing or heavy agency use — read with Staffing ratings.Rankings are based only on facilities in Michigan that report data for that category. Facilities without available data are excluded from the ranking.Click the rank badge to see the full State ranking.Click here to see the full State ranking.
Other operating costs Info Everything it costs to run the home apart from payroll — food, utilities, supplies, maintenance, contract labor and administration. Calculated as total operating expense minus payroll (staff salaries and wage-related benefits).
$1.5M
Total costs Info The home's total operating expense for the year — all the costs of running it, salaries included (CMS cost report, Worksheet G-3).
$3.0M

What does this home offer?

Housing options icon

Housing Options: Private / Semi-Private Rooms

Building type icon
Building type icon

Building Type: Single-story

Beauty services icon

Beauty Services

Transportation services icon

Transportation Services

Social and recreational activities icon

Social and Recreational Activities

Medication Management icon

Medication Management

Rehabilitative support icon

Rehabilitative Support

On-site medical care and health services icon

On-site Medical Care and Health Services

Who this home usually serves

TYPE OF STAY

Mix of rehab and long-term care

This home supports both short-term rehab and long-term care, with residents staying for a wide range of durations.

New residents most often arrive under private pay (49% of admissions), and a typical private pay stay runs around 1 - 2 years.

Admissions
35 total

Coverage residents most often arrive under.

Medicare 8%
Private pay 49%
Medicaid 43%
Discharges
35 total

Coverage residents most often leave under.

Medicare 9%
Private pay 55%
Medicaid 36%

Places of interest near Northville Manor

Address 0.3 miles from city center Info Estimated distance in miles from Northville's city center to Northville Manor's address, calculated via Google Maps.

Calculate Travel Distance to Northville Manor

Add your location

Address

Compare Nursing Homes around Northville

The information below is reported by the Michigan Department of Licensing and Regulatory Affairs (LARA).

3 facilities compared · CMS & MI Dept. of Health data

Medilodge of Haggerty Road
NH
AL
Plymouth
101
Facility 101
MI AVG 75
Rank #127 / 435
87.3%
Facility 87.3%
MI AVG 75.8%
Rank #46 / 395
+15%
4.44
Facility 4.44
MI AVG 4.30
Rank #39 / 142
-27%+3%
$15.6k
Facility $15.6k
MI AVG $87.6k
Rank #90 / 145
14
Facility 14
MI AVG 33.5
Rank #21 / 144
4.7
Facility 4.7
MI AVG 5.2
Rank #64 / 144
186-
19
Facility 19
MI AVG 39
Rank #536 / 703
-
$10.6M
Facility $10.6M
MI AVG $15.8M
Rank #69 / 143
$6.8M
Facility $6.8M
MI AVG $5.6M
Rank #66 / 143
63.9%
Facility 63.9%
MI AVG 39%
Rank #67 / 143
235351
Northville Manor
NH
HC
MC
NC
RC
Northville
37
Facility 37
MI AVG 75
Rank #308 / 435
74.1%
Facility 74.1%
MI AVG 75.8%
Rank #106 / 395
-2%
3.70
Facility 3.70
MI AVG 4.30
Rank #108 / 142
-28%-14%
$0
Facility $0
MI AVG $87.6k
Rank #1 / 145
44
Facility 44
MI AVG 33.5
Rank #99 / 144
4.4
Facility 4.4
MI AVG 5.2
Rank #55 / 144
128-
81
Facility 81
MI AVG 39
Rank #27 / 703
-
$2.8M
Facility $2.8M
MI AVG $15.8M
Rank #1 / 143
$1.5M
Facility $1.5M
MI AVG $5.6M
Rank #140 / 143
55.9%
Facility 55.9%
MI AVG 39%
Rank #143 / 143
235730
The Manor of Novi
NH
Novi
130
Facility 130
MI AVG 75
Rank #58 / 435
70.4%
Facility 70.4%
MI AVG 75.8%
Rank #118 / 395
-7%
3.96
Facility 3.96
MI AVG 4.30
Rank #69 / 142
-49%-8%
$67.5k
Facility $67.5k
MI AVG $87.6k
Rank #121 / 145
52
Facility 52
MI AVG 33.5
Rank #117 / 144
7.4
Facility 7.4
MI AVG 5.2
Rank #116 / 144
299-
59
Facility 59
MI AVG 39
Rank #137 / 703
Andrea Maggard
$14.5M
Facility $14.5M
MI AVG $15.8M
Rank #34 / 143
$7.9M
Facility $7.9M
MI AVG $5.6M
Rank #48 / 143
54.2%
Facility 54.2%
MI AVG 39%
Rank #112 / 143
235529

Financial Assistance for
Nursing Home in Michigan

Northville Manor is located in Northville, Michigan.
Here are the financial assistance programs available to residents in Michigan.

Get Financial aid guidance

MI Choice Waiver

Michigan Medicaid MI Choice Waiver

Age 65+ or disabled
General Michigan resident, Medicaid- eligible, nursing home-level care need.
Income Limits (2025) ~$2,829/month 300% FBR, individual
Asset Limits $2,000 (individual), $3,000 (couple).
MI

Delivered through regional waiver agents; waitlists possible.

Benefits
Personal care (5-7 hours/day) Respite care (240 hours/year) Home modifications ($1,500 avg.) Adult day care ($65/day)

Home Help Program

Michigan Home Help

Age 65+ or disabled
General Michigan resident, Medicaid- eligible or low-income.
Income Limits ~$1,732/month individual, Medicaid threshold
Asset Limits $2,000 individual
MI

Can hire family caregivers; less intensive than waiver.

Benefits
Personal care (up to 60 hours/month) Homemaker services Respite (varies)

Program of All-Inclusive Care for the Elderly (PACE)

Michigan PACE

Age 55+
General Michigan resident, nursing home-level care need, safe with PACE support.
Income Limits (2025) ~$2,829/month (Medicaid-eligible); private pay option available.
Asset Limits $2,000 (individual), $3,000 (couple).
MI

16 PACE centers (e.g., Ingham, Wayne counties); expanding slowly.

Benefits
Personal care (5-7 hours/day) Medical care Meals Transportation Therapy Respite

Medicare Savings Program (MSP)

Michigan Medicare Savings Program

Age 65+ or disabled
General Michigan resident, Medicare Part A/B.
Income Limits (2025) ~$2,510/month (QMB), ~$3,380/month (SLMB), ~$3,598/month (QI)—individual.
Asset Limits $9,430 (individual), $14,130 (couple).
MI

Three tiers; no waitlist; includes Extra Help for Part D.

Benefits
Covers Part B premiums ($174.70/month) Deductibles ($240/year) Copays (~20%)

National Family Caregiver Support Program (NFCSP) Respite

Michigan NFCSP Respite Care

Age
General Caregivers of 60+ needing care or 55+ caregivers of others; Michigan resident; functional needs (2+ ADLs).
Income Limits (2025) Prioritizes ~$24,980/year (individual); no strict cap.
Asset Limits Not assessed; need-based.
MI

16 AAAs; prioritizes low-income, rural caregivers.

Benefits
Respite (4-6 hours/week or 5 days/year) Adult day care ($60/day) Caregiver training

VA Aid and Attendance (A&A) and Housebound Benefits

Michigan VA Aid and Attendance/Housebound

Age 65+ or disabled veteran/spouse
General Michigan resident, wartime service, need for ADL help (A&A) or homebound.
Income Limits (2025) Net income < ~$1,984/month (veteran with dependent, A&A); pension offsets income.
Asset Limits ~$155,356 net worth limit
MI

High veteran demand in urban/rural areas.

Benefits
Cash (~$1,433-$2,642/month veteran, ~$951-$1,318 spouse) for care costs

Frequently Asked Questions about Northville Manor

Is Northville Manor in a walkable area?

Northville Manor has a walk score of 81. Very walkable. Most errands can be accomplished on foot, and many essentials are within a short walk.

What is the occupancy rate at Northville Manor?

Northville Manor's occupancy is 74.1%.

Does Northville Manor operate as a for-profit or non-profit?

Northville Manor is registered as a for-profit.

Are there photos of Northville Manor?

Yes — there are 4 photos of Northville Manor in the photo gallery on this page.

What is the address of Northville Manor?

Northville Manor is located at 520 W Main St, Northville, MI 48167.

What is the phone number of Northville Manor?

(248) 349-4290 will put you in contact with the team at Northville Manor.

Is Northville Manor Medicare or Medicaid certified?

Yes — Northville Manor is a CMS-certified provider of Medicare and Medicaid.

Guides for Better Senior Living

Care Cost Calculator: See Prices in Your Area

Nursing Home Data Explorer

Don’t Wait Too Long: 7 Red Flag Signs Your Parent Needs Assisted Living Now

The True Cost of Assisted Living in 2025 – And How Families Are Paying For It

Understanding Senior Living Costs: Pricing Models, Discounts & Financial Assistance