Oakpark Health & Rehabilitation Center
Nursing Home, Palliative Care & Respite Care · Palm Harbor, FL
CMS overall rating Info CMS (the Centers for Medicare & Medicaid Services) is the federal agency that rates nursing home quality. Its Overall Rating runs from 1 to 5 stars, combining health inspections, staffing, and quality measures, with inspections weighted most heavily.

Oakpark Health & Rehabilitation Center

Nursing Home, Palliative Care & Respite Care · Palm Harbor, FL
CMS overall rating Info CMS (the Centers for Medicare & Medicaid Services) is the federal agency that rates nursing home quality. Its Overall Rating runs from 1 to 5 stars, combining health inspections, staffing, and quality measures, with inspections weighted most heavily.
Calculator: See prices in your area
Oakpark Health & Rehabilitation Center accepts Medicare, Medicaid, and private pay.

Overview of Oakpark Health & Rehabilitation Center

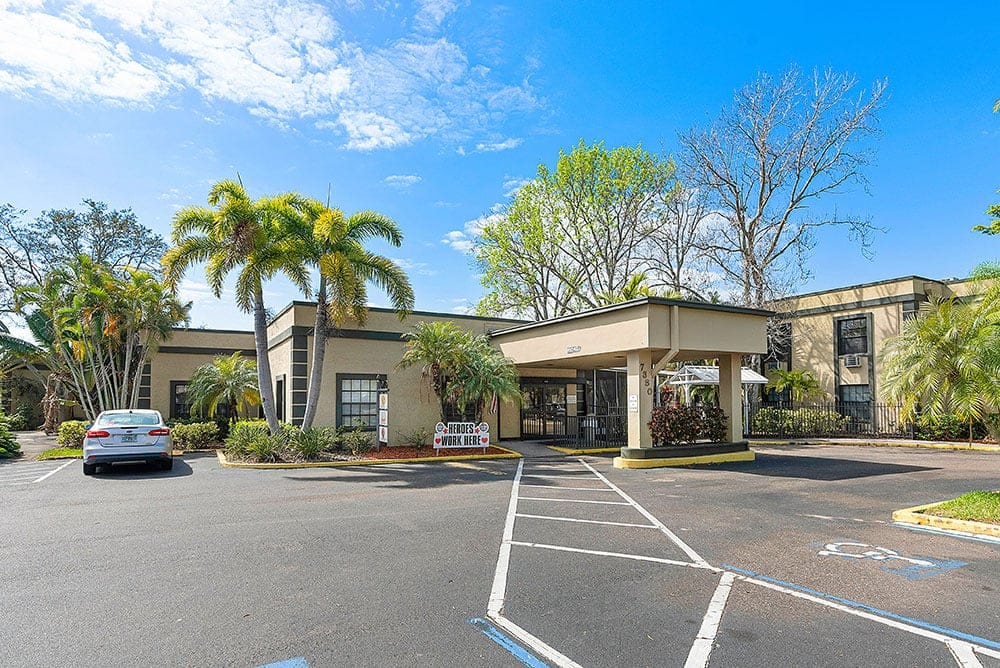
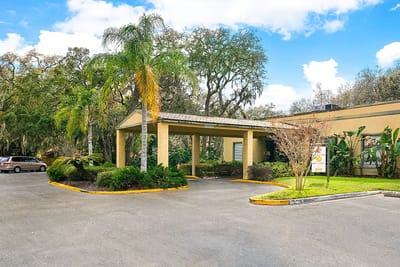
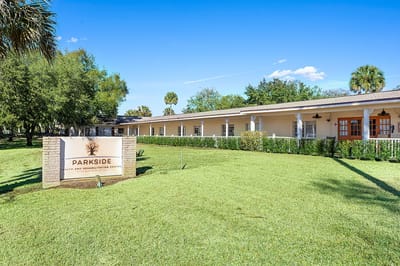
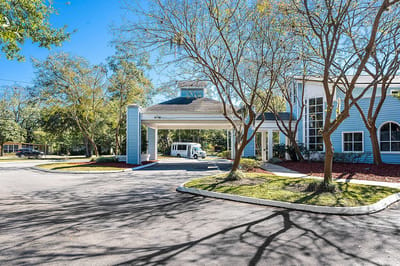
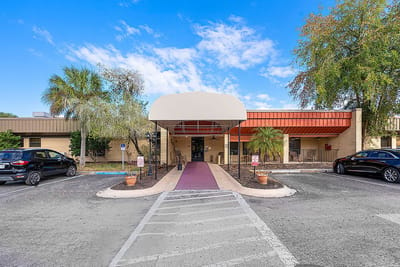
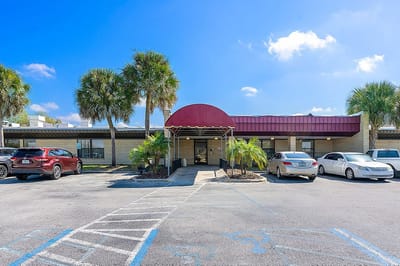
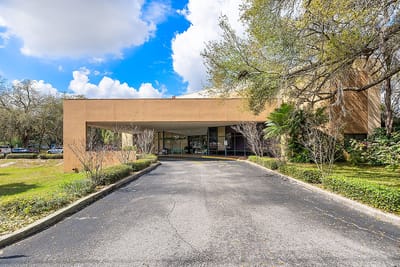
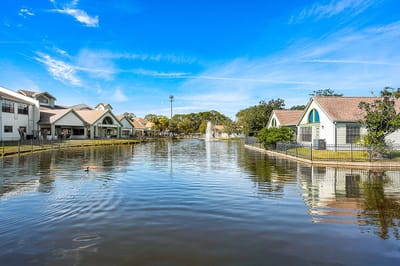
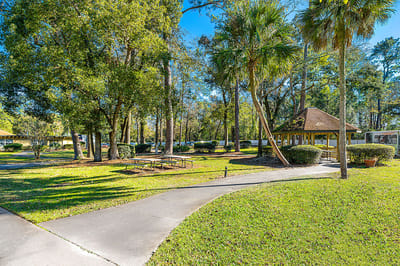
Oakpark Health & Rehabilitation Center is a nursing home in Palm Harbor, FL, offering long-term care and rehabilitation. The community also promotes a warm and home-like atmosphere dedicated to older adults’ comfort and healing. With fine dining options, 24/7 nursing care, and social services, residents experience a maintenance-free lifestyle. To help residents recover and return to their routines with ease, individualized care plans tailored to their needs and habits are also provided.

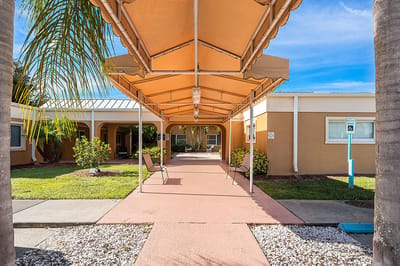
Social events, exercises, and recreational programs foster interactions and encourage residents to live actively. With private and semi-private rooms and spacious communal spaces, residents can relax and move around comfortably. Oaklake Medical, restaurants, shops, public transportation, and other healthcare providers are also located nearby, ensuring accessibility and convenience. This nursing home is committed to improving older adults’ welfare, making it one of the best choices for senior living in Florida.

Quality ratings

Measured by Centers for Medicare & Medicaid Services (CMS)

Overall rating Info The Overall CMS Rating combines results from health inspections, staffing levels and quality measures. Health inspections carry the most weight. Staffing and quality scores can increase or decrease the final rating based on performance compared to state and national standards.
▼ 5.5% Below FL avg. ▼ 5.5% Below FL avg.FL average: 3.2Click the badge to see the full State ranking.Click here to see the full State ranking.
Health Inspection Info Based on the results of the facility's three most recent standard inspections and any complaint investigations. CMS reviews the number, scope, and severity of deficiencies, with more recent findings weighted more heavily.
▼ 28.9% Below FL avg. ▼ 28.9% Below FL avg.FL average: 2.8Click the badge to see the full State ranking.Click here to see the full State ranking.
Staffing Info Measures average nursing staff hours per resident per day, including Registered Nurses (RNs) and total nursing staff. Ratings are adjusted based on the level of care residents require and are compared to state and national benchmarks.
▼ 40.9% Below FL avg. ▼ 40.9% Below FL avg.FL average: 3.4Click the badge to see the full State ranking.Click here to see the full State ranking.
Quality Measures Info Based on clinical and physical health indicators reported to CMS, such as hospital readmissions, falls, pressure ulcers, and improvements in mobility. These measures reflect how well residents' health needs are being managed.
▲ 23.2% Above FL avg. ▲ 23.2% Above FL avg.FL average: 4.1Click the badge to see the full State ranking.Click here to see the full State ranking.

Staffing hours breakdown

Info Daily nursing hours per resident by staff type, reported to CMS. Higher is generally better — compare this facility to state and national averages to see where staffing stands.

Hours per resident per day — compared to Florida state averages

Total nursing care / resident Info This home is ranked 233rd out of 253 homes in Florida for nurse hours. Total adjusted nursing hours per resident per day, combining RN, LPN, and aide time. CMS adjusts this for case-mix so facilities can be fairly compared.
3h 21m per day
Rank #233 / 253Nurse hours — State benchmarkedThis home is ranked 233rd out of 253 homes in Florida. Shows adjusted nurse hours per resident per day benchmarked to the Florida average, with a ranking across 253 Florida facilities. More hours mean more direct care. The national average is about 3.5 hrs; below 3.0 is a red flag.Rankings are based only on facilities in Florida that report data for that category. Facilities without available data are excluded from the ranking.Click the rank badge to see the full State ranking.Click here to see the full State ranking.
This facility Florida avg (4h 2m per day)
vs Florida avg
-17%

5 of 6 metrics below state avg

Staff typeHours / Day / Residentvs state avg
Registered Nurse (RN) Info RNs hold the highest nursing license and can assess residents, interpret test results, and direct care plans. More RN hours per day often signals stronger clinical oversight and faster response to health changes. 35m per day ▼ 21% State avg: 44m per day · National avg: 41m per day
LPN / LVN Info Licensed Practical Nurses (LPNs) or Licensed Vocational Nurses (LVNs) deliver routine hands-on care — medication administration, wound dressing, and monitoring vital signs. They work under RN supervision and make up a large share of daily bedside care. 41m per day ▼ 13% State avg: 47m per day · National avg: 52m per day
Nurse Aide Info Certified Nurse Aides (CNAs) provide the most direct day-to-day assistance: bathing, dressing, feeding, and mobility. Nurse aide hours are typically the largest staffing category and directly affect residents' quality of life. 2h 2m per day ▼ 13% State avg: 2h 20m per day · National avg: 2h 20m per day
Weekend Total Nursing Info Combined nursing hours (RN + LPN + Nurse Aide) per resident per day on weekends. Staffing often drops on weekends — this figure reveals whether the facility maintains adequate coverage outside of weekday hours. 3h 6m per day ▼ 12% State avg: 3h 32m per day · National avg: 3h 27m per day
Physical Therapist Info Hours per resident per day provided by licensed Physical Therapists (PTs) or PT Assistants. PT services help residents recover mobility after injury or illness and are especially important for post-acute (short-stay) rehabilitation. 6m per day ■ Avg State avg: 6m per day · National avg: 4m per day
Weekend RN Info Registered nurse hours specifically on weekends. Facilities sometimes reduce RN presence on Saturdays and Sundays — a low weekend RN figure compared to weekday hours can indicate reduced clinical oversight when most administrative staff are absent. 27m per day ▼ 15% State avg: 32m per day · National avg: 29m per day

Capacity and availability

This home usually has availability

Similar occupancy to the Florida average: 84.3%
Occupancy rate
84% Rank #172 / 258Occupancy rate — State benchmarkedThis home is ranked 172nd out of 258 homes in Florida. Shows this facility's occupancy rate versus the Florida average, with its Statewide rank out of 258. Higher occupancy signals strong local demand and financial stability.Rankings are based only on facilities in Florida that report data for that category. Facilities without available data are excluded from the ranking.Click the rank badge to see the full State ranking.Click here to see the full State ranking.
Avg. Length of Stay
55 days
Bed community size
180-bed community Rank #56 / 1074Bed count — State benchmarkedThis home is ranked 56th out of 1074 homes in Florida. Shows this facility's certified or reported bed count compared to other Florida facilities. Larger communities may offer more amenities, programs, and on-site services for residents and families.Rankings are based only on facilities in Florida that report data for that category. Facilities without available data are excluded from the ranking.Click the rank badge to see the full State ranking.Click here to see the full State ranking.
A large-scale community that may provide a wide range of amenities, services, and structured programs.
Walk Score
Walk Score: 39 / 100 Rank #743 / 1486Walk Score — State benchmarkedThis home is ranked 743rd out of 1486 homes in Florida. Shows how walkable this facility's neighborhood is compared to the average Walk Score across Florida facilities. Higher scores benefit residents, families, and staff.Rankings are based only on facilities in Florida that report data for that category. Facilities without available data are excluded from the ranking.Click the rank badge to see the full State ranking.Click here to see the full State ranking.
Somewhat walkable. A few nearby services may be reachable on foot, but most trips require transportation.

About this community

License Details

CertificationsJoint Commission Accredited
AccreditationsJoint Commission

Therapy & Rehabilitation

3 services
Rehabilitation Services
Respite Care
Short-Term Rehab

Staffing & Medical

1 service
24-Hour Staffing

Amenities & Lifestyle

Garden
Wellness Program
Specific Programswound care, short-term rehabilitation, post-surgical care, pain management, physical therapy, occupational therapy, speech therapy, 24/7 nursing care, therapeutic recreation

Contact Oakpark Health & Rehabilitation Center

Staffing Data

Reporting period: October 1 – December 31, 2025 (Q4 2025). Source: CMS Payroll-Based Journal report.

Total staff 249
Employees 204
Contractors 45
Staff to resident ratio 1.68 : 1
14% more staff per resident than Florida average
Florida average ratio: 1.47 : 1 Florida average ratio: 1.47 : 1See full Florida ranking
Avg staff/day 83
Average shift 8 hours
0% compared with Florida average
Florida average: 7.9 hours Florida average shift: 7.9 hoursSee full Florida ranking
Total staff hours (quarter) 60,741

Nursing staff breakdown

Q4 2025 · Oct 1 – Dec 31 More info This data comes from the CMS Payroll-Based Journal report covering October 1 – December 31, 2025.
Registered Nurse

Manages medical care and health needs.

RN Staff Info All 33 RN Staff are full-time employees. No contractors work on this role. 33
Average shift length Info Average shift length. Calculated as total hours divided by days worked and average staff per day. 7.7 hours
Licensed Practical Nurse

Assists with medical care and medications.

LPN Staff Info 50 total: 25 full-time employees and 25 contractors. 50
Average shift length Info Average shift length. Calculated as total hours divided by days worked and average staff per day. 8 hours
Certified Nursing Assistant

Helps with daily care and mobility.

CNA Staff Info 117 total: 100 full-time employees and 17 contractors. 117
Average shift length Info Average shift length. Calculated as total hours divided by days worked and average staff per day. 8.5 hours

Contractor staffing

Q4 2025 · Oct 1 – Dec 31 More info This data comes from the CMS Payroll-Based Journal report covering October 1 – December 31, 2025.

Total hours from contractors

2%

1,218 contractor hours this quarter

Licensed Practical Nurse: 25 Certified Nursing Assistant: 17 Occupational Therapy Aide: 1 Clinical Nurse Specialist: 1 Medical Director: 1

Staff by category

Q4 2025 · Oct 1 – Dec 31 More info This data comes from the CMS Payroll-Based Journal report covering October 1 – December 31, 2025.
Certified Nursing Assistant1001711731,87992100%8.5
Licensed Practical Nurse25255010,01192100%8
Registered Nurse330337,63192100%7.7
Physical Therapy Aide5051,6258188%6.9
Respiratory Therapy Technician7071,4888693%6.9
Speech Language Pathologist8081,3217278%6.9
Dietitian3031,3168491%8
Clinical Nurse Specialist7181,0006571%7.6
Mental Health Service Worker3039917480%8.4
Physical Therapy Assistant3039598491%6.9
RN Director of Nursing2028226773%7.9
Nurse Practitioner1014425661%7.9
Qualified Social Worker5054337885%4
Administrator1014005054%8
Occupational Therapy Aide0112314448%5.3
Nurse Aide in Training1011282123%6.1
Medical Director011651314%5
117 Certified Nursing Assistant
% of Days 100%
50 Licensed Practical Nurse
% of Days 100%
33 Registered Nurse
% of Days 100%
5 Physical Therapy Aide
% of Days 88%
7 Respiratory Therapy Technician
% of Days 93%
8 Speech Language Pathologist
% of Days 78%
3 Dietitian
% of Days 91%
8 Clinical Nurse Specialist
% of Days 71%
3 Mental Health Service Worker
% of Days 80%
3 Physical Therapy Assistant
% of Days 91%
2 RN Director of Nursing
% of Days 73%
1 Nurse Practitioner
% of Days 61%
5 Qualified Social Worker
% of Days 85%
1 Administrator
% of Days 54%
1 Occupational Therapy Aide
% of Days 48%
1 Nurse Aide in Training
% of Days 23%
1 Medical Director
% of Days 14%

Penalties and fines

Federal penalties imposed by CMS for regulatory violations, including civil money penalties (fines) and denials of payment for new Medicare/Medicaid admissions.

Source: CMS Penalties Database

No penalties in the past 3 years

No civil money penalties or payment denials were reported in the last 3 years.

Quality of care over time

These measures show how residents usually do over time at this home, based on health outcomes and preventive care.

High-risk clinical events score Info A composite score based on pressure ulcers, falls with injury, weight loss, walking ability decline, and activities of daily living decline. 10.0
35% worse than Florida average

Florida average: 7.4

Functional decline score Info A composite score based on activities of daily living decline, walking ability decline, and incontinence. 17.2
39% worse than Florida average

Florida average: 12.4

Long-stay resident measures
Need for Help with Daily Activities Increased Info Percent of long-stay residents whose need for help with daily activities has increased 12.2%
16% worse than Florida average

Florida average: 10.5%

Walking Ability Worsened Info Percent of long-stay residents whose ability to move independently worsened 15.4%
19% worse than Florida average

Florida average: 12.9%

Low Risk Residents with Bowel/Bladder Incontinence Info Percent of low risk long-stay residents who lose control of their bowels or bladder 24.1%
78% worse than Florida average

Florida average: 13.5%

Falls with Major Injury Info Percent of long-stay residents experiencing one or more falls with major injury 1.5%
42% better than Florida average

Florida average: 2.6%

High Risk Residents with Pressure Ulcers Info Percent of long-stay high risk residents with pressure ulcers 7.9%
47% worse than Florida average

Florida average: 5.4%

Urinary Tract Infection Info Percent of long-stay residents with a urinary tract infection 0.0%
100% better than Florida average

Florida average: 0.9%

Lost Too Much Weight Info Percent of long-stay residents who lose too much weight 12.9%
116% worse than Florida average

Florida average: 6.0%

Depressive Symptoms Info Percent of long-stay residents who have depressive symptoms 0.0%
100% better than Florida average

Florida average: 3.3%

Antipsychotic Use Info Percent of long-stay residents who received an antipsychotic medication 3.7%
54% better than Florida average

Florida average: 8.0%

Pneumococcal Vaccine Info Percent of long-stay residents assessed and appropriately given the pneumococcal vaccine 100.0%
In line with Florida average

Florida average: 97.7%

Influenza Vaccine Info Percent of long-stay residents assessed and appropriately given the seasonal influenza vaccine 100.0%
In line with Florida average

Florida average: 99.2%

Short-stay resident measures
Pneumococcal Vaccine Info Percent of short-stay residents assessed and appropriately given the pneumococcal vaccine 99.6%
6% better than Florida average

Florida average: 94.0%

Antipsychotic medication increase Info Percent of short-stay residents who newly received an antipsychotic medication 1.5%
In line with Florida average

Florida average: 1.5%

Influenza Vaccine Info Percent of short-stay residents assessed and appropriately given the seasonal influenza vaccine 95.1%
In line with Florida average

Florida average: 94.7%

Breakdown by payment type

Medicare

32% of new residents, usually for short-term rehab.

Typical stay 13 days

Private pay

58% of new residents, often for short stays.

Typical stay 16 days

Medicaid

9% of new residents, often for long-term daily care.

Typical stay 7 - 8 months

Facility Characteristics

Source: CMS Long-Term Care Facility Characteristics (Data as of Jan 2026)

Total residents 148
Medicare
19
12.8% of residents
Medicaid
95
64.2% of residents
Private pay or other
34
23% of residents
Programs & Services
Residents Group

Residents meet regularly to discuss policies, care quality, and activities

Nurse Aide Training

State-approved Nurse Aide Training and Competency Evaluation Program on-site

Active Resident Council

Organized group of residents that meets regularly to discuss facility policies, quality of life, and activities.

Finances and operations

Based on CMS SNF Cost Report for fiscal year ending in 12/2023.

Nonprofit
Other Nonprofit
Net patient revenue Info Net patient revenue — what the home actually collects for resident care, after contractual allowances, bad debt and discounts are subtracted from its gross charges (CMS cost report, Worksheet G-3). It covers resident care only; money the home earns from other sources is shown separately as "Other income."
$11.9M
Net patient income Info Net patient income: net patient revenue minus the home's total operating expenses. A positive figure means it earns more from resident care than it spends to deliver it; a negative figure means the opposite. It excludes non-operating "other income."
-$872.6K
Nonprofit Other Nonprofit
Net patient revenue Info Net patient revenue — what the home actually collects for resident care, after contractual allowances, bad debt and discounts are subtracted from its gross charges (CMS cost report, Worksheet G-3). It covers resident care only; money the home earns from other sources is shown separately as "Other income."
$11.9M Rank #79 / 257Revenue — State benchmarkedThis home is ranked 79th out of 257 homes in Florida. Shows this facility's annual revenue compared to the Florida average. Higher revenue generally means more resources for staffing and capital — read alongside Payroll %.Rankings are based only on facilities in Florida that report data for that category. Facilities without available data are excluded from the ranking.Click the rank badge to see the full State ranking.Click here to see the full State ranking.
Net patient income Info Net patient income: net patient revenue minus the home's total operating expenses. A positive figure means it earns more from resident care than it spends to deliver it; a negative figure means the opposite. It excludes non-operating "other income."
-$872.6K
Other income Info Money the home earns outside of resident care — such as investments, grants, rentals and other non-operating sources (CMS cost report, Worksheet G-3). It is tracked separately from net patient revenue: it is not part of that figure, and it is not included in net patient income.
$480
Payroll costs Info Staff salaries plus wage-related costs — benefits such as payroll taxes, health insurance and retirement — from the home's own accounting records (CMS cost report, Worksheet A). Contract or agency labor is counted separately, under other operating costs. Rank #62 / 257Payroll — State benchmarkedThis home is ranked 62nd out of 257 homes in Florida. Shows total annual staff payroll benchmarked to the Florida average. Higher payroll investment relative to peers often signals better staffing and less reliance on cheaper contract labor.Rankings are based only on facilities in Florida that report data for that category. Facilities without available data are excluded from the ranking.Click the rank badge to see the full State ranking.Click here to see the full State ranking.
$6.2M 52% of net patient revenue Info Payroll as a share of revenue: staff salaries and wage-related benefits divided by net patient revenue. A higher figure means more of each revenue dollar goes to staff pay. Rank #132 / 257Payroll % — State benchmarkedThis home is ranked 132nd out of 257 homes in Florida. Shows payroll as a percentage of revenue versus the Florida average. Well-run Florida facilities typically land around 49–56% — the top third Statewide. Below 25% may signal understaffing or heavy agency use — read with Staffing ratings.Rankings are based only on facilities in Florida that report data for that category. Facilities without available data are excluded from the ranking.Click the rank badge to see the full State ranking.Click here to see the full State ranking.
Other operating costs Info Everything it costs to run the home apart from payroll — food, utilities, supplies, maintenance, contract labor and administration. Calculated as total operating expense minus payroll (staff salaries and wage-related benefits).
$6.6M
Total costs Info The home's total operating expense for the year — all the costs of running it, salaries included (CMS cost report, Worksheet G-3).
$12.7M

What does this home offer?

Housing options icon

Housing Options: Private / Semi-Private Rooms

Building type icon
Building type icon

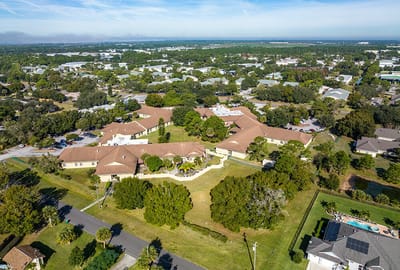
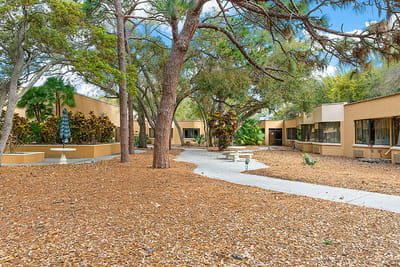
Building Type: Single-story

Social and recreational activities icon

Social and Recreational Activities

Rehabilitative support icon

Rehabilitative Support

On-site medical care and health services icon

On-site Medical Care and Health Services

Who this home usually serves

TYPE OF STAY

Mix of rehab and long-term care

This home supports both short-term rehab and long-term care, with residents staying for a wide range of durations.

Most new residents arrive under private pay (58% of admissions), and a typical private pay stay runs around 16 days.

Admissions
1,050 total

Coverage residents most often arrive under.

Medicare 32%
Private pay 58%
Medicaid 9%
Discharges
668 total

Coverage residents most often leave under.

Medicare 33%
Private pay 56%
Medicaid 11%

Places of interest near Oakpark Health & Rehabilitation Center

Address 2.9 miles from city center Info Estimated distance in miles from Palm Harbor's city center to Oakpark Health & Rehabilitation Center's address, calculated via Google Maps.

Calculate Travel Distance to Oakpark Health & Rehabilitation Center

Add your location

Address

Compare Nursing Homes around Palm Harbor

The information below is reported by the Florida Agency for Health Care Administration (AHCA).

3 facilities compared · CMS & FL Dept. of Health data

St Mark Village, Inc.
NH
AL
IL
MC
Palm Harbor (Highland Lakes)
88
Facility 88
FL AVG 89
Rank #549 / 1074
69.6%
Facility 69.6%
FL AVG 84.3%
Rank #226 / 258
-17%
4.79
Facility 4.79
FL AVG 4.04
Rank #38 / 253
-9%+19%
$0
Facility $0
FL AVG $78.9k
Rank #1 / 258
95
Facility 95
FL AVG 83
Rank #128 / 876
4
Facility 4
FL AVG 19.7
Rank #10 / 252
2.0
Facility 2.0
FL AVG 4.5
Rank #16 / 252
-49A+
40
Facility 40
FL AVG 40
Rank #725 / 1486
Jeffrey Gorddard
$24.6M
Facility $24.6M
FL AVG $15.7M
Rank #57 / 257
$13.3M
Facility $13.3M
FL AVG $6.1M
Rank #34 / 257
54.1%
Facility 54.1%
FL AVG 39.8%
Rank #71 / 257
105378
Oakpark Health & Rehabilitation Center
NH
PC
RC
Palm Harbor
180
Facility 180
FL AVG 89
Rank #56 / 1074
84.0%
Facility 84.0%
FL AVG 84.3%
Rank #172 / 258
0%
3.36
Facility 3.36
FL AVG 4.04
Rank #233 / 253
+10%-17%
$0
Facility $0
FL AVG $78.9k
Rank #1 / 258
-
11
Facility 11
FL AVG 19.7
Rank #53 / 252
3.7
Facility 3.7
FL AVG 4.5
Rank #94 / 252
-171-
39
Facility 39
FL AVG 40
Rank #743 / 1486
-
$11.9M
Facility $11.9M
FL AVG $15.7M
Rank #79 / 257
$6.2M
Facility $6.2M
FL AVG $6.1M
Rank #62 / 257
52%
Facility 52%
FL AVG 39.8%
Rank #132 / 257
105708
Orchid Cove at Palm Harbor
NH
Palm Harbor
120
Facility 120
FL AVG 89
Rank #256 / 1074
79.3%
Facility 79.3%
FL AVG 84.3%
Rank #194 / 258
-6%
3.78
Facility 3.78
FL AVG 4.04
Rank #145 / 253
-45%-6%
$0
Facility $0
FL AVG $78.9k
Rank #1 / 258
-
34
Facility 34
FL AVG 19.7
Rank #225 / 252
8.5
Facility 8.5
FL AVG 4.5
Rank #241 / 252
4109-
55
Facility 55
FL AVG 40
Rank #426 / 1486
Highlands Blvd Parent LLC
$8.9M
Facility $8.9M
FL AVG $15.7M
Rank #227 / 257
$3.8M
Facility $3.8M
FL AVG $6.1M
Rank #216 / 257
42.8%
Facility 42.8%
FL AVG 39.8%
Rank #33 / 257
105394

Financial Assistance for
Nursing Home in Florida

Oakpark Health & Rehabilitation Center is located in Palm Harbor, Florida.
Here are the financial assistance programs available to residents in Florida.

Get Financial aid guidance

Long-Term Care Waiver

Florida Medicaid LTC Waiver

Age 65+ or 21+ disabled
General Florida resident, Medicaid- eligible, nursing home-level care need.
Income Limits (2025) ~$2,829/month 300% FBR, individual
Asset Limits $2,000 (individual), $3,000 (couple).
FL

High demand; waitlists common.

Benefits
In-home care (6-8 hours/day) Assisted living Respite (240 hours/year) Case management

Community Care for the Elderly (CCE)

Florida CCE

Age 60+
General Florida resident, at risk of nursing home.
Income Limits ~$2,000/month varies
Asset Limits $5,000 individual
FL

Limited funding; regional variation.

Benefits
Homemaker services (3-5 hours/week) Adult day care (~$60/day) Respite (up to 10 days/year)

Home Care for the Elderly (HCE)

Florida Home Care for the Elderly

Age 60+
General Florida resident, at risk of nursing home placement; caregiver must be approved.
Income Limits (2025) ~$2,829/month individual, aligned with Medicaid thresholds
Asset Limits ~$2,000 (individual); varies by case manager discretion.
FL

Limited funding (~3,500 served annually); prioritizes low-income frail seniors.

Benefits
Basic subsidy (~$160/month) for housing/medical costs; special subsidies for supplies/services (e.g., incontinence supplies, ~$50-$200/month)

Program of All-Inclusive Care for the Elderly (PACE)

Florida Medicaid PACE

Age 55+
General Florida resident, nursing home-level care need, safe with PACE support.
Income Limits (2025) ~$2,829/month 300% FBR
Asset Limits $2,000 (individual), $3,000 (couple).
FL

Limited to specific counties (e.g., Hillsborough, Miami-Dade); ~10 sites statewide.

Benefits
Personal care (5-7 hours/day) Medical care Meals Transportation Therapy

Optional State Supplementation (OSS)

Florida Optional State Supplementation

Age 65+ or disabled
General Florida resident, living in approved facility, receiving SSI or low-income.
Income Limits (2025) ~$1,004/month individual, including SSI
Asset Limits $2,000 (individual), $3,000 (couple).
FL

Limited to specific facility types; ~$78.40/month max supplement.

Benefits
Cash payment (~$78.40/month) for room/board or personal needs in facilities

Frequently Asked Questions about Oakpark Health & Rehabilitation Center

Is Oakpark Health & Rehabilitation Center in a walkable area?

Oakpark Health & Rehabilitation Center has a walk score of 39. Somewhat walkable. A few nearby services may be reachable on foot, but most trips require transportation.

What is the occupancy rate at Oakpark Health & Rehabilitation Center?

Oakpark Health & Rehabilitation Center's occupancy is 84.0%.

Does Oakpark Health & Rehabilitation Center operate as a for-profit or non-profit?

Oakpark Health & Rehabilitation Center is registered as a non-profit.

Are there photos of Oakpark Health & Rehabilitation Center?

Yes — there are 15 photos of Oakpark Health & Rehabilitation Center in the photo gallery on this page.

What is the address of Oakpark Health & Rehabilitation Center?

Oakpark Health & Rehabilitation Center is located at 2851 Tampa Rd, Palm Harbor, FL 34684.

What is the phone number of Oakpark Health & Rehabilitation Center?

(727) 787-4777 will put you in contact with the team at Oakpark Health & Rehabilitation Center.

Is Oakpark Health & Rehabilitation Center Medicare or Medicaid certified?

Yes — Oakpark Health & Rehabilitation Center is a CMS-certified provider of Medicare and Medicaid.

Guides for Better Senior Living

Care Cost Calculator: See Prices in Your Area

Nursing Home Data Explorer

Don’t Wait Too Long: 7 Red Flag Signs Your Parent Needs Assisted Living Now

The True Cost of Assisted Living in 2025 – And How Families Are Paying For It

Understanding Senior Living Costs: Pricing Models, Discounts & Financial Assistance