Occupancy rate
83%
California average: 73%

We arrange tours, appointments, and even moving support so you don’t have to
Thank you for your interest!
Our team will be in touch shortly to help with next steps.

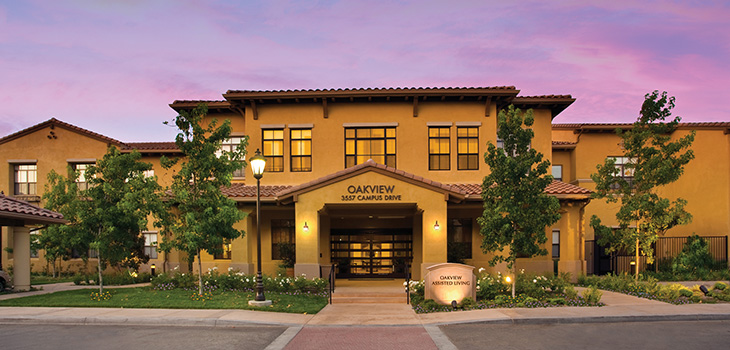
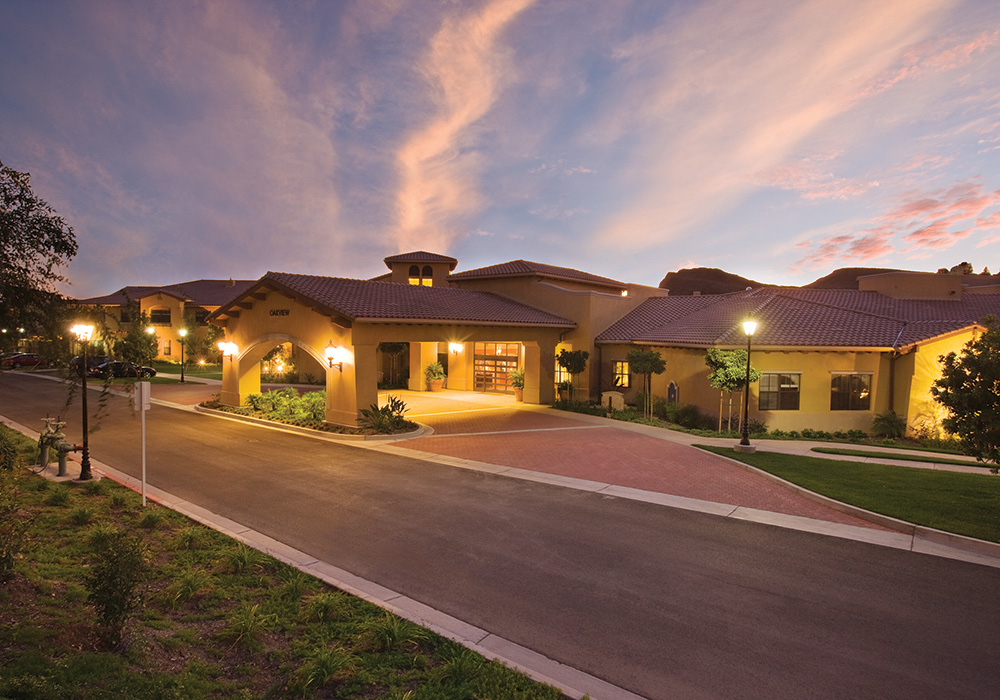
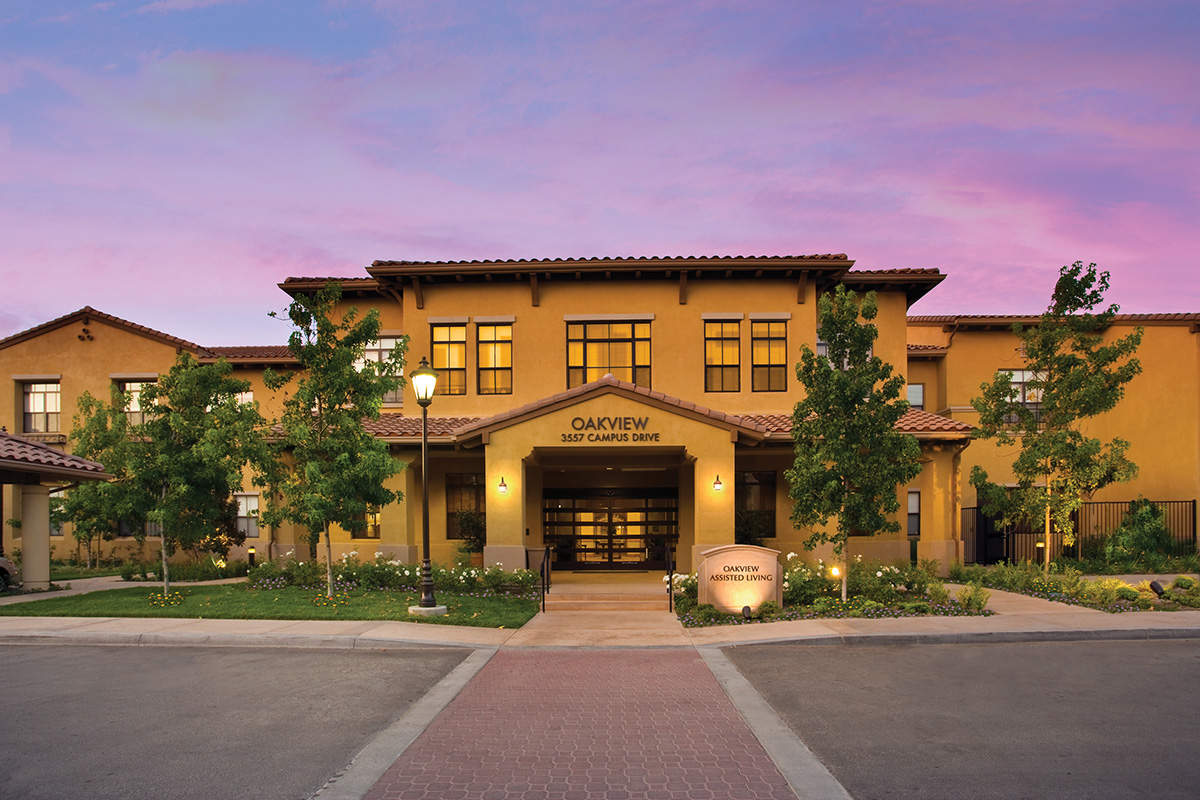


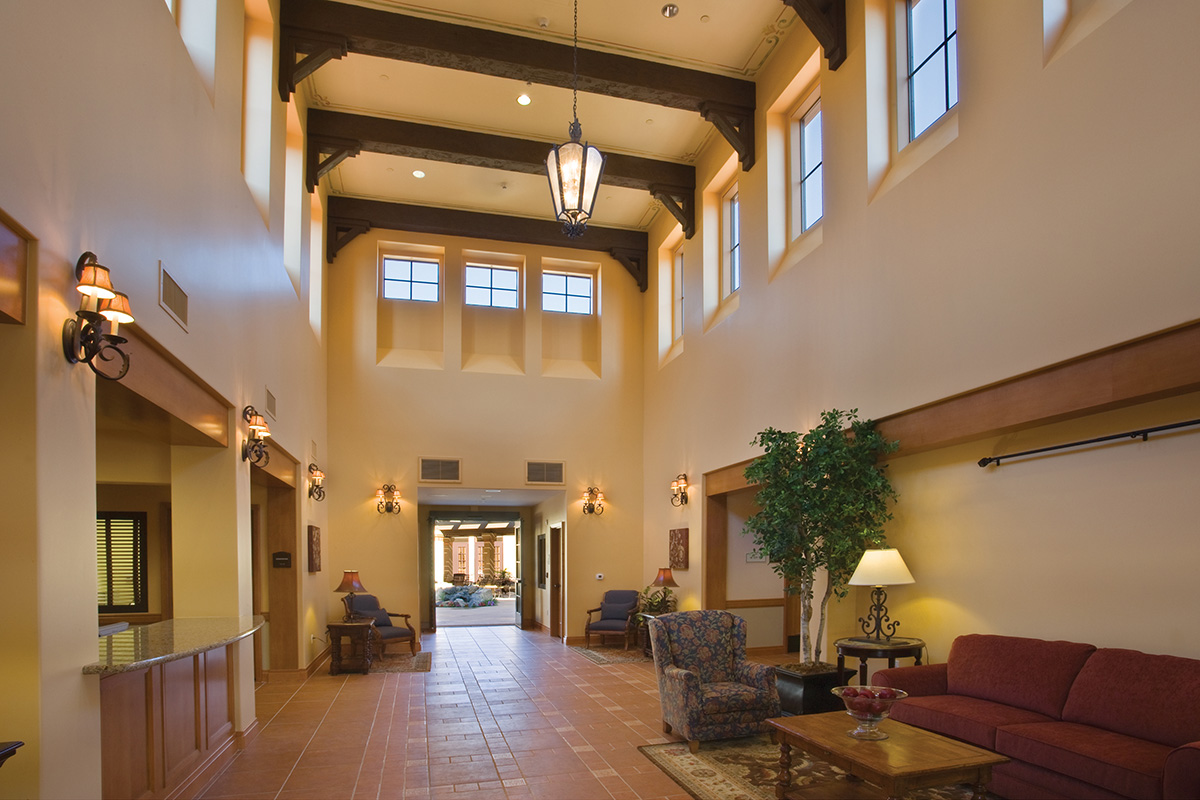
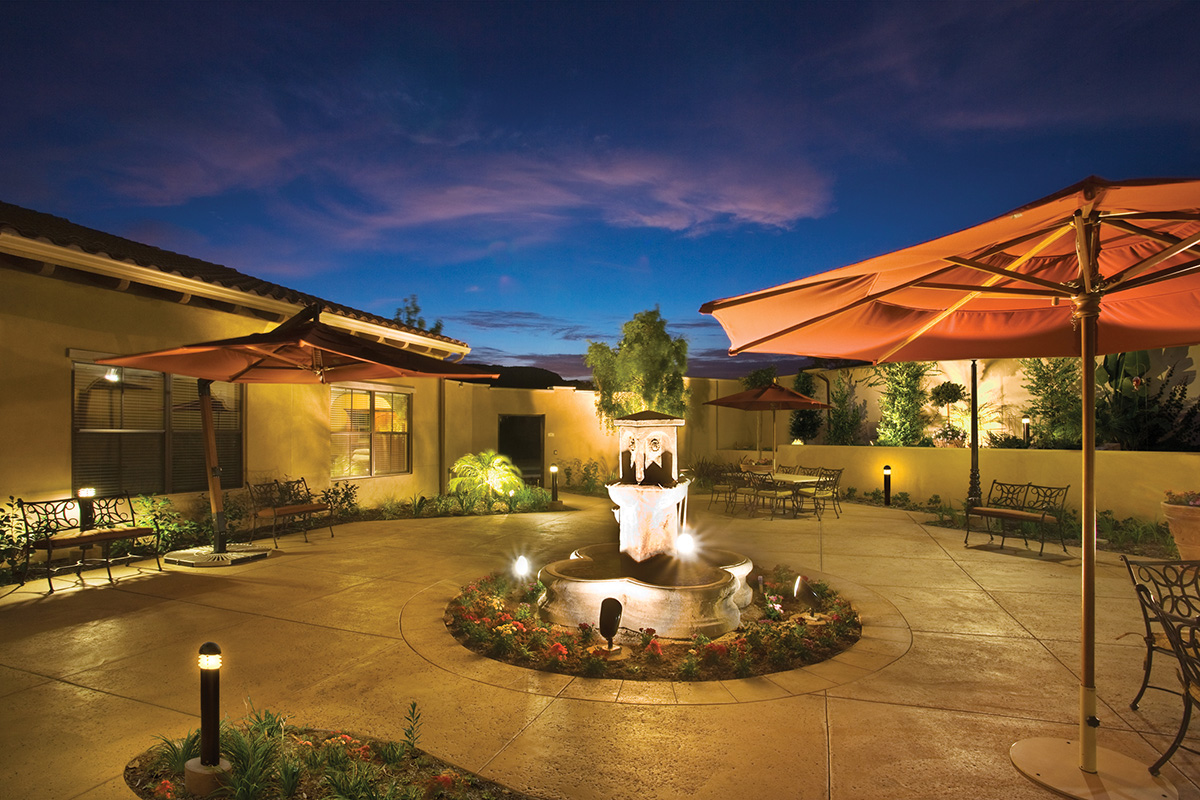

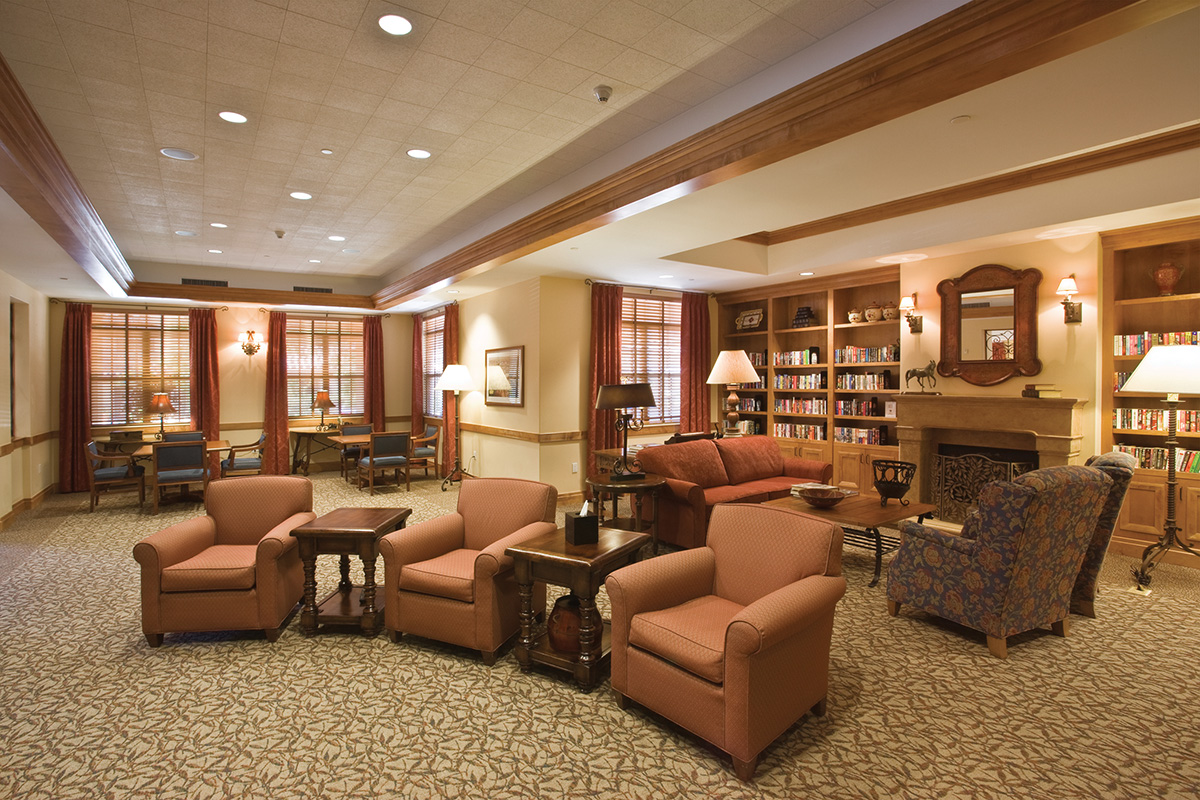


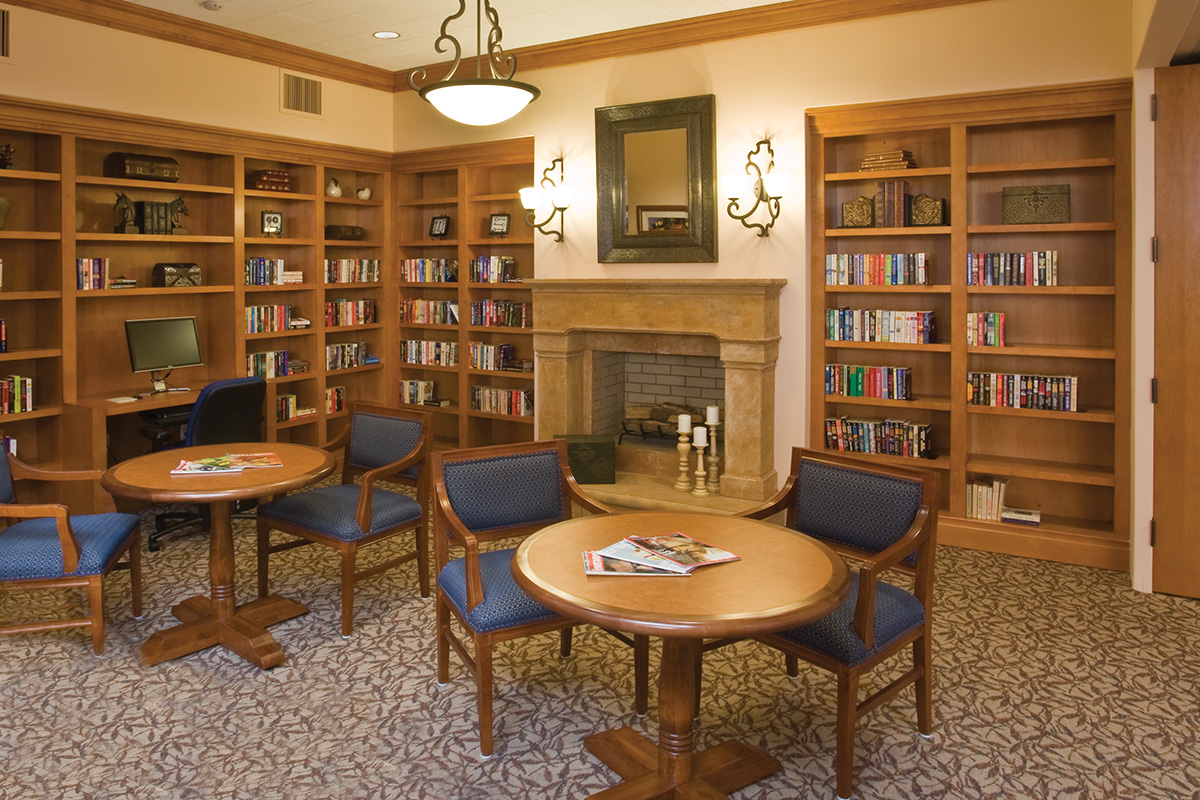


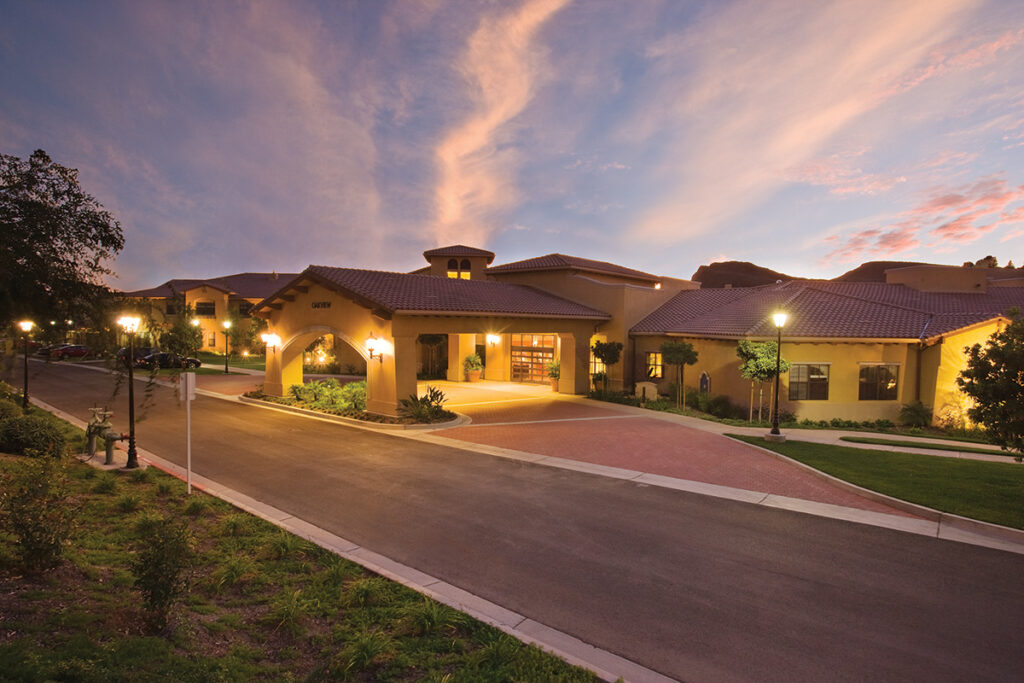
Ideally located in the beautiful setting of Thousand Oaks, CA, Oakview Health Center is a trusted community that offers assisted living, memory care, rehabilitation, and skilled nursing. A kind and highly trained team strives to provide the highest quality of care and support 24/7 for residents’ needs. With a cozy and nurturing environment, residents ease their worries and feel a sense of belonging.
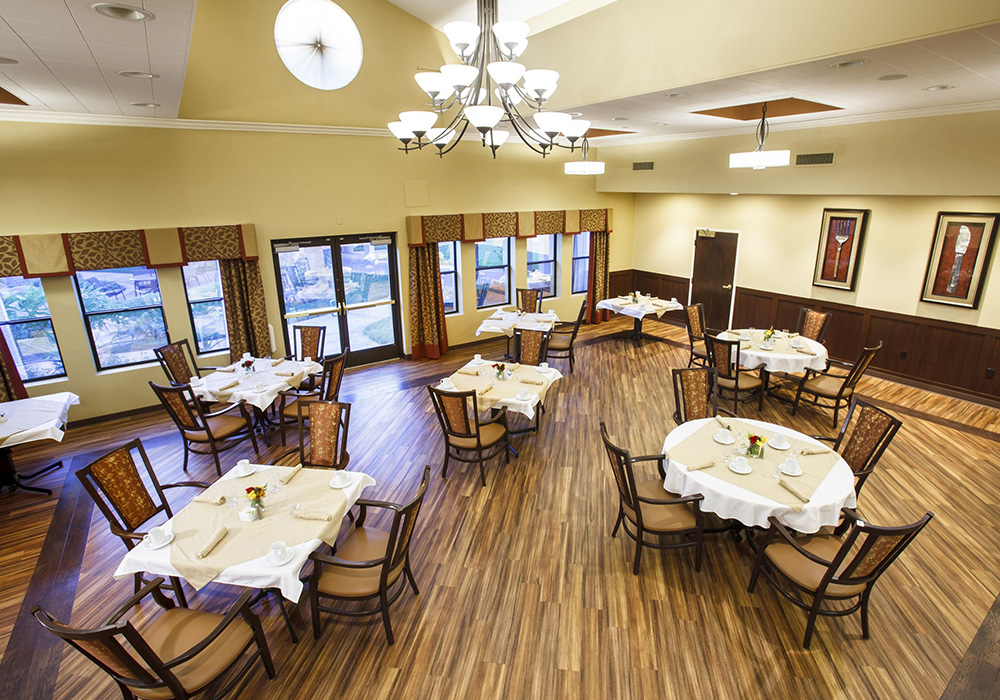
A carefully curated calendar of life enrichment programs is also conducted to keep residents active and socially engaged. There’s no need to worry about mealtimes with delicious and healthy meals catering to residents’ dietary needs and preferences served three times daily. The community received a five-star rating from the Center for Medicare Services, proving its exceptional quality.
May offer a more intimate, personalized care environment.
Lower occupancy suggests more openings may be available.
Most residents typically stay for a few weeks or months before returning home or moving on.
73% of new residents, usually for short-term rehab.
27% of new residents, often for short stays.
California average: 73%
OakView Health Center is legally operated by Oakview Hc Llc.
Housing Options: Private / Semi-Private Rooms
Building Type: Single-story
Dining Services
Beauty Services
Housekeeping Services
Recreational Activities
Exercise Programs
In California, the Department of Social Services (for assisted living facilities) and the Department of Public Health (for nursing homes) conduct inspections to ensure resident safety and regulatory compliance.
California average: 16 visits
4 total complaint visits
0 other visits
![]() Other visits include regulatory visits that are not routine inspections or complaint investigations, such as administrative check-ins, follow-up reviews, or licensing-related visits.
Other visits include regulatory visits that are not routine inspections or complaint investigations, such as administrative check-ins, follow-up reviews, or licensing-related visits.
13 total complaint visits
7 other visits
Investigations can have many visits.
California average: 10 complaint investigations
California average: 4 official inspections
Citations indicate regulatory violations. A higher number implies the facility had several areas requiring improvement.
California average: 10 citations
A violation that poses an immediate risk to resident health or safety, or represents a substantial failure to comply with licensing requirements.
California average: 3 serious citations
A violation that does not pose an immediate risk to resident health or safety but requires correction to remain in compliance.
California average: 4 moderate citations
Deficiencies indicate regulatory issues. A higher number implies the facility had several areas requiring improvement.
California average: 8 deficiencies
Most inspections found no deficiencies, including the most recent report on April 30, 2025, which was a complaint investigation that found the allegations of medication mismanagement and insufficient staffing unsubstantiated. The facility had one substantiated complaint in May 2024 involving a staff member hitting a resident, resulting in that staff member being placed on leave and not returning. An earlier annual inspection in January 2023 cited a hot water temperature issue posing a health risk, but subsequent inspections showed no similar problems, indicating improvement in safety compliance. Several complaint investigations were unsubstantiated, and no fines, license suspensions, or enforcement actions were listed in the available reports. Overall, the facility’s record shows mostly compliance with isolated issues that have been addressed.
California average 12.5
Last Health inspection on Aug 2025
California average 50.2
California average 4.65
Health citations are formal notices following inspections when they fail to comply with safety and care standards.
5 of 9 citations resulted from standard inspections; and 4 of 9 resulted from complaint investigations.
California average: 0.4
California average: 1
Data sourced from CMS Health Deficiencies reports. Citation severity codes range from A (least serious) to L (most serious). Immediate Jeopardy (J-L) citations indicate situations where the facility's noncompliance has placed residents at risk of death or serious harm.
Assisted Living A licensed, long-term care setting for seniors or individuals with disabilities who need help with daily activities — like bathing, dressing, and medication management — but not 24-hour skilled nursing. Offers housing, meals, and around-the-clock support while aiming to maximize resident independence.
Memory Care Secured, specialized care for people living with Alzheimer's or dementia. Staff trained in cognitive impairment, with higher staff-to-resident ratios and an environment designed to reduce confusion and wandering risk.
Nursing Home Licensed facility providing 24/7 skilled nursing care for residents with complex, ongoing medical needs. Staffed by RNs, LPNs, and CNAs. Inspected and star-rated annually by CMS. Accepts Medicare (short-term rehab) and Medicaid (long-term care).
Nursing Home Licensed facility providing 24/7 skilled nursing care for residents with complex, ongoing medical needs. Staffed by RNs, LPNs, and CNAs. Inspected and star-rated annually by CMS. Accepts Medicare (short-term rehab) and Medicaid (long-term care).
Nursing Home Licensed facility providing 24/7 skilled nursing care for residents with complex, ongoing medical needs. Staffed by RNs, LPNs, and CNAs. Inspected and star-rated annually by CMS. Accepts Medicare (short-term rehab) and Medicaid (long-term care).
Care Homes
Nursing Home Licensed facility providing 24/7 skilled nursing care for residents with complex, ongoing medical needs. Staffed by RNs, LPNs, and CNAs. Inspected and star-rated annually by CMS. Accepts Medicare (short-term rehab) and Medicaid (long-term care).
Nursing Home Licensed facility providing 24/7 skilled nursing care for residents with complex, ongoing medical needs. Staffed by RNs, LPNs, and CNAs. Inspected and star-rated annually by CMS. Accepts Medicare (short-term rehab) and Medicaid (long-term care).
![]() 7.5 miles from city center
7.5 miles from city center
![]() 3557 Campus Dr, Thousand Oaks, CA 91360
3557 Campus Dr, Thousand Oaks, CA 91360
Add your location
This data corresponds to Q2 2025 and is based on CMS Payroll-Based Journal.
California average ratio: 0.00:1
California average: 7.7 hours
Manages medical care and health needs.
No contractors work on this role.
Assists with medical care and medications.
No contractors work on this role.
Helps with daily care and mobility.
No contractors work on this role.
Total hours from contractors
1,401 contractor hours this quarter
| Certified Nursing Assistant | 41 | 0 | 41 | 12,586 | 91 | 100% | 7.7 |
| Licensed Practical Nurse | 13 | 0 | 13 | 5,227 | 91 | 100% | 7.7 |
| Other Dietary Services Staff | 5 | 0 | 5 | 1,551 | 91 | 100% | 7.6 |
| Registered Nurse | 3 | 0 | 3 | 1,176 | 85 | 93% | 8 |
| Administrator | 1 | 0 | 1 | 488 | 61 | 67% | 8 |
| RN Director of Nursing | 1 | 0 | 1 | 484 | 62 | 68% | 7.8 |
| Nurse Practitioner | 1 | 0 | 1 | 476 | 60 | 66% | 7.9 |
| Clinical Nurse Specialist | 1 | 0 | 1 | 474 | 62 | 68% | 7.6 |
| Physical Therapy Assistant | 0 | 1 | 1 | 468 | 67 | 74% | 7 |
| Dietitian | 1 | 0 | 1 | 440 | 55 | 60% | 8 |
| Mental Health Service Worker | 1 | 0 | 1 | 344 | 43 | 47% | 8 |
| Respiratory Therapy Technician | 0 | 1 | 1 | 224 | 65 | 71% | 3.4 |
| Speech Language Pathologist | 0 | 2 | 2 | 214 | 65 | 71% | 3.3 |
| Physical Therapy Aide | 0 | 1 | 1 | 184 | 57 | 63% | 3.2 |
| Occupational Therapy Aide | 0 | 1 | 1 | 159 | 40 | 44% | 4 |
| Qualified Social Worker | 0 | 3 | 3 | 80 | 35 | 38% | 2.3 |
| Occupational Therapy Assistant | 0 | 1 | 1 | 56 | 38 | 42% | 1.5 |
| Medical Director | 0 | 1 | 1 | 16 | 4 | 4% | 4 |
Source: CMS Long-Term Care Facility Characteristics (Data as of Jan 2026)
Residents meet regularly to discuss policies, care quality, and activities
Part of a Continuing Care Retirement Community offering multiple care levels
Organized group of residents that meets regularly to discuss facility policies, quality of life, and activities.
Data sourced from CMS Long-Term Care Facility Characteristics quarterly report. Payer mix reflects the current resident census by primary payment source.
These measures show how residents usually do over time at this home, based on health outcomes and preventive care.
California average: 6.6
California average: 11.3
California average: 11.1%
California average: 12.0%
California average: 11.3%
California average: 1.7%
California average: 5.0%
California average: 1.2%
California average: 4.2%
California average: 6.7%
California average: 10.1%
California average: 98.5%
California average: 98.2%
California average: 2.25
California average: 1.59
California average: 94.0%
California average: 1.5%
California average: 93.2%
California average: 23.2%
California average: 11.2%
California average: 0.8%
California average: 53.7%
California average: 50.6%
Quality measures are calculated from Minimum Data Set (MDS) assessments. For most measures, lower percentages indicate better care quality.
Historical financial and operational data for OakView Health Center based on CMS SNF Cost Reports.
Loading trend charts...
Care Cost Calculator: See Prices in Your Area
Nursing Home Data Explorer
Don’t Wait Too Long: 7 Red Flag Signs Your Parent Needs Assisted Living Now
The True Cost of Assisted Living in 2025 – And How Families Are Paying For It
Understanding Senior Living Costs: Pricing Models, Discounts & Financial Assistance

Touring a community? Use this expert-backed checklist to stay organized, ask the right questions, and find the perfect fit.
We'll send you a PDF version of the touring checklist.