Explore Open Rooms

1 Contact details
2 What type of senior care service are you looking for?
3 What budget do you have in mind for senior care?
4 How soon do you need to find care?
5 Additional details

Thank you for your interest!

Our team will be in touch shortly to help with next steps.

Nursing Home in Ventura County

CMS overall rating Info The Overall CMS Rating combines results from health inspections, staffing levels and quality measures. Health inspections carry the most weight. Staffing and quality scores can increase or decrease the final rating based on performance compared to state and national standards.

Oxnard Manor Healthcare Center

1400 W Gonzales Rd, Oxnard, CA 93036 View map
Overview of Oxnard Manor Healthcare Center

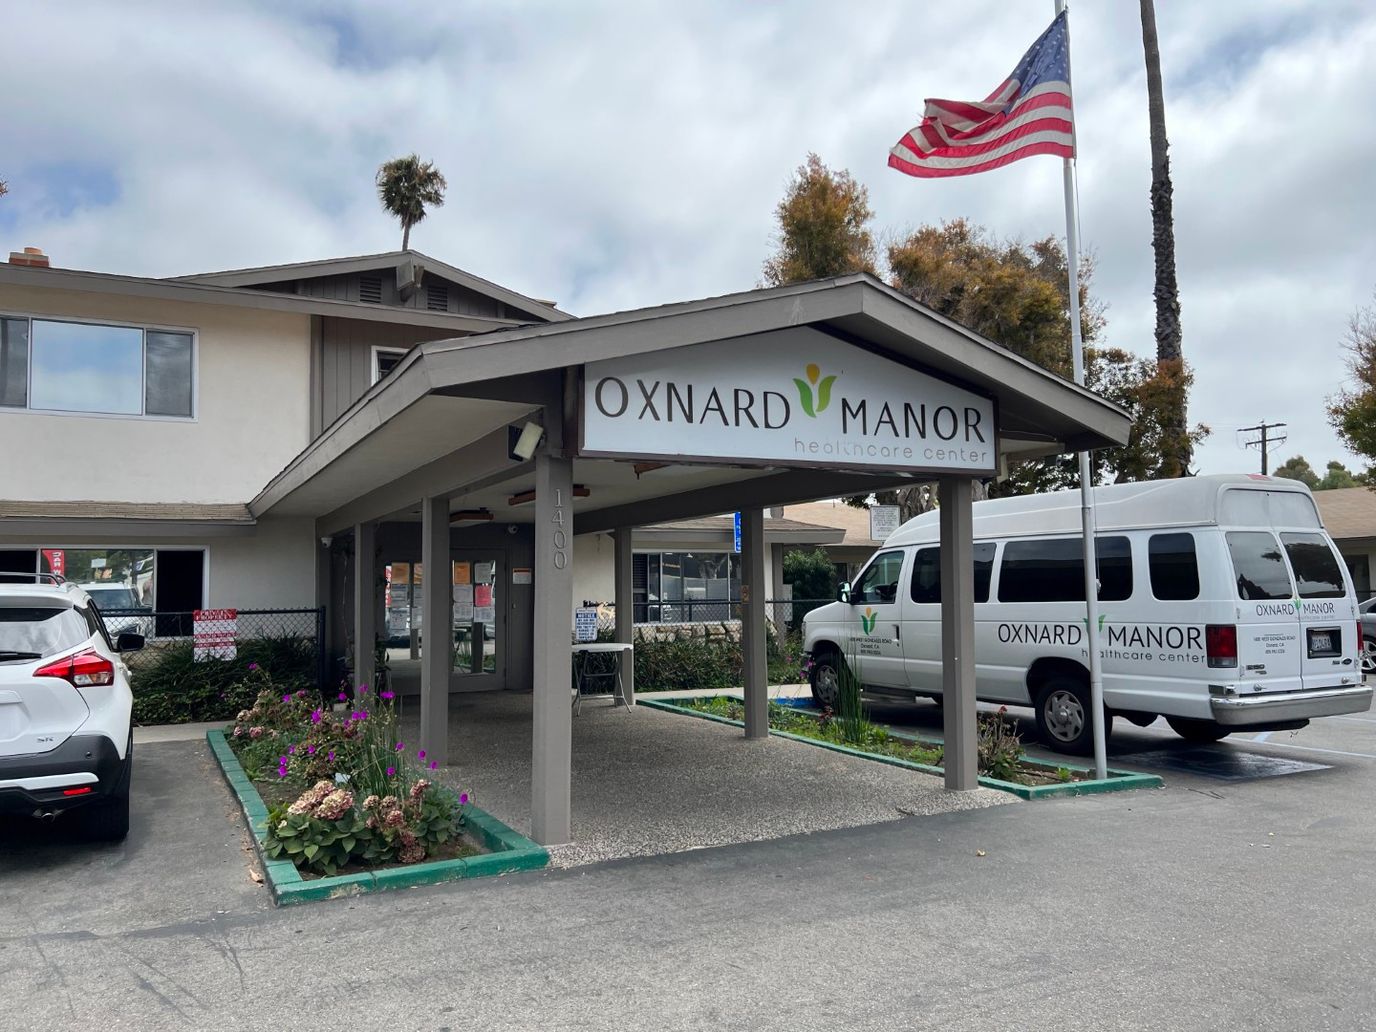
Oxnard Manor Healthcare Center is a dedicated community in the harmonious neighborhood of Oxnard, CA, that offers rehabilitation and skilled nursing. The community is dedicated to accommodating up to 82 residents with its cozy and specially designed accommodations, alongside top-tier care and support tailored to their needs. With comprehensive care from a compassionate and highly skilled team available 24/7, residents can ease their worries.

Here, residents will not run out of things to do with a variety of fun activities and engaging events for their leisure and wellness. Healthy meals are important for residents’ well-being, so delightful and nutritious meals are served to satisfy dietary needs and preferences. Transportation and social services are also available for residents’ convenience. The community is ideal for those seeking a wide range of care for their needs, especially with its beautifully designed amenities.

Quality ratings

Measured by Centers for Medicare & Medicaid Services (CMS)

Overall rating Info The Overall CMS Rating combines results from health inspections, staffing levels and quality measures. Health inspections carry the most weight. Staffing and quality scores can increase or decrease the final rating based on performance compared to state and national standards.
4/5
California average: 3.1/5
Health Inspection Info Based on the results of the facility's three most recent standard inspections and any complaint investigations. CMS reviews the number, scope, and severity of deficiencies, with more recent findings weighted more heavily.
3/5
California average: 2.8/5
Staffing Info Measures average nursing staff hours per resident per day, including Registered Nurses (RNs) and total nursing staff. Ratings are adjusted based on the level of care residents require and are compared to state and national benchmarks.
3/5
California average: 3.1/5
Quality Measures Info Based on clinical and physical health indicators reported to CMS, such as hospital readmissions, falls, pressure ulcers, and improvements in mobility. These measures reflect how well residents' health needs are being managed.
5/5
California average: 4.1/5

Nursing care per resident

Info This shows how many total hours of nursing staff time are available per resident each day. Higher numbers usually mean more staff support.
3h 42m per day

This home provides 12% less nursing time per resident than the California average.

California average: 4h 13m per day

Staffing hours breakdown

Info Hours of care per resident per day, broken down by staff type. Data from CMS Medicare.
Staff type Facility State avg National avg
Registered Nurse (RN) Info Registered nurse hours per resident per day. 32m per day 39m per day 41m per day
Nurse Aide Info Nurse aide hours per resident per day. 2h 21m per day 2h 39m per day 2h 21m per day
Total Nursing (Weekend) Info Total number of nurse staff hours per resident per day on weekends. 3h 45m per day 4h 5m per day 3h 26m per day
Physical Therapist Info Physical therapist staff hours per resident per day. 7m per day 5m per day 4m per day
RN (Weekend) Info Registered nurse hours per resident per day on weekends. 25m per day 30m per day 29m per day

Capacity and availability

Smaller home

May offer a more intimate, personalized care environment.

Total beds 82

This home usually has limited availability

Occupancy is moderate, suggesting balanced demand.

Similar demand to the California average
Occupancy rate 86.9%
Residents per day (avg) 78
Occupancy rate
86.9%
Residents per day (avg)
78

Who this home usually serves

TYPE OF STAY

Mostly short-term rehab stays

Most residents typically stay for a few weeks or months before returning home or moving on.

Might be optimal for
Short stays Recovery Medicare-covered care

Breakdown by payment type

Medicare

74% of new residents, usually for short-term rehab.

Typical stay 26 days

Private pay

9% of new residents, often for short stays.

Typical stay 4 - 5 months

Medicaid

18% of new residents, often for long-term daily care.

Typical stay 1 years

Finances and operations

Privately-owned community
Operated by a partnership between two or more business owners.
Home revenue
$17.4M
Profit
$538.3K
Privately-owned community Operated by a partnership between two or more business owners.
Home revenue
$17,414,134.00
Profit
$538,254.00
Payroll costs Info The portion of the home's budget spent on staff, including nurses, caregivers, and other employees who support care and operations.
$5.9M
33.8% of revenue
Other operating costs Info All remaining costs needed to run the home, such as food, utilities, building maintenance, supplies and administrative expenses.
$11.0M
Total costs $16.9M
Walk Score
Walk Score: 67 / 100
Moderately walkable. Some errands can be accomplished on foot, with a mix of nearby amenities.

About this community

Therapy & Rehabilitation

2 services
Rehabilitation Services
Short-Term Rehab

Staffing & Medical

1 service
Skilled Nursing

Additional Services

1 service
Short-Term Rehabilitation

Amenities & Lifestyle

0 amenities
Specific ProgramsSkilled Nursing, Rehabilitation, Amenities

What does this home offer?

Housing options icon

Housing Options: Private / Shared Rooms

Building type icon
Building type icon

Building Type: Single-story

Dining services icon

Dining Services

Beauty services icon

Beauty Services

Exercise program icon

Exercise Programs

Types of Care at Oxnard Manor Healthcare Center

Nursing Home
Contact Oxnard Manor Healthcare Center

Health Inspection History

Inspections
Total health inspections 16

California average 12.5


Last Health inspection on Jul 2025

Total health citations 45

California average 50.2

Citations per inspection
2.81

California average 4.65


Health citations are formal notices following inspections when they fail to comply with safety and care standards.

30 of 45 citations resulted from standard inspections; and 15 of 45 resulted from complaint investigations.

Breakdown of citation severity (last 3 years)
Critical Health citations More info 0
100% better than California average

California average: 0.4


Serious Health citations More info 0
100% better than California average

California average: 1

0 critical citations More info California average: 0.4

0 serious citations More info California average: 1

45 moderate citations More info California average: 47.2

0 minor citations More info California average: 1.5
Citations history (last 3 years)
Resident Rights moderate citation Info Issues related to resident's rights, including dignity, privacy, and the ability to make decisions about their care. Jul 18, 2025
Corrected

Care Planning moderate citation Info Issues related to creating and updating personalized care plans for residents based on their needs and conditions. Feb 04, 2025
Corrected

Care Planning moderate citation Info Issues related to creating and updating personalized care plans for residents based on their needs and conditions. Jan 30, 2025
Corrected

Nutrition moderate citation Info Issues related to food quality, meal service, and resident's nutritional needs. Jan 24, 2025
Corrected

Compare Nursing Homes around Ventura County The information below is reported by the California Department of Social Services and Department of Public Health.

5 facilities compared · CMS & CA Dept. of Health data · Updated Apr 2026

Filter by care type
OakView Health Center
AL

Assisted Living A licensed, long-term care setting for seniors or individuals with disabilities who need help with daily activities — like bathing, dressing, and medication management — but not 24-hour skilled nursing. Offers housing, meals, and around-the-clock support while aiming to maximize resident independence.

MC

Memory Care Secured, specialized care for people living with Alzheimer's or dementia. Staff trained in cognitive impairment, with higher staff-to-resident ratios and an environment designed to reduce confusion and wandering risk.

NH

Nursing Home Licensed facility providing 24/7 skilled nursing care for residents with complex, ongoing medical needs. Staffed by RNs, LPNs, and CNAs. Inspected and star-rated annually by CMS. Accepts Medicare (short-term rehab) and Medicaid (long-term care).

Thousand Oaks
96
79.4%
-6%
5.21
-56%
+24%
0
9
1.5
0
43
A+
20
Bouchard Family Revocable Trust
$14.9M
$7.1M
47.8%
555857
Private / Semi-Private Rooms
Ventura Post Acute
NH

Nursing Home Licensed facility providing 24/7 skilled nursing care for residents with complex, ongoing medical needs. Staffed by RNs, LPNs, and CNAs. Inspected and star-rated annually by CMS. Accepts Medicare (short-term rehab) and Medicaid (long-term care).

Ventura
71
91.2%
+8%
4.80
-45%
+14%
1
18
3.0
1
65
-
65
-
$10.3M
$6.1M
58.9%
55719
Private / Shared Rooms
Victoria Care Center
NH

Nursing Home Licensed facility providing 24/7 skilled nursing care for residents with complex, ongoing medical needs. Staffed by RNs, LPNs, and CNAs. Inspected and star-rated annually by CMS. Accepts Medicare (short-term rehab) and Medicaid (long-term care).

Ventura
187
85.6%
+1%
4.11
-15%
-3%
0
28
1.8
0
43
-
65
Puente Partners Llc
$33.9M
$13.7M
40.5%
555478
Private / Semi-Private Rooms
Coastal View Healthcare Center
CH

Care Homes

NH

Nursing Home Licensed facility providing 24/7 skilled nursing care for residents with complex, ongoing medical needs. Staffed by RNs, LPNs, and CNAs. Inspected and star-rated annually by CMS. Accepts Medicare (short-term rehab) and Medicaid (long-term care).

Ventura
96
88.1%
+4%
3.78
-15%
-11%
1
37
3.4
1
87
-
65
Global Skilled Llc
$16.2M
$8.6M
53.1%
55566
Private / Shared Rooms
Oxnard Manor Healthcare Center
NH

Nursing Home Licensed facility providing 24/7 skilled nursing care for residents with complex, ongoing medical needs. Staffed by RNs, LPNs, and CNAs. Inspected and star-rated annually by CMS. Accepts Medicare (short-term rehab) and Medicaid (long-term care).

Oxnard (Fremont North)
82
86.9%
+3%
3.70
+8%
-12%
0
45
2.8
0
78
-
67
Oxnard Healthcare & Wellness Centre, Lp
$16.1M
$5.9M
36.6%
56379
Private / Shared Rooms

Places of interest near Oxnard Manor Healthcare Center

Address 2.6 miles from city center

Address 1400 W Gonzales Rd, Oxnard, CA 93036

Calculate Travel Distance to Oxnard Manor Healthcare Center

Add your location

Address

Staffing Data (Q2 2025)

This data corresponds to Q2 2025 and is based on CMS Payroll-Based Journal.

Total staff 120
Employees 117
Contractors 3
Staff to resident ratio 1.69:1
1690041% better than California average

California average ratio: 0.00:1

Avg staff/day 52
Average shift 7.2 hours
6% worse than California average

California average: 7.7 hours

Total staff hours (quarter) 34,144
Nursing staff breakdown
Registered Nurse

Manages medical care and health needs.

Total count 11
Average shift length Info Average shift length. Calculated as total hours divided by days worked and average staff per day. 6.9 hours

No contractors work on this role.

Licensed Practical Nurse

Assists with medical care and medications.

Total count 22
Average shift length Info Average shift length. Calculated as total hours divided by days worked and average staff per day. 7.6 hours

This role is partially covered by contractors.

Certified Nursing Assistant

Helps with daily care and mobility.

Total count 59
Average shift length Info Average shift length. Calculated as total hours divided by days worked and average staff per day. 7.4 hours

No contractors work on this role.

Contractor staffing

Total hours from contractors

0.2%

64 contractor hours this quarter

Licensed Practical Nurse: 1 Medical Director: 1 Occupational Therapy Assistant: 1
Staff by category
Certified Nursing Assistant5905916,62591100%7.4
Licensed Practical Nurse211226,66991100%7.6
Registered Nurse110113,01991100%6.9
Physical Therapy Aide6061,61791100%6.4
RN Director of Nursing4041,4348391%6.9
Clinical Nurse Specialist2029627481%7.9
Respiratory Therapy Technician2027646571%7
Physical Therapy Assistant3037047481%5.8
Therapeutic Recreation Specialist1014916774%7.3
Speech Language Pathologist3034665965%7.5
Other Dietary Services Staff2024656167%7.4
Mental Health Service Worker1014565763%8
Dietitian2024265358%8
Medical Director011241516%1.6
Occupational Therapy Assistant0112433%8
59 Certified Nursing Assistant
% of Days 100%
22 Licensed Practical Nurse
% of Days 100%
11 Registered Nurse
% of Days 100%
6 Physical Therapy Aide
% of Days 100%
4 RN Director of Nursing
% of Days 91%
2 Clinical Nurse Specialist
% of Days 81%
2 Respiratory Therapy Technician
% of Days 71%
3 Physical Therapy Assistant
% of Days 81%
1 Therapeutic Recreation Specialist
% of Days 74%
3 Speech Language Pathologist
% of Days 65%
2 Other Dietary Services Staff
% of Days 67%
1 Mental Health Service Worker
% of Days 63%
2 Dietitian
% of Days 58%
1 Medical Director
% of Days 16%
1 Occupational Therapy Assistant
% of Days 3%

Facility Characteristics

Source: CMS Long-Term Care Facility Characteristics (Data as of Jan 2026)

Total census
71 residents
Residents by payment source
Medicare
46 residents (64.8%)
Medicaid
17 residents (23.9%)
Private pay or other
8 residents (11.3%)
Programs & Services
Residents' Group

Residents meet regularly to discuss policies, care quality, and activities

Active Resident Council

Organized group of residents that meets regularly to discuss facility policies, quality of life, and activities.

Quality of care over time

These measures show how residents usually do over time at this home, based on health outcomes and preventive care.

High-risk clinical events score Info A composite score based on pressure ulcers, falls with injury, weight loss, walking ability decline, and activities of daily living decline. 2.8
58% better than California average

California average: 6.6

Functional decline score Info A composite score based on activities of daily living decline, walking ability decline, and incontinence. 4.1
64% better than California average

California average: 11.3

Long-stay resident measures
Significantly above average California avg: 4.3 Info CMS star rating based on long-stay quality measure performance. 5 stars = significantly above average, 1 star = significantly below average.
Need for Help with Daily Activities Increased Info Percent of long-stay residents whose need for help with daily activities has increased 3.6%
68% better than California average

California average: 11.1%

Walking Ability Worsened Info Percent of long-stay residents whose ability to move independently worsened 1.2%
90% better than California average

California average: 12.0%

Low Risk Residents with Bowel/Bladder Incontinence Info Percent of low risk long-stay residents who lose control of their bowels or bladder 7.5%
33% better than California average

California average: 11.3%

Falls with Major Injury Info Percent of long-stay residents experiencing one or more falls with major injury 0.9%
47% better than California average

California average: 1.7%

High Risk Residents with Pressure Ulcers Info Percent of long-stay high risk residents with pressure ulcers 5.8%
16% worse than California average

California average: 5.0%

Urinary Tract Infection Info Percent of long-stay residents with a urinary tract infection 1.4%
11% worse than California average

California average: 1.2%

Lost Too Much Weight Info Percent of long-stay residents who lose too much weight 2.6%
38% better than California average

California average: 4.2%

Depressive Symptoms Info Percent of long-stay residents who have depressive symptoms 4.9%
27% better than California average

California average: 6.7%

Antipsychotic Use Info Percent of long-stay residents who received an antipsychotic medication 5.7%
44% better than California average

California average: 10.1%

Pneumococcal Vaccine Info Percent of long-stay residents assessed and appropriately given the pneumococcal vaccine 100.0%
In line with California average

California average: 98.5%

Influenza Vaccine Info Percent of long-stay residents assessed and appropriately given the seasonal influenza vaccine 100.0%
In line with California average

California average: 98.2%

Hospitalizations per 1,000 days Info Number of hospitalizations per 1,000 long-stay resident days. 2.41
7% worse than California average

California average: 2.25

ED visits per 1,000 days Info Number of outpatient emergency department visits per 1,000 long-stay resident days. 1.12
30% better than California average

California average: 1.59

Short-stay resident measures
Average California avg: 3.5 Info CMS star rating based on short-stay quality measure performance. 5 stars = much above average, 1 star = much below average.
Pneumococcal Vaccine Info Percent of short-stay residents assessed and appropriately given the pneumococcal vaccine 99.4%
6% better than California average

California average: 94.0%

Antipsychotic medication increase Info Percent of short-stay residents who newly received an antipsychotic medication 1.9%
31% worse than California average

California average: 1.5%

Influenza Vaccine Info Percent of short-stay residents assessed and appropriately given the seasonal influenza vaccine 98.8%
6% better than California average

California average: 93.2%

Re-hospitalized after SNF stay Info Percentage of short-stay residents who were re-hospitalized after their nursing home admission. 21.6%
7% better than California average

California average: 23.2%

Emergency department visits Info Percentage of short-stay residents who had an outpatient emergency department visit. 8.4%
25% better than California average

California average: 11.2%

Falls with major injury Info Percentage of SNF residents who experience falls with major injury during their stay. 0.7%
8% better than California average

California average: 0.8%

Ability to care for self at discharge Info Percentage of residents at or above expected ability to care for themselves at discharge. 60.4%
13% better than California average

California average: 53.7%

Successful return to home or community Info Rate of successful return to home or community from a skilled nursing facility. 48.5%
In line with California average

California average: 50.6%

Guides for Better Senior Living

Care Cost Calculator: See Prices in Your Area

Nursing Home Data Explorer

Don’t Wait Too Long: 7 Red Flag Signs Your Parent Needs Assisted Living Now

The True Cost of Assisted Living in 2025 – And How Families Are Paying For It

Understanding Senior Living Costs: Pricing Models, Discounts & Financial Assistance

Financial Aid for California Seniors

Get financial aid guidance

Multipurpose Senior Services Program

MSSP (Medi-Cal Waiver)

Age 65+, California resident, Medi-Cal eligible, nursing home risk.

~$2,829/month (300% FBR, individual).

$2,000 (individual), $3,000 (couple).

County-managed; waitlists possible.

In-Home Supportive Services (IHSS)

California IHSS

Age 65+, California resident, Medicaid-eligible or low-income.

~$1,732/month (individual, Medi-Cal threshold).

$2,000 (individual).

Can hire family as caregivers.

Multipurpose Senior Services Program (MSSP)

CA MSSP

Age 65+, California resident, Medi-Cal-eligible, nursing home-eligible but community-capable.

~$2,829/month (300% FBR, individual).

$2,000 (individual).

Available in 38 counties; waitlists common.

Property Tax Postponement Program (PTP)

CA PTP

Age 62+, California resident, own and live in home, 40% equity.

~$51,500/year (household, adjusted annually).

Equity-based; no strict asset cap.

Deferred taxes accrue interest (5% as of 2024); repaid upon sale/death.

Assisted Living Waiver (ALW)

CA ALW

Age 65+ or disabled, California resident, Medi-Cal-eligible, nursing home-eligible.

~$2,829/month (300% FBR, individual).

$2,000 (individual).

Available in 15 counties (e.g., LA, Sacramento); waitlists common.

California CARES Program

CA CARES

Caregivers of California residents 60+ needing help with 3+ daily activities; no caregiver age limit.

No strict limit; cost-sharing above ~$2,500/month threshold.

Not applicable; need-based.

High demand in urban areas; complements IHSS respite.

Low-Income Home Energy Assistance Program (LIHEAP)

CA LIHEAP

Age 60+ priority, California resident, low-income, utility/heating need.

~$2,510/month (200% of poverty level, individual).

Not applicable; income-focused.

High demand in inland/coastal extremes; weatherization capped at $5,000/home.