Victoria Care Center
Nursing Home & Memory Care · Ventura, CA
CMS overall rating Info CMS (the Centers for Medicare & Medicaid Services) is the federal agency that rates nursing home quality. Its Overall Rating runs from 1 to 5 stars, combining health inspections, staffing, and quality measures, with inspections weighted most heavily.

Victoria Care Center

Nursing Home & Memory Care · Ventura, CA
CMS overall rating Info CMS (the Centers for Medicare & Medicaid Services) is the federal agency that rates nursing home quality. Its Overall Rating runs from 1 to 5 stars, combining health inspections, staffing, and quality measures, with inspections weighted most heavily.
Calculator: See prices in your area
Victoria Care Center accepts Medicare, Medicaid, and private pay.

Overview of Victoria Care Center

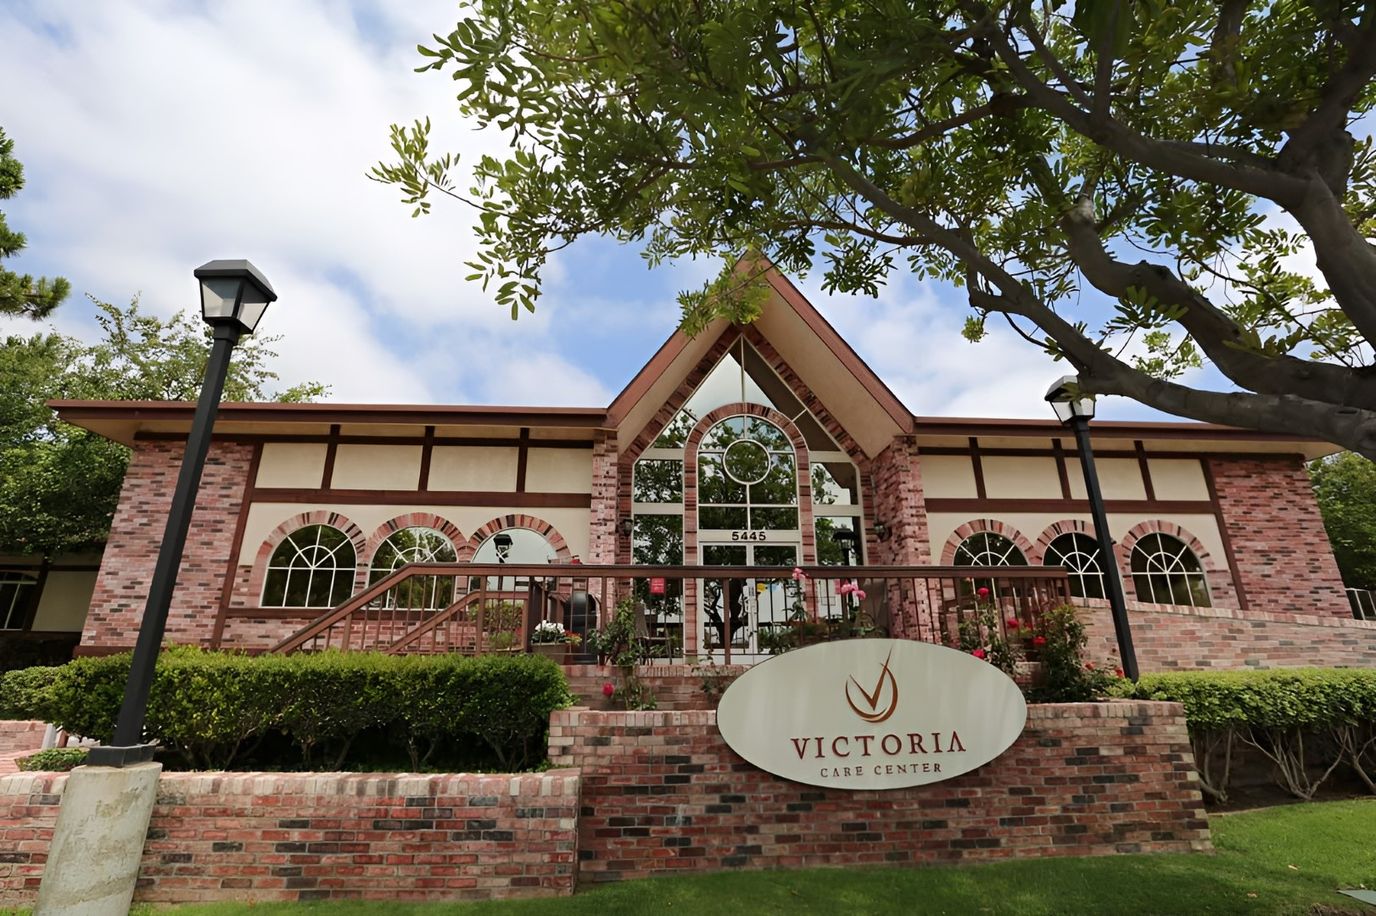
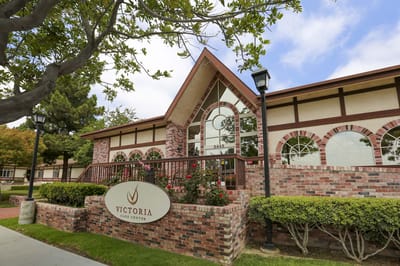
Find the care you need at Victoria Care Center, an esteemed community located in the harmonious residential area of Ventura, CA, that offers therapy and skilled nursing. With exceptional care and support 24/7, residents are guaranteed to live comfortably in their golden years. Medicare and Medicaid are also accepted in the community, easing residents’ financial burdens.

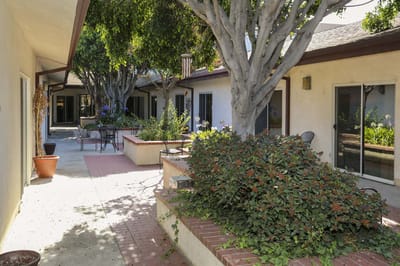
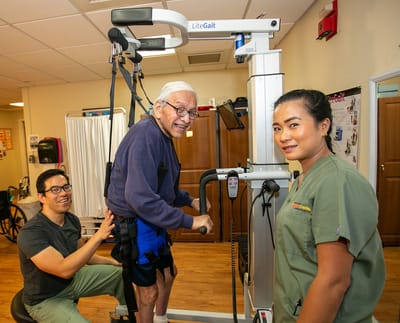
Aside from their healthcare needs, residents are encouraged to live actively with stimulating programs and exciting events. Through traditional and innovative approaches, the community strives to enhance residents’ living experiences. Make every moment of your golden years count with the community’s top-notch care and purposely designed amenities. The community was also awarded U.S. News Best Nursing Home, proving its exceptional and trusted quality.

Quality ratings

Measured by Centers for Medicare & Medicaid Services (CMS)

Overall rating Info The Overall CMS Rating combines results from health inspections, staffing levels and quality measures. Health inspections carry the most weight. Staffing and quality scores can increase or decrease the final rating based on performance compared to state and national standards.
▲ 58.8% Above CA avg. ▲ 58.8% Above CA avg.CA average: 3.1Click the badge to see the full State ranking.Click here to see the full State ranking.
Health Inspection Info Based on the results of the facility's three most recent standard inspections and any complaint investigations. CMS reviews the number, scope, and severity of deficiencies, with more recent findings weighted more heavily.
▲ 43.0% Above CA avg. ▲ 43.0% Above CA avg.CA average: 2.8Click the badge to see the full State ranking.Click here to see the full State ranking.
Staffing Info Measures average nursing staff hours per resident per day, including Registered Nurses (RNs) and total nursing staff. Ratings are adjusted based on the level of care residents require and are compared to state and national benchmarks.
▲ 27.5% Above CA avg. ▲ 27.5% Above CA avg.CA average: 3.1Click the badge to see the full State ranking.Click here to see the full State ranking.
Quality Measures Info Based on clinical and physical health indicators reported to CMS, such as hospital readmissions, falls, pressure ulcers, and improvements in mobility. These measures reflect how well residents' health needs are being managed.
▲ 22.4% Above CA avg. ▲ 22.4% Above CA avg.CA average: 4.1Click the badge to see the full State ranking.Click here to see the full State ranking.

Staffing hours breakdown

Info Daily nursing hours per resident by staff type, reported to CMS. Higher is generally better — compare this facility to state and national averages to see where staffing stands.

Hours per resident per day — compared to California state averages

Total nursing care / resident Info This home is ranked 160th out of 354 homes in California for nurse hours. Total adjusted nursing hours per resident per day, combining RN, LPN, and aide time. CMS adjusts this for case-mix so facilities can be fairly compared.
4h 7m per day
Rank #160 / 354Nurse hours — State benchmarkedThis home is ranked 160th out of 354 homes in California. Shows adjusted nurse hours per resident per day benchmarked to the California average, with a ranking across 354 California facilities. More hours mean more direct care. The national average is about 3.5 hrs; below 3.0 is a red flag.Rankings are based only on facilities in California that report data for that category. Facilities without available data are excluded from the ranking.Click the rank badge to see the full State ranking.Click here to see the full State ranking.
This facility California avg (4h 13m per day)
vs California avg
-3%

4 of 6 metrics below state avg

Standout metric Physical Therapist is +92% above state avg
Staff typeHours / Day / Residentvs state avg
Registered Nurse (RN) Info RNs hold the highest nursing license and can assess residents, interpret test results, and direct care plans. More RN hours per day often signals stronger clinical oversight and faster response to health changes. 28m per day ▼ 28% State avg: 39m per day · National avg: 41m per day
LPN / LVN Info Licensed Practical Nurses (LPNs) or Licensed Vocational Nurses (LVNs) deliver routine hands-on care — medication administration, wound dressing, and monitoring vital signs. They work under RN supervision and make up a large share of daily bedside care. 1h 7m per day ▼ 9% State avg: 1h 13m per day · National avg: 52m per day
Nurse Aide Info Certified Nurse Aides (CNAs) provide the most direct day-to-day assistance: bathing, dressing, feeding, and mobility. Nurse aide hours are typically the largest staffing category and directly affect residents' quality of life. 2h 47m per day ▲ 5% State avg: 2h 39m per day · National avg: 2h 21m per day
Weekend Total Nursing Info Combined nursing hours (RN + LPN + Nurse Aide) per resident per day on weekends. Staffing often drops on weekends — this figure reveals whether the facility maintains adequate coverage outside of weekday hours. 3h 55m per day ▼ 4% State avg: 4h 5m per day · National avg: 3h 26m per day
Physical Therapist Info Hours per resident per day provided by licensed Physical Therapists (PTs) or PT Assistants. PT services help residents recover mobility after injury or illness and are especially important for post-acute (short-stay) rehabilitation. 10m per day ▲ 92% State avg: 5m per day · National avg: 4m per day
Weekend RN Info Registered nurse hours specifically on weekends. Facilities sometimes reduce RN presence on Saturdays and Sundays — a low weekend RN figure compared to weekday hours can indicate reduced clinical oversight when most administrative staff are absent. 23m per day ▼ 22% State avg: 30m per day · National avg: 29m per day

Capacity and availability

This home usually has limited availability

Higher occupancy than the California average: 84.7%
Occupancy rate
90.8% Rank #298 / 1537Occupancy rate — State benchmarkedThis home is ranked 298th out of 1537 homes in California. Shows this facility's occupancy rate versus the California average, with its Statewide rank out of 1537. Higher occupancy signals strong local demand and financial stability.Rankings are based only on facilities in California that report data for that category. Facilities without available data are excluded from the ranking.Click the rank badge to see the full State ranking.Click here to see the full State ranking.
Avg. Length of Stay
91 days
Bed community size
188-bed community Rank #187 / 1657Bed count — State benchmarkedThis home is ranked 187th out of 1657 homes in California. Shows this facility's certified or reported bed count compared to other California facilities. Larger communities may offer more amenities, programs, and on-site services for residents and families.Rankings are based only on facilities in California that report data for that category. Facilities without available data are excluded from the ranking.Click the rank badge to see the full State ranking.Click here to see the full State ranking.
A large-scale community that may provide a wide range of amenities, services, and structured programs.
Walk Score
Walk Score: 65 / 100 Rank #888 / 2092Walk Score — State benchmarkedThis home is ranked 888th out of 2092 homes in California. Shows how walkable this facility's neighborhood is compared to the average Walk Score across California facilities. Higher scores benefit residents, families, and staff.Rankings are based only on facilities in California that report data for that category. Facilities without available data are excluded from the ranking.Click the rank badge to see the full State ranking.Click here to see the full State ranking.
Moderately walkable. Some errands can be accomplished on foot, with a mix of nearby amenities.

Payment & Insurance

2 services
Accept Medicaid
Accept Medicare

Therapy & Rehabilitation

1 service
Rehabilitation Services

Amenities & Lifestyle

Specific ProgramsIn-house Therapy, Activities & Excursions, Church Services
Religious Services

Contact Victoria Care Center

Staffing Data

Reporting period: October 1 – December 31, 2025 (Q4 2025). Source: CMS Payroll-Based Journal report.

Total staff 257
Employees 257
Contractors 0
Staff to resident ratio 1.40 : 1
23% fewer staff per resident than California average
California average ratio: 1.81 : 1 California average ratio: 1.81 : 1See full California ranking
Avg staff/day 123
Average shift 7.5 hours
0% compared with California average
California average: 7.7 hours California average shift: 7.7 hoursSee full California ranking
Total staff hours (quarter) 85,157

Nursing staff breakdown

Q4 2025 · Oct 1 – Dec 31 More info This data comes from the CMS Payroll-Based Journal report covering October 1 – December 31, 2025.
Registered Nurse

Manages medical care and health needs.

RN Staff Info All 22 RN Staff are full-time employees. No contractors work on this role. 22
Average shift length Info Average shift length. Calculated as total hours divided by days worked and average staff per day. 9.1 hours
Licensed Practical Nurse

Assists with medical care and medications.

LPN Staff Info All 46 LPN Staff are full-time employees. No contractors work on this role. 46
Average shift length Info Average shift length. Calculated as total hours divided by days worked and average staff per day. 7.7 hours
Certified Nursing Assistant

Helps with daily care and mobility.

CNA Staff Info All 147 CNA Staff are full-time employees. No contractors work on this role. 147
Average shift length Info Average shift length. Calculated as total hours divided by days worked and average staff per day. 7.3 hours

Contractor staffing

Q4 2025 · Oct 1 – Dec 31 More info This data comes from the CMS Payroll-Based Journal report covering October 1 – December 31, 2025.
Total hours from contractors 0% — all staff are direct employees this quarter

Staff by category

Q4 2025 · Oct 1 – Dec 31 More info This data comes from the CMS Payroll-Based Journal report covering October 1 – December 31, 2025.
Certified Nursing Assistant147014745,73192100%7.3
Licensed Practical Nurse4604616,78092100%7.7
Registered Nurse220226,56392100%9.1
Dental Services Staff6062,7649098%7.5
Respiratory Therapy Technician6062,6417177%7.4
Physical Therapy Aide5052,1657076%7.2
RN Director of Nursing3031,5618491%8.5
Other Dietary Services Staff3031,1867986%7.3
Physical Therapy Assistant4041,1617076%7.5
Qualified Social Worker4041,0587177%6.5
Speech Language Pathologist4041,0507784%7.3
Nurse Practitioner1015946672%9
Clinical Nurse Specialist1015946672%9
Administrator1015286672%8
Other Social Services Staff1015286672%8
Nurse Aide in Training3032543336%7.5
147 Certified Nursing Assistant
% of Days 100%
46 Licensed Practical Nurse
% of Days 100%
22 Registered Nurse
% of Days 100%
6 Dental Services Staff
% of Days 98%
6 Respiratory Therapy Technician
% of Days 77%
5 Physical Therapy Aide
% of Days 76%
3 RN Director of Nursing
% of Days 91%
3 Other Dietary Services Staff
% of Days 86%
4 Physical Therapy Assistant
% of Days 76%
4 Qualified Social Worker
% of Days 77%
4 Speech Language Pathologist
% of Days 84%
1 Nurse Practitioner
% of Days 72%
1 Clinical Nurse Specialist
% of Days 72%
1 Administrator
% of Days 72%
1 Other Social Services Staff
% of Days 72%
3 Nurse Aide in Training
% of Days 36%

Penalties and fines

Federal penalties imposed by CMS for regulatory violations, including civil money penalties (fines) and denials of payment for new Medicare/Medicaid admissions.

Source: CMS Penalties Database

No penalties in the past 3 years

No civil money penalties or payment denials were reported in the last 3 years.

Quality of care over time

These measures show how residents usually do over time at this home, based on health outcomes and preventive care.

High-risk clinical events score Info A composite score based on pressure ulcers, falls with injury, weight loss, walking ability decline, and activities of daily living decline. 3.8
43% better than California average

California average: 6.6

Functional decline score Info A composite score based on activities of daily living decline, walking ability decline, and incontinence. 8.3
27% better than California average

California average: 11.3

Long-stay resident measures
Significantly above average California avg: 4.2 Info CMS star rating based on long-stay quality measure performance. 5 stars = significantly above average, 1 star = significantly below average.
Need for Help with Daily Activities Increased Info Percent of long-stay residents whose need for help with daily activities has increased 5.4%
51% better than California average

California average: 11.1%

Walking Ability Worsened Info Percent of long-stay residents whose ability to move independently worsened 7.4%
38% better than California average

California average: 12.0%

Low Risk Residents with Bowel/Bladder Incontinence Info Percent of low risk long-stay residents who lose control of their bowels or bladder 12.0%
6% worse than California average

California average: 11.3%

Falls with Major Injury Info Percent of long-stay residents experiencing one or more falls with major injury 0.8%
54% better than California average

California average: 1.7%

High Risk Residents with Pressure Ulcers Info Percent of long-stay high risk residents with pressure ulcers 4.6%
8% better than California average

California average: 5.0%

Urinary Tract Infection Info Percent of long-stay residents with a urinary tract infection 1.0%
20% better than California average

California average: 1.2%

Lost Too Much Weight Info Percent of long-stay residents who lose too much weight 0.9%
80% better than California average

California average: 4.2%

Depressive Symptoms Info Percent of long-stay residents who have depressive symptoms 1.5%
78% better than California average

California average: 6.7%

Antipsychotic Use Info Percent of long-stay residents who received an antipsychotic medication 5.3%
48% better than California average

California average: 10.1%

Pneumococcal Vaccine Info Percent of long-stay residents assessed and appropriately given the pneumococcal vaccine 100.0%
In line with California average

California average: 98.5%

Influenza Vaccine Info Percent of long-stay residents assessed and appropriately given the seasonal influenza vaccine 100.0%
In line with California average

California average: 98.2%

Hospitalizations per 1,000 days Info Number of hospitalizations per 1,000 long-stay resident days. 1.77
21% better than California average

California average: 2.25

ED visits per 1,000 days Info Number of outpatient emergency department visits per 1,000 long-stay resident days. 1.86
17% worse than California average

California average: 1.59

Short-stay resident measures
Above average California avg: 3.5 Info CMS star rating based on short-stay quality measure performance. 5 stars = much above average, 1 star = much below average.
Pneumococcal Vaccine Info Percent of short-stay residents assessed and appropriately given the pneumococcal vaccine 99.9%
6% better than California average

California average: 94.0%

Antipsychotic medication increase Info Percent of short-stay residents who newly received an antipsychotic medication 0.7%
51% better than California average

California average: 1.5%

Influenza Vaccine Info Percent of short-stay residents assessed and appropriately given the seasonal influenza vaccine 100.0%
7% better than California average

California average: 93.2%

Re-hospitalized after SNF stay Info Percentage of short-stay residents who were re-hospitalized after their nursing home admission. 17.8%
23% better than California average

California average: 23.2%

Emergency department visits Info Percentage of short-stay residents who had an outpatient emergency department visit. 11.3%
In line with California average

California average: 11.2%

Falls with major injury Info Percentage of SNF residents who experience falls with major injury during their stay. 0.0%
100% better than California average

California average: 0.8%

Ability to care for self at discharge Info Percentage of residents at or above expected ability to care for themselves at discharge. 83.6%
56% better than California average

California average: 53.7%

Successful return to home or community Info Rate of successful return to home or community from a skilled nursing facility. 56.8%
12% better than California average

California average: 50.6%

Breakdown by payment type

Medicare

38% of new residents, usually for short-term rehab.

Typical stay 1 - 2 months

Private pay

53% of new residents, often for short stays.

Typical stay 28 days

Medicaid

9% of new residents, often for long-term daily care.

Typical stay 2 years

Facility Characteristics

Source: CMS Long-Term Care Facility Characteristics (Data as of Jan 2026)

Total residents 184
Medicare
35
19% of residents
Medicaid
120
65.2% of residents
Private pay or other
29
15.8% of residents

Finances and operations

Based on CMS SNF Cost Report for fiscal year ending in 12/2023.

For-profit
Operated by a single business entity.
Net patient revenue Info Net patient revenue — what the home actually collects for resident care, after contractual allowances, bad debt and discounts are subtracted from its gross charges (CMS cost report, Worksheet G-3). It covers resident care only; money the home earns from other sources is shown separately as "Other income."
$28.0M
Net patient income Info Net patient income: net patient revenue minus the home's total operating expenses. A positive figure means it earns more from resident care than it spends to deliver it; a negative figure means the opposite. It excludes non-operating "other income."
$3.3M
For-profit Operated by a single business entity.
Net patient revenue Info Net patient revenue — what the home actually collects for resident care, after contractual allowances, bad debt and discounts are subtracted from its gross charges (CMS cost report, Worksheet G-3). It covers resident care only; money the home earns from other sources is shown separately as "Other income."
$28.0M Rank #34 / 355Revenue — State benchmarkedThis home is ranked 34th out of 355 homes in California. Shows this facility's annual revenue compared to the California average. Higher revenue generally means more resources for staffing and capital — read alongside Payroll %.Rankings are based only on facilities in California that report data for that category. Facilities without available data are excluded from the ranking.Click the rank badge to see the full State ranking.Click here to see the full State ranking.
Net patient income Info Net patient income: net patient revenue minus the home's total operating expenses. A positive figure means it earns more from resident care than it spends to deliver it; a negative figure means the opposite. It excludes non-operating "other income."
$3.3M
Other income Info Money the home earns outside of resident care — such as investments, grants, rentals and other non-operating sources (CMS cost report, Worksheet G-3). It is tracked separately from net patient revenue: it is not part of that figure, and it is not included in net patient income.
$4.2K
Payroll costs Info Staff salaries plus wage-related costs — benefits such as payroll taxes, health insurance and retirement — from the home's own accounting records (CMS cost report, Worksheet A). Contract or agency labor is counted separately, under other operating costs. Rank #23 / 355Payroll — State benchmarkedThis home is ranked 23rd out of 355 homes in California. Shows total annual staff payroll benchmarked to the California average. Higher payroll investment relative to peers often signals better staffing and less reliance on cheaper contract labor.Rankings are based only on facilities in California that report data for that category. Facilities without available data are excluded from the ranking.Click the rank badge to see the full State ranking.Click here to see the full State ranking.
$16.1M 57.4% of net patient revenue Info Payroll as a share of revenue: staff salaries and wage-related benefits divided by net patient revenue. A higher figure means more of each revenue dollar goes to staff pay. Rank #192 / 355Payroll % — State benchmarkedThis home is ranked 192nd out of 355 homes in California. Shows payroll as a percentage of revenue versus the California average. Well-run California facilities typically land around 56–67% — the top third Statewide. Below 25% may signal understaffing or heavy agency use — read with Staffing ratings.Rankings are based only on facilities in California that report data for that category. Facilities without available data are excluded from the ranking.Click the rank badge to see the full State ranking.Click here to see the full State ranking.
Other operating costs Info Everything it costs to run the home apart from payroll — food, utilities, supplies, maintenance, contract labor and administration. Calculated as total operating expense minus payroll (staff salaries and wage-related benefits).
$8.6M
Total costs Info The home's total operating expense for the year — all the costs of running it, salaries included (CMS cost report, Worksheet G-3).
$24.7M

What does this home offer?

Housing options icon

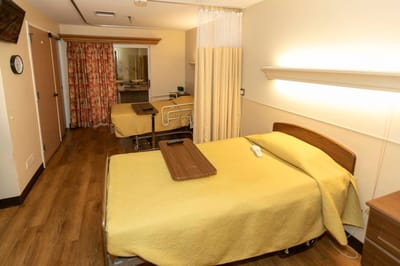
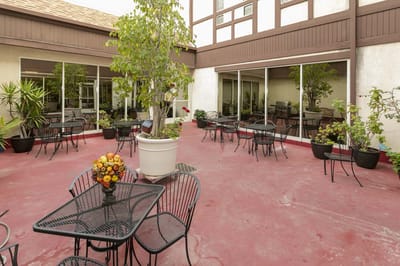
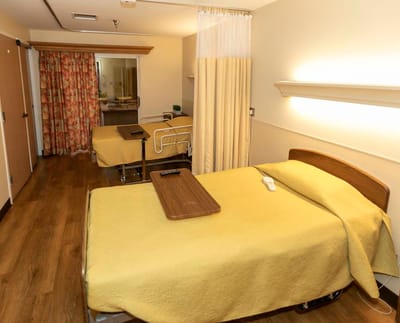
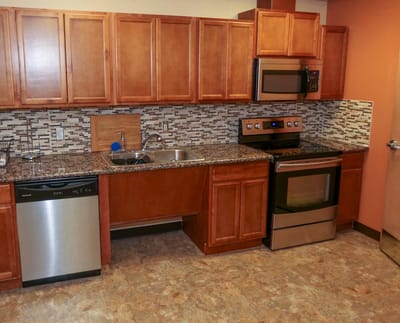
Housing Options: Private / Semi-Private Rooms

Building type icon
Building type icon

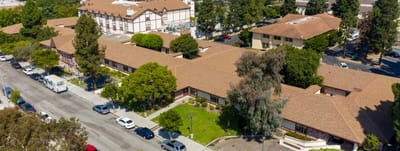
Building Type: 3-story

Housekeeping icon
Housekeeping icon

Housekeeping Services

Recreational activities icon

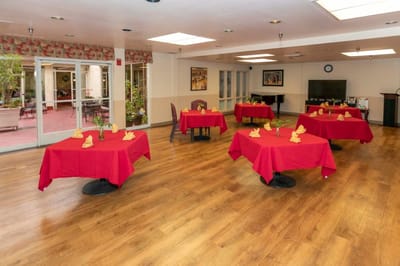
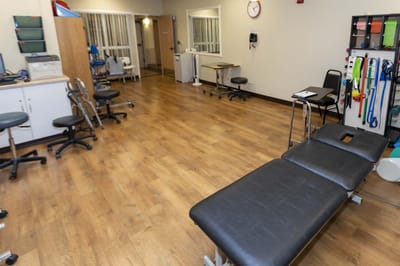
Recreational Activities
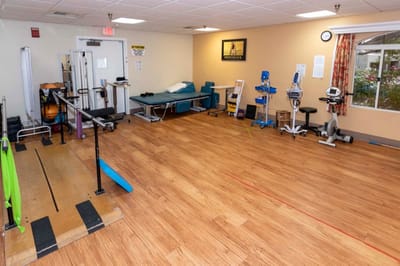
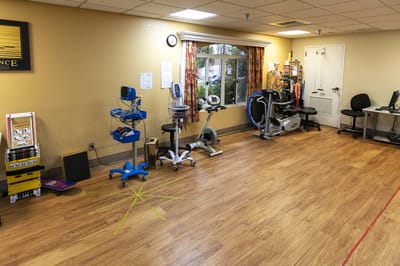
Exercise program icon

Exercise Programs

Who this home usually serves

TYPE OF STAY

Mix of rehab and long-term care

This home supports both short-term rehab and long-term care, with residents staying for a wide range of durations.

Most new residents arrive under private pay (53% of admissions), and a typical private pay stay runs around 28 days.

Admissions
703 total

Coverage residents most often arrive under.

Medicare 38%
Private pay 53%
Medicaid 9%
Discharges
684 total

Coverage residents most often leave under.

Medicare 34%
Private pay 57%
Medicaid 9%

Places of interest near Victoria Care Center

Address 5.6 miles from city center Info Estimated distance in miles from Ventura's city center to Victoria Care Center's address, calculated via Google Maps.

Calculate Travel Distance to Victoria Care Center

Add your location

Address

Compare Nursing Homes around Ventura County

The information below is reported by the California Department of Social Services and Department of Public Health.

4 facilities compared · CMS & CA Dept. of Health data

Ventura Post Acute
NH
HC
Ventura
71
Facility 71
CA AVG 103
Rank #998 / 1657
91.2%
Facility 91.2%
CA AVG 84.7%
Rank #290 / 1537
+8%
4.80
Facility 4.80
CA AVG 4.22
Rank #60 / 354
-34%+14%
$0
Facility $0
CA AVG $56.5k
Rank #1 / 362
-
18
Facility 18
CA AVG 50.2
Rank #33 / 361
3.0
Facility 3.0
CA AVG 4.6
Rank #65 / 361
165-
65
Facility 65
CA AVG 57
Rank #888 / 2092
-
$11.2M
Facility $11.2M
CA AVG $17.0M
Rank #274 / 355
$7.0M
Facility $7.0M
CA AVG $7.0M
Rank #211 / 355
62.5%
Facility 62.5%
CA AVG 45.2%
Rank #21 / 355
55719
Victoria Care Center
NH
MC
Ventura
188
Facility 188
CA AVG 103
Rank #187 / 1657
90.8%
Facility 90.8%
CA AVG 84.7%
Rank #298 / 1537
+7%
4.11
Facility 4.11
CA AVG 4.22
Rank #160 / 354
-3%-3%
$0
Facility $0
CA AVG $56.5k
Rank #1 / 362
-
28
Facility 28
CA AVG 50.2
Rank #100 / 361
1.8
Facility 1.8
CA AVG 4.6
Rank #5 / 361
-180-
65
Facility 65
CA AVG 57
Rank #888 / 2092
Puente Partners LLC
$28.0M
Facility $28.0M
CA AVG $17.0M
Rank #34 / 355
$16.1M
Facility $16.1M
CA AVG $7.0M
Rank #23 / 355
57.4%
Facility 57.4%
CA AVG 45.2%
Rank #192 / 355
555478
Coastal View Healthcare Center
NH
HC
Ventura
96
Facility 96
CA AVG 103
Rank #804 / 1657
88.1%
Facility 88.1%
CA AVG 84.7%
Rank #374 / 1537
+4%
3.78
Facility 3.78
CA AVG 4.22
Rank #229 / 354
+9%-11%
$8.3k
Facility $8.3k
CA AVG $56.5k
Rank #226 / 362
-
37
Facility 37
CA AVG 50.2
Rank #155 / 361
3.4
Facility 3.4
CA AVG 4.6
Rank #107 / 361
188-
65
Facility 65
CA AVG 57
Rank #888 / 2092
Global Skilled LLC
$16.8M
Facility $16.8M
CA AVG $17.0M
Rank #176 / 355
$9.8M
Facility $9.8M
CA AVG $7.0M
Rank #106 / 355
58.4%
Facility 58.4%
CA AVG 45.2%
Rank #46 / 355
55566
Oxnard Manor Healthcare Center
NH
Oxnard (Fremont North)
82
Facility 82
CA AVG 103
Rank #901 / 1657
86.9%
Facility 86.9%
CA AVG 84.7%
Rank #409 / 1537
+3%
3.70
Facility 3.70
CA AVG 4.22
Rank #245 / 354
-10%-12%
$0
Facility $0
CA AVG $56.5k
Rank #1 / 362
-
45
Facility 45
CA AVG 50.2
Rank #204 / 361
2.8
Facility 2.8
CA AVG 4.6
Rank #50 / 361
-79-
67
Facility 67
CA AVG 57
Rank #830 / 2092
Oxnard Healthcare & Wellness Centre, LP
$10.6M
Facility $10.6M
CA AVG $17.0M
Rank #165 / 355
$6.9M
Facility $6.9M
CA AVG $7.0M
Rank #216 / 355
64.9%
Facility 64.9%
CA AVG 45.2%
Rank #250 / 355
56379

Financial Assistance for
Nursing Home in California

Victoria Care Center is located in Ventura, California.
Here are the financial assistance programs available to residents in California.

Get Financial aid guidance

Multipurpose Senior Services Program

MSSP (Medi-Cal Waiver)

Age 65+
General California resident, Medi-Cal eligible, nursing home risk.
Income Limits (2025) ~$2,829/month 300% FBR, individual
Asset Limits $2,000 (individual), $3,000 (couple).
CA

County-managed; waitlists possible.

Benefits
In-home support (4-6 hours/day) Respite care (14 days/year) Meals (~$6/meal) Transportation (8 trips/month) Care management

In-Home Supportive Services (IHSS)

California IHSS

Age 65+
General California resident, Medicaid-eligible or low-income.
Income Limits ~$1,732/month individual, Medi-Cal threshold
Asset Limits $2,000 individual
CA

Can hire family as caregivers.

Benefits
Personal care (up to 283 hours/month) Homemaker services Respite (varies)

Multipurpose Senior Services Program (MSSP)

CA MSSP

Age 65+
General California resident, Medi-Cal-eligible, nursing home-eligible but community-capable.
Income Limits ~$2,829/month 300% FBR, individual
Asset Limits $2,000 individual
CA

Available in 38 counties; waitlists common.

Benefits
Case management Respite care (up to 10 days/year) Minor home mods (avg. $500) Adult day care (~$50/day)

Property Tax Postponement Program (PTP)

CA PTP

Age 62+
General California resident, own and live in home, 40% equity.
Income Limits (2025) ~$51,500/year household, adjusted annually
Asset Limits Equity-based; no strict asset cap.
CA

Deferred taxes accrue interest (5% as of 2024); repaid upon sale/death.

Benefits
Property tax deferral (avg. $1,000-$3,000/year, varies by county)

Assisted Living Waiver (ALW)

CA ALW

Age 65+ or disabled
General California resident, Medi-Cal-eligible, nursing home-eligible.
Income Limits ~$2,829/month 300% FBR, individual
Asset Limits $2,000 individual
CA

Available in 15 counties (e.g., LA, Sacramento); waitlists common.

Benefits
Personal care in ALFs (5-7 hours/day) Medication management Social services

California CARES Program

CA CARES

Age
General Caregivers of California residents 60+ needing help with 3+ daily activities; no caregiver age limit.
Income Limits No strict limit; cost-sharing above ~$2,500/month threshold.
Asset Limits Not applicable; need-based.
CA

High demand in urban areas; complements IHSS respite.

Benefits
Respite care (up to 10 days/year) Counseling (4-6 sessions/year) Training (2-3 workshops/year) Supplies (~$200/year)

Frequently Asked Questions about Victoria Care Center

Is Victoria Care Center in a walkable area?

Victoria Care Center has a walk score of 65. Moderately walkable. Some errands can be accomplished on foot, with a mix of nearby amenities.

What is the occupancy rate at Victoria Care Center?

Victoria Care Center's occupancy is 90.8%.

Does Victoria Care Center operate as a for-profit or non-profit?

Victoria Care Center is registered as a for-profit.

Are there photos of Victoria Care Center?

Yes — there are 16 photos of Victoria Care Center in the photo gallery on this page.

What is the address of Victoria Care Center?

Victoria Care Center is located at 5445 Everglades St, Ventura, CA 93003.

What is the phone number of Victoria Care Center?

(805) 644-7161 will put you in contact with the team at Victoria Care Center.

Is Victoria Care Center Medicare or Medicaid certified?

Yes — Victoria Care Center is a CMS-certified provider of Medicare and Medicaid.

Guides for Better Senior Living

Care Cost Calculator: See Prices in Your Area

Nursing Home Data Explorer

Don’t Wait Too Long: 7 Red Flag Signs Your Parent Needs Assisted Living Now

The True Cost of Assisted Living in 2025 – And How Families Are Paying For It

Understanding Senior Living Costs: Pricing Models, Discounts & Financial Assistance