Oasis House
Nursing Home & Assisted Living · Colorado, CO
CMS overall rating Info CMS (the Centers for Medicare & Medicaid Services) is the federal agency that rates nursing home quality. Its Overall Rating runs from 1 to 5 stars, combining health inspections, staffing, and quality measures, with inspections weighted most heavily.

Oasis House

Nursing Home & Assisted Living · Colorado, CO
CMS overall rating Info CMS (the Centers for Medicare & Medicaid Services) is the federal agency that rates nursing home quality. Its Overall Rating runs from 1 to 5 stars, combining health inspections, staffing, and quality measures, with inspections weighted most heavily.
Calculator: See prices in your area
Oasis House accepts Medicare, Medicaid, and private pay.

Overview of Oasis House

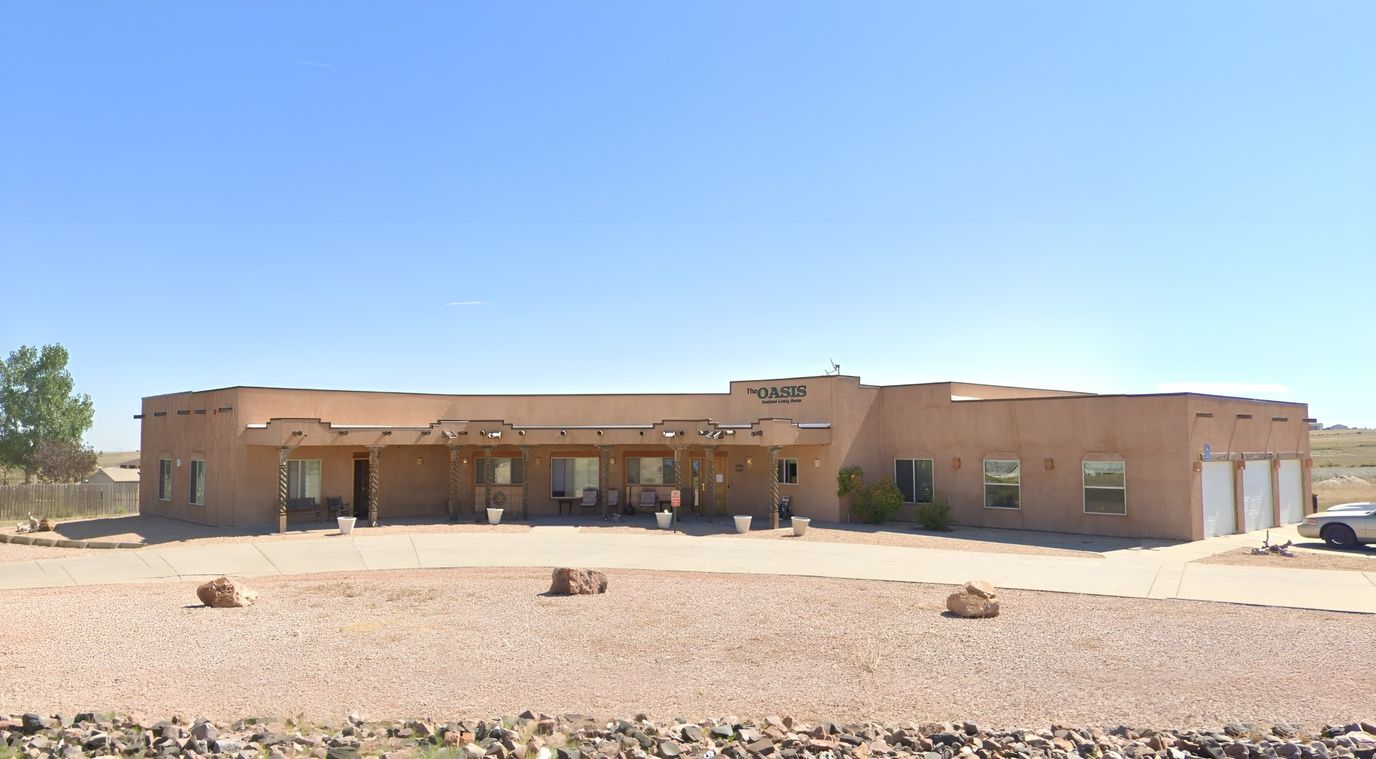
Peacefully nestled in the harmonious setting of Pueblo, CO, Oasis House is an idyllic haven in Pueblo West, CO, offering assisted living. Here, residents can ease their worries with a compassionate and well-trained team helping with their daily living activities and personal needs 24/7. The community strives to maintain residents’ independence without hassles, helping with housekeeping and laundry.

A thoughtfully curated calendar of engaging activities and fun programs is conducted, encouraging residents to live actively and maintain social connections. Mealtimes foster comfort and meet dietary needs with delicious and well-balanced dining options. Residents are guaranteed the finest retirement experience amidst the community’s nurturing and welcoming environment.

(719) 547-3109

Quality ratings

Measured by Centers for Medicare & Medicaid Services (CMS)

Overall rating Info The Overall CMS Rating combines results from health inspections, staffing levels and quality measures. Health inspections carry the most weight. Staffing and quality scores can increase or decrease the final rating based on performance compared to state and national standards.
▼ 36.4% Below CO avg. ▼ 36.4% Below CO avg.CO average: 3.1Click the badge to see the full State ranking.Click here to see the full State ranking.
Health Inspection Info Based on the results of the facility's three most recent standard inspections and any complaint investigations. CMS reviews the number, scope, and severity of deficiencies, with more recent findings weighted more heavily.
▼ 63.9% Below CO avg. ▼ 63.9% Below CO avg.CO average: 2.8Click the badge to see the full State ranking.Click here to see the full State ranking.
Staffing Info Measures average nursing staff hours per resident per day, including Registered Nurses (RNs) and total nursing staff. Ratings are adjusted based on the level of care residents require and are compared to state and national benchmarks.
At CO avg. At CO avg.CO average: 3.0Click the badge to see the full State ranking.Click here to see the full State ranking.
Quality Measures Info Based on clinical and physical health indicators reported to CMS, such as hospital readmissions, falls, pressure ulcers, and improvements in mobility. These measures reflect how well residents' health needs are being managed.
▲ 20.5% Above CO avg. ▲ 20.5% Above CO avg.CO average: 4.1Click the badge to see the full State ranking.Click here to see the full State ranking.

Staffing hours breakdown

Info Daily nursing hours per resident by staff type, reported to CMS. Higher is generally better — compare this facility to state and national averages to see where staffing stands.

Hours per resident per day — compared to Colorado state averages

Total nursing care / resident Info This home is ranked 88th out of 215 homes in Colorado for nurse hours. Total adjusted nursing hours per resident per day, combining RN, LPN, and aide time. CMS adjusts this for case-mix so facilities can be fairly compared.
3h 49m per day
Rank #88 / 215Nurse hours — State benchmarkedThis home is ranked 88th out of 215 homes in Colorado. Shows adjusted nurse hours per resident per day benchmarked to the Colorado average, with a ranking across 215 Colorado facilities. More hours mean more direct care. The national average is about 3.5 hrs; below 3.0 is a red flag.Rankings are based only on facilities in Colorado that report data for that category. Facilities without available data are excluded from the ranking.Click the rank badge to see the full State ranking.Click here to see the full State ranking.
This facility Colorado avg (3h 52m per day)
vs Colorado avg
-1%

5 of 6 metrics below state avg

Standout metric LPN / LVN is +16% above state avg
Staff typeHours / Day / Residentvs state avg
Registered Nurse (RN) Info RNs hold the highest nursing license and can assess residents, interpret test results, and direct care plans. More RN hours per day often signals stronger clinical oversight and faster response to health changes. 35m per day ▼ 28% State avg: 49m per day · National avg: 41m per day
LPN / LVN Info Licensed Practical Nurses (LPNs) or Licensed Vocational Nurses (LVNs) deliver routine hands-on care — medication administration, wound dressing, and monitoring vital signs. They work under RN supervision and make up a large share of daily bedside care. 48m per day ▲ 16% State avg: 41m per day · National avg: 52m per day
Nurse Aide Info Certified Nurse Aides (CNAs) provide the most direct day-to-day assistance: bathing, dressing, feeding, and mobility. Nurse aide hours are typically the largest staffing category and directly affect residents' quality of life. 1h 47m per day ▼ 18% State avg: 2h 11m per day · National avg: 2h 20m per day
Weekend Total Nursing Info Combined nursing hours (RN + LPN + Nurse Aide) per resident per day on weekends. Staffing often drops on weekends — this figure reveals whether the facility maintains adequate coverage outside of weekday hours. 2h 48m per day ▼ 15% State avg: 3h 16m per day · National avg: 3h 27m per day
Physical Therapist Info Hours per resident per day provided by licensed Physical Therapists (PTs) or PT Assistants. PT services help residents recover mobility after injury or illness and are especially important for post-acute (short-stay) rehabilitation. 4m per day ▼ 23% State avg: 5m per day · National avg: 4m per day
Weekend RN Info Registered nurse hours specifically on weekends. Facilities sometimes reduce RN presence on Saturdays and Sundays — a low weekend RN figure compared to weekday hours can indicate reduced clinical oversight when most administrative staff are absent. 26m per day ▼ 28% State avg: 36m per day · National avg: 29m per day

Capacity and availability

This home usually has availability

Lower occupancy than the Colorado average: 76.5%
Occupancy rate
74.1% Rank #132 / 221Occupancy rate — State benchmarkedThis home is ranked 132nd out of 221 homes in Colorado. Shows this facility's occupancy rate versus the Colorado average, with its Statewide rank out of 221. Higher occupancy signals strong local demand and financial stability.Rankings are based only on facilities in Colorado that report data for that category. Facilities without available data are excluded from the ranking.Click the rank badge to see the full State ranking.Click here to see the full State ranking.
Avg. Length of Stay
225 days
Walk Score
Walk Score: 4 / 100 Rank #833 / 872Walk Score — State benchmarkedThis home is ranked 833rd out of 872 homes in Colorado. Shows how walkable this facility's neighborhood is compared to the average Walk Score across Colorado facilities. Higher scores benefit residents, families, and staff.Rankings are based only on facilities in Colorado that report data for that category. Facilities without available data are excluded from the ranking.Click the rank badge to see the full State ranking.Click here to see the full State ranking.
Car-dependent. Most errands require a car, with limited nearby walkable options.

About this community

License Details

Facility TypeAssisted Living Residence
StatusPending
CountyPueblo

Contact Oasis House

Health Inspection History

Inspections since 2019
Total health inspections 11

Colorado average 4.8


Last Health inspection on May 2025

Total health citations
56 Rank #215 / 221Health citations — State benchmarkedThis home is ranked 215th out of 221 homes in Colorado. Shows this facility's total health deficiency citations benchmarked to the Colorado State average, with a ranking across all 221 CO facilities. Lower citation counts earn a better rank.Rankings are based only on facilities in Colorado that report data for that category. Facilities without available data are excluded from the ranking.Click the rank badge to see the full State ranking.Click here to see the full State ranking.

Colorado average 24.8

Citations per inspection
5.09 Rank #115 / 221Citations per inspection — State benchmarkedThis home is ranked 115th out of 221 homes in Colorado. Shows average deficiency citations per CMS inspection for this facility versus the Colorado mean across 221 facilities with citation data. Lower is better.Rankings are based only on facilities in Colorado that report data for that category. Facilities without available data are excluded from the ranking.Click the rank badge to see the full State ranking.Click here to see the full State ranking.

Colorado average 5.2


Health citations are formal notices following inspections when they fail to comply with safety and care standards.

34 of 56 citations resulted from standard inspections; 18 of 56 resulted from complaint investigations; and 4 of 56 came from combined inspections (standard and complaint).

Breakdown of citation severity (last 7 years)
Critical health citations
1
150% worse than Colorado average

Colorado average: 0.4


Serious health citations
4
90% worse than Colorado average

Colorado average: 2.1

1 critical citation Colorado average: 0.4

4 serious citations Colorado average: 2.1

50 moderate citations Colorado average: 22.2

1 minor citation Colorado average: 0.2
Citations history (last 7 years)
Abuse/Neglect moderate citation May 08, 2025
Corrected

Abuse/Neglect moderate citation Jul 09, 2024
Corrected

Infection Control moderate citation May 15, 2024
Corrected

Quality of Care serious citation May 15, 2024
Corrected

Staffing Data

Reporting period: October 1 – December 31, 2025 (Q4 2025). Source: CMS Payroll-Based Journal report.

Total staff 202
Employees 59
Contractors 143
Staff to resident ratio 2.53 : 1
34% more staff per resident than Colorado average
Colorado average ratio: 1.88 : 1 Colorado average ratio: 1.88 : 1See full Colorado ranking
Avg staff/day 33
Average shift 8.7 hours
5% better than Colorado average
Colorado average: 8.3 hours Colorado average shift: 8.3 hoursSee full Colorado ranking
Total staff hours (quarter) 26,563

Nursing staff breakdown

Q4 2025 · Oct 1 – Dec 31 More info This data comes from the CMS Payroll-Based Journal report covering October 1 – December 31, 2025.
Registered Nurse

Manages medical care and health needs.

RN Staff Info 21 total: 6 full-time employees and 15 contractors. 21
Average shift length Info Average shift length. Calculated as total hours divided by days worked and average staff per day. 9.2 hours
Licensed Practical Nurse

Assists with medical care and medications.

LPN Staff Info 47 total: 9 full-time employees and 38 contractors. 47
Average shift length Info Average shift length. Calculated as total hours divided by days worked and average staff per day. 9 hours
Certified Nursing Assistant

Helps with daily care and mobility.

CNA Staff Info 116 total: 26 full-time employees and 90 contractors. 116
Average shift length Info Average shift length. Calculated as total hours divided by days worked and average staff per day. 9.2 hours

Contractor staffing

Q4 2025 · Oct 1 – Dec 31 More info This data comes from the CMS Payroll-Based Journal report covering October 1 – December 31, 2025.

Total hours from contractors

30.9%

8,210 contractor hours this quarter

Certified Nursing Assistant: 90 Licensed Practical Nurse: 38 Registered Nurse: 15

Staff by category

Q4 2025 · Oct 1 – Dec 31 More info This data comes from the CMS Payroll-Based Journal report covering October 1 – December 31, 2025.
Certified Nursing Assistant269011611,91192100%9.2
Licensed Practical Nurse938474,82892100%9
Registered Nurse615213,28192100%9.2
Other Dietary Services Staff4041,2128693%7.8
Dental Services Staff2029836470%8
Administrator1015126470%8
Clinical Nurse Specialist1015126470%8
RN Director of Nursing1015126470%8
Speech Language Pathologist1015126470%8
Physical Therapy Aide1014826166%7.9
Respiratory Therapy Technician1014376065%7.3
Dietitian2023844852%8
Occupational Therapy Aide1013334549%7.4
Qualified Social Worker1013284751%7
Physical Therapy Assistant1011793134%5.8
Nurse Practitioner1011582123%7.5
116 Certified Nursing Assistant
% of Days 100%
47 Licensed Practical Nurse
% of Days 100%
21 Registered Nurse
% of Days 100%
4 Other Dietary Services Staff
% of Days 93%
2 Dental Services Staff
% of Days 70%
1 Administrator
% of Days 70%
1 Clinical Nurse Specialist
% of Days 70%
1 RN Director of Nursing
% of Days 70%
1 Speech Language Pathologist
% of Days 70%
1 Physical Therapy Aide
% of Days 66%
1 Respiratory Therapy Technician
% of Days 65%
2 Dietitian
% of Days 52%
1 Occupational Therapy Aide
% of Days 49%
1 Qualified Social Worker
% of Days 51%
1 Physical Therapy Assistant
% of Days 34%
1 Nurse Practitioner
% of Days 23%

Penalties and fines

Includes penalties issued in 2024

Federal penalties imposed by CMS for regulatory violations, including civil money penalties (fines) and denials of payment for new Medicare/Medicaid admissions.

Source: CMS Penalties Database (Data as of Jan 2026)

Total fines amount $78K Rank #201 / 221Federal fines — State benchmarkedThis home is ranked 201st out of 221 homes in Colorado. Shows this facility's cumulative CMS federal fine dollars versus the Colorado average among facilities with fines, and where it ranks among 221 facilities in the pool. Lower total dollars mean a better rank.Rankings are based only on facilities in Colorado that report data for that category. Facilities without available data are excluded from the ranking.Click the rank badge to see the full State ranking.Click here to see the full State ranking.
96% higher than Colorado average

Colorado average: $40K

Number of fines 3
35% more fines than Colorado average

Colorado average: 2.2

Payment Denials Info Serious action where Medicare and/or Medicaid temporarily stops payments for new residents until issues are fixed. 1
276% more payment denials than Colorado average

Colorado average: 0.3

Fines amount comparison
This facility $78K
Colorado average $40K
Penalty History

Penalties are imposed by CMS for violations of federal nursing home regulations.

3 penalties in the past 3 years

Multiple penalties were reported in the last 3 years.

Civil Money Penalty Info Fines imposed for noncompliance, which can be assessed per day or per instance of violation. May 15, 2024
$29K
Civil Money Penalty Info Fines imposed for noncompliance, which can be assessed per day or per instance of violation. Jan 11, 2024
$39K
Payment Denial Info Serious action where Medicare and/or Medicaid temporarily stops payments for new residents until issues are fixed. Jan 11, 2024
37 days

Last updated: Jan 2026

Quality of care over time

These measures show how residents usually do over time at this home, based on health outcomes and preventive care.

High-risk clinical events score Info A composite score based on pressure ulcers, falls with injury, weight loss, walking ability decline, and activities of daily living decline. 4.5
50% better than Colorado average

Colorado average: 9.0

Functional decline score Info A composite score based on activities of daily living decline, walking ability decline, and incontinence. 9.9
47% better than Colorado average

Colorado average: 18.8

Long-stay resident measures
Need for Help with Daily Activities Increased Info Percent of long-stay residents whose need for help with daily activities has increased 4.0%
75% better than Colorado average

Colorado average: 16.0%

Walking Ability Worsened Info Percent of long-stay residents whose ability to move independently worsened 7.7%
55% better than Colorado average

Colorado average: 17.0%

Low Risk Residents with Bowel/Bladder Incontinence Info Percent of low risk long-stay residents who lose control of their bowels or bladder 18.0%
23% better than Colorado average

Colorado average: 23.2%

Falls with Major Injury Info Percent of long-stay residents experiencing one or more falls with major injury 1.2%
64% better than Colorado average

Colorado average: 3.3%

High Risk Residents with Pressure Ulcers Info Percent of long-stay high risk residents with pressure ulcers 7.2%
84% worse than Colorado average

Colorado average: 3.9%

Urinary Tract Infection Info Percent of long-stay residents with a urinary tract infection 0.8%
43% better than Colorado average

Colorado average: 1.4%

Lost Too Much Weight Info Percent of long-stay residents who lose too much weight 2.3%
57% better than Colorado average

Colorado average: 5.2%

Depressive Symptoms Info Percent of long-stay residents who have depressive symptoms 4.7%
35% better than Colorado average

Colorado average: 7.2%

Antipsychotic Use Info Percent of long-stay residents who received an antipsychotic medication 20.5%
9% worse than Colorado average

Colorado average: 18.8%

Pneumococcal Vaccine Info Percent of long-stay residents assessed and appropriately given the pneumococcal vaccine 92.4%
In line with Colorado average

Colorado average: 93.3%

Influenza Vaccine Info Percent of long-stay residents assessed and appropriately given the seasonal influenza vaccine 100.0%
6% better than Colorado average

Colorado average: 94.7%

Short-stay resident measures
Pneumococcal Vaccine Info Percent of short-stay residents assessed and appropriately given the pneumococcal vaccine 63.5%
17% worse than Colorado average

Colorado average: 76.6%

Influenza Vaccine Info Percent of short-stay residents assessed and appropriately given the seasonal influenza vaccine 75.0%
In line with Colorado average

Colorado average: 75.6%

Breakdown by payment type

Medicare

7% of new residents, usually for short-term rehab.

Typical stay 2 - 3 months

Private pay

27% of new residents, often for short stays.

Typical stay 4 - 5 months

Medicaid

66% of new residents, often for long-term daily care.

Typical stay 8 - 9 months

Facility Characteristics

Source: CMS Long-Term Care Facility Characteristics (Data as of Jan 2026)

Total residents 80
Medicare
4
5% of residents
Medicaid
75
93.8% of residents
Private pay or other
1
1.3% of residents
Programs & Services
Residents Group

Residents meet regularly to discuss policies, care quality, and activities

Active Resident Council

Organized group of residents that meets regularly to discuss facility policies, quality of life, and activities.

Finances and operations

Based on CMS SNF Cost Report for fiscal year ending in 12/2023.

Privately-owned community
Operated by a single business entity.
Net patient revenue Info Net patient revenue — what the home actually collects for resident care, after contractual allowances, bad debt and discounts are subtracted from its gross charges (CMS cost report, Worksheet G-3). It covers resident care only; money the home earns from other sources is shown separately as "Other income."
$8.2M
Net patient income Info Net patient income: net patient revenue minus the home's total operating expenses. A positive figure means it earns more from resident care than it spends to deliver it; a negative figure means the opposite. It excludes non-operating "other income."
$203.0K
Privately-owned community Operated by a single business entity.
Net patient revenue Info Net patient revenue — what the home actually collects for resident care, after contractual allowances, bad debt and discounts are subtracted from its gross charges (CMS cost report, Worksheet G-3). It covers resident care only; money the home earns from other sources is shown separately as "Other income."
$8.2M Rank #160 / 221Revenue — State benchmarkedThis home is ranked 160th out of 221 homes in Colorado. Shows this facility's annual revenue compared to the Colorado average. Higher revenue generally means more resources for staffing and capital — read alongside Payroll %.Rankings are based only on facilities in Colorado that report data for that category. Facilities without available data are excluded from the ranking.Click the rank badge to see the full State ranking.Click here to see the full State ranking.
Net patient income Info Net patient income: net patient revenue minus the home's total operating expenses. A positive figure means it earns more from resident care than it spends to deliver it; a negative figure means the opposite. It excludes non-operating "other income."
$203.0K
Other income Info Money the home earns outside of resident care — such as investments, grants, rentals and other non-operating sources (CMS cost report, Worksheet G-3). It is tracked separately from net patient revenue: it is not part of that figure, and it is not included in net patient income.
$978
Payroll costs Info Staff salaries plus wage-related costs — benefits such as payroll taxes, health insurance and retirement — from the home's own accounting records (CMS cost report, Worksheet A). Contract or agency labor is counted separately, under other operating costs. Rank #140 / 221Payroll — State benchmarkedThis home is ranked 140th out of 221 homes in Colorado. Shows total annual staff payroll benchmarked to the Colorado average. Higher payroll investment relative to peers often signals better staffing and less reliance on cheaper contract labor.Rankings are based only on facilities in Colorado that report data for that category. Facilities without available data are excluded from the ranking.Click the rank badge to see the full State ranking.Click here to see the full State ranking.
$3.1M 38.2% of net patient revenue Info Payroll as a share of revenue: staff salaries and wage-related benefits divided by net patient revenue. A higher figure means more of each revenue dollar goes to staff pay. Rank #61 / 221Payroll % — State benchmarkedThis home is ranked 61st out of 221 homes in Colorado. Shows payroll as a percentage of revenue versus the Colorado average. Well-run Colorado facilities typically land around 59–66% — the top third Statewide. Below 25% may signal understaffing or heavy agency use — read with Staffing ratings.Rankings are based only on facilities in Colorado that report data for that category. Facilities without available data are excluded from the ranking.Click the rank badge to see the full State ranking.Click here to see the full State ranking.
Other operating costs Info Everything it costs to run the home apart from payroll — food, utilities, supplies, maintenance, contract labor and administration. Calculated as total operating expense minus payroll (staff salaries and wage-related benefits).
$4.9M
Total costs Info The home's total operating expense for the year — all the costs of running it, salaries included (CMS cost report, Worksheet G-3).
$8.0M

What does this home offer?

Housing options icon

Housing Options: Semi-Private Rooms

Building type icon
Building type icon

Building Type: Single-story

Housekeeping icon
Housekeeping icon

Housekeeping Services

Social and recreational activities icon

Social and Recreational Activities

Who this home usually serves

TYPE OF STAY

Mostly long-term care residents

Most residents stay for extended periods and receive ongoing daily care.

Most new residents arrive under Medicaid (66% of admissions), and a typical Medicaid stay runs around 8 - 9 months.

Admissions
112 total

Coverage residents most often arrive under.

Medicare 7%
Private pay 27%
Medicaid 66%
Discharges
111 total

Coverage residents most often leave under.

Medicare 18%
Private pay 24%
Medicaid 58%

Places of interest near Oasis House

Address 10.1 miles from city center Info Estimated distance in miles from Pueblo's city center to Oasis House's address, calculated via Google Maps.

Calculate Travel Distance to Oasis House

Add your location

Address

Compare Nursing Homes around Colorado

The information below is reported by the Colorado Department of Public Health and Environment, Health Facilities Division.

5 facilities compared · CMS & CO Dept. of Health data

Frasier Retirement Community
NH
AL
IL
Boulder (Frasier Meadows)
54
Facility 54
CO AVG 76
Rank #343 / 533
92.5%
Facility 92.5%
CO AVG 76.5%
Rank #25 / 221
+21%
5.03
Facility 5.03
CO AVG 3.86
Rank #21 / 215
+49%+30%
$49.2k
Facility $49.2k
CO AVG $39.2k
Rank #188 / 221
7
Facility 7
CO AVG 24.8
Rank #13 / 221
2.3
Facility 2.3
CO AVG 5.2
Rank #10 / 221
248A+
65
Facility 65
CO AVG 51
Rank #301 / 872
Nikki Lewis
$9.0M
Facility $9.0M
CO AVG $11.2M
Rank #2 / 221
$14.7M
Facility $14.7M
CO AVG $4.9M
Rank #4 / 221
163%
Facility 163%
CO AVG 46.6%
Rank #214 / 221
65324
Peaks Care Center
NH
AL
IL
Longmont (Coffman Street)
92
Facility 92
CO AVG 76
Rank #192 / 533
80.1%
Facility 80.1%
CO AVG 76.5%
Rank #98 / 221
+5%
3.50
Facility 3.50
CO AVG 3.86
Rank #117 / 215
+41%-9%
$0
Facility $0
CO AVG $39.2k
Rank #1 / 221
22
Facility 22
CO AVG 24.8
Rank #100 / 221
4.4
Facility 4.4
CO AVG 5.2
Rank #86 / 221
179A+
80
Facility 80
CO AVG 51
Rank #108 / 872
Bogie33
$8.3M
Facility $8.3M
CO AVG $11.2M
Rank #115 / 221
$4.3M
Facility $4.3M
CO AVG $4.9M
Rank #151 / 221
51.4%
Facility 51.4%
CO AVG 46.6%
Rank #171 / 221
65189
Liberty Heights
NH
AL
IL
MC
RC
Colorado Springs (Northgate)
60
Facility 60
CO AVG 76
Rank #303 / 533
95.2%
Facility 95.2%
CO AVG 76.5%
Rank #8 / 221
+24%
4.51
Facility 4.51
CO AVG 3.86
Rank #32 / 215
+17%+17%
$39.0k
Facility $39.0k
CO AVG $39.2k
Rank #172 / 221
13
Facility 13
CO AVG 24.8
Rank #35 / 221
4.3
Facility 4.3
CO AVG 5.2
Rank #76 / 221
-38-
40
Facility 40
CO AVG 51
Rank #574 / 872
Ccrc Ops Mb1-T LLC
$18.7M
Facility $18.7M
CO AVG $11.2M
Rank #57 / 221
$8.7M
Facility $8.7M
CO AVG $4.9M
Rank #41 / 221
46.4%
Facility 46.4%
CO AVG 46.6%
Rank #68 / 221
65305
Brookdale Greenwood Village
NH
AL
IL
MC
Greenwood Village
90
Facility 90
CO AVG 76
Rank #198 / 533
87.6%
Facility 87.6%
CO AVG 76.5%
Rank #64 / 221
+15%
3.96
Facility 3.96
CO AVG 3.86
Rank #66 / 215
+4%+3%
$0
Facility $0
CO AVG $39.2k
Rank #1 / 221
25
Facility 25
CO AVG 24.8
Rank #129 / 221
6.3
Facility 6.3
CO AVG 5.2
Rank #160 / 221
-50B-
71
Facility 71
CO AVG 51
Rank #208 / 872
-
$18.1M
Facility $18.1M
CO AVG $11.2M
Rank #69 / 221
$10.6M
Facility $10.6M
CO AVG $4.9M
Rank #24 / 221
58.4%
Facility 58.4%
CO AVG 46.6%
Rank #10 / 221
65376
Oasis House
NH
AL
Pueblo (Pueblo West)
110
Facility 110
CO AVG 76
Rank #108 / 533
74.1%
Facility 74.1%
CO AVG 76.5%
Rank #132 / 221
-3%
3.81
Facility 3.81
CO AVG 3.86
Rank #88 / 215
-26%-1%
$77.7k
Facility $77.7k
CO AVG $39.2k
Rank #201 / 221
56
Facility 56
CO AVG 24.8
Rank #215 / 221
5.1
Facility 5.1
CO AVG 5.2
Rank #115 / 221
573-
4
Facility 4
CO AVG 51
Rank #833 / 872
Samuel Krommenhoek
$8.2M
Facility $8.2M
CO AVG $11.2M
Rank #160 / 221
$3.1M
Facility $3.1M
CO AVG $4.9M
Rank #140 / 221
38.2%
Facility 38.2%
CO AVG 46.6%
Rank #61 / 221
65191

Financial Assistance for
Nursing Home in Colorado

Oasis House is located in Pueblo, Colorado.
Here are the financial assistance programs available to residents in Colorado.

Get Financial aid guidance

Elderly, Blind, and Disabled Waiver

Colorado Medicaid EBD Waiver

Age 65+ or disabled
General Colorado resident, Medicaid- eligible, nursing home-level care need.
Income Limits (2025) ~$2,829/month 300% FBR, individual
Asset Limits $2,000 (individual), $3,000 (couple).
CO

Requires level-of-care assessment by case manager.

Benefits
Personal care (5-7 hours/day) Respite care (up to 240 hours/year) Adult day care ($65/day) Home modifications ($1,500 avg.)

Old Age Pension (OAP) Health Care Program

Colorado OAP

Age 60+
General Colorado resident.
Income Limits ~$1,215/month individual
Asset Limits $2,000 individual
CO

Supplements SSI; limited medical coverage.

Benefits
Cash (~$100-$800/month) Limited in-home care (2-3 hours/week) Medical assistance

Program of All-Inclusive Care for the Elderly (PACE)

Colorado Medicaid PACE

Age 55+
General Colorado resident, nursing home-level care need, safe with PACE support.
Income Limits (2025) ~$2,829/month 300% FBR
Asset Limits $2,000 (individual), $3,000 (couple).
CO

Limited to specific regions (e.g., Denver, Pueblo).

Benefits
All-inclusive care—personal care (5-7 hours/day) Meals Transportation Therapy Medical visits

Home Care Allowance (HCA)

Colorado Home Care Allowance (HCA)

Age
General Seniors typically 65+, Age 5+ with disability, Colorado resident, financial/functional need.
Income Limits (2025) ~$1,004/month individual, stricter than waivers
Asset Limits $2,000 (individual), $3,000 (couple).
CO

Must need help with ADLs; not Medicaid-waiver eligible.

Benefits
Personal care (~4-6 hours/day, paid to provider) E.g. Bathing Dressing

Frequently Asked Questions about Oasis House

What neighborhood is Oasis House in?

Oasis House is in the Pueblo West neighborhood of Pueblo.

Is Oasis House in a walkable area?

Oasis House has a walk score of 4. Car-dependent. Most errands require a car, with limited nearby walkable options.

What is the occupancy rate at Oasis House?

Oasis House's occupancy is 74.1%.

Are there photos of Oasis House?

Yes — there is 1 photo of Oasis House in the photo gallery on this page.

What is the address of Oasis House?

Oasis House is located at 972 S Purcell Blvd, Pueblo, CO 81001.

What is the phone number of Oasis House?

(719) 547-3109 will put you in contact with the team at Oasis House.

What county is Oasis House located in?

Oasis House is in Pueblo County.

Guides for Better Senior Living

Care Cost Calculator: See Prices in Your Area

Nursing Home Data Explorer

Don’t Wait Too Long: 7 Red Flag Signs Your Parent Needs Assisted Living Now

The True Cost of Assisted Living in 2025 – And How Families Are Paying For It

Understanding Senior Living Costs: Pricing Models, Discounts & Financial Assistance