Ocean Springs Health and Rehabilitation Center

Nursing Home

Ocean Springs Health and Rehabilitation Center

1199 Ocean Springs Rd, Ocean Springs, MS 39564 View Map
Nursing Home
icon
Care Cost Calculator: See Prices in Your Area Care Cost Calculator: See Prices in Your Area icon
Overview of Ocean Springs Health and Rehabilitation Center

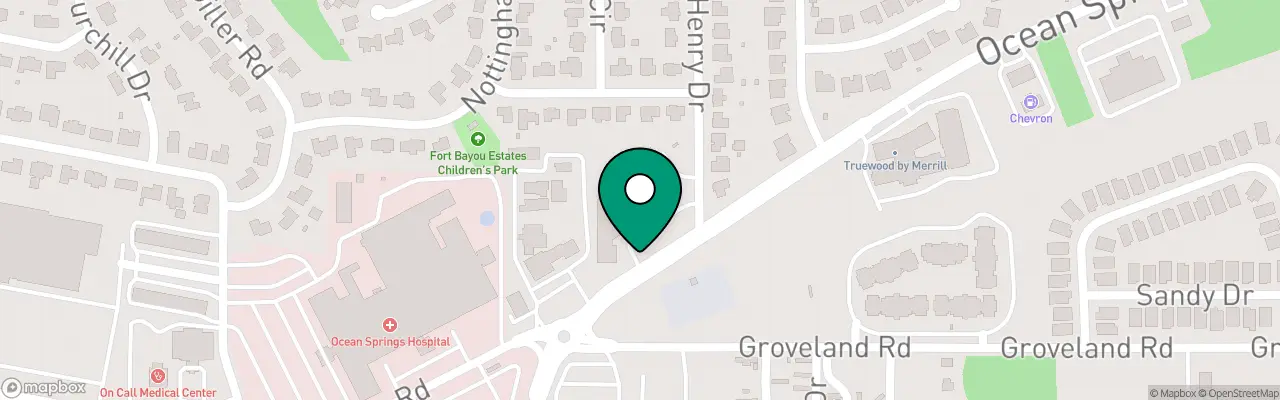
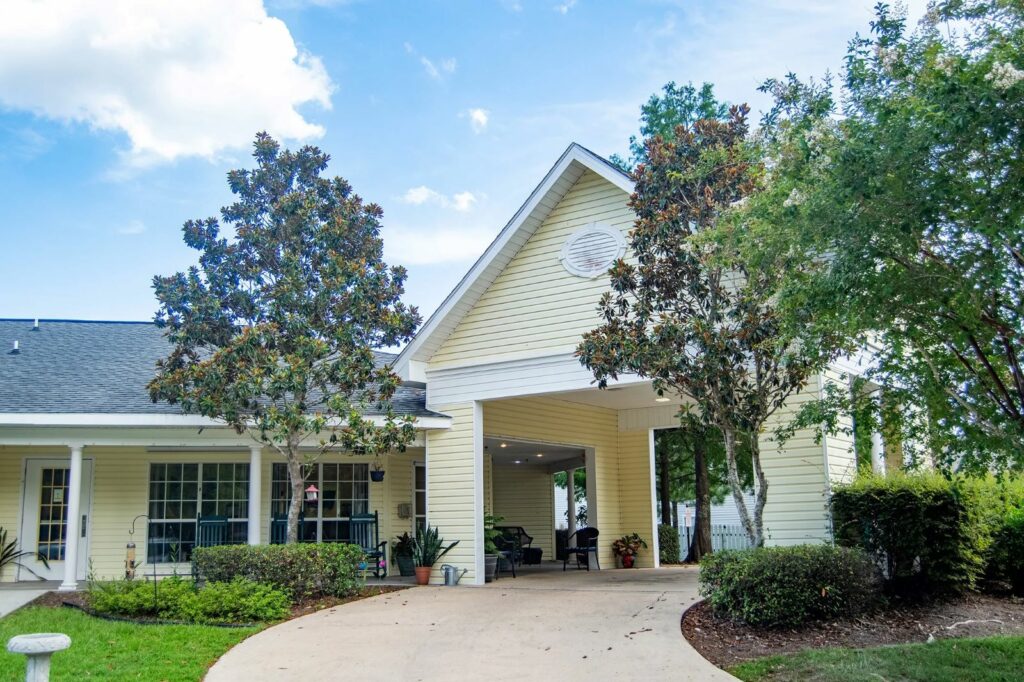
Ocean Springs Health and Rehabilitation Center offers an extensive array of services, encompassing comprehensive short-term rehabilitation, transitional care, and dedicated support for individuals with Alzheimer’s and dementia. Situated in the city of Biloxi, Mississippi, this assisted living community takes a prominent role as a distinguished senior healthcare service provider, with a specialization in post-acute care.

As a testament to their heartfelt dedication to their vocation, their staff at Ocean Springs Health and Rehabilitation Center operates from a deeply ingrained sense of purpose, tending to patients as if they were family.

(228) 875-9363

Quality ratings

Measured by Centers for Medicare & Medicaid Services (CMS)

Overall rating Info Official CMS rating based on health inspections, staffing and quality measures.
1/5
Mississippi average: 2.6/5
Health Inspection Info Official CMS rating based on deficiencies found during state health inspections.
2/5
Mississippi average: 2.8/5
Staffing Info Official CMS rating based on nurse staffing hours per resident per day.
1/5
Mississippi average: 3.5/5
Quality Measures Info Official CMS rating based on clinical outcomes for residents.
3/5
Mississippi average: 2.1/5

Nursing care per resident

Info Average daily nursing hours per resident (adjusted for acuity). Higher values indicate more nursing time per resident.
1h 19m per day

This home provides 72% less nursing time per resident than the state average.

Mississippi average: 4h 38m per day

Staffing hours breakdown

Info Hours of care per resident per day, broken down by staff type. Data from CMS Medicare.
Staff type Facility State avg National avg
Registered Nurse (RN) Info Registered nurse hours per resident per day. 34m per day 38m per day 41m per day
LPN / LVN Info Licensed Practical Nurse / Licensed Vocational Nurse hours per resident per day. 1h 2m per day 1h 5m per day 52m per day
Nurse Aide Info Nurse aide hours per resident per day. 2h 0m per day 2h 29m per day 2h 21m per day
Total Nursing (Weekend) Info Total number of nurse staff hours per resident per day on weekends. 3h 8m per day 3h 31m per day 3h 26m per day
Physical Therapist Info Physical therapist staff hours per resident per day. 1m per day 2m per day 4m per day
RN (Weekend) Info Registered nurse hours per resident per day on weekends. 25m per day 22m per day 29m per day

Capacity and availability

Medium-capacity home

Offers a balance of services and community atmosphere.

Total beds 115

This home usually has limited availability

Occupancy is moderate, suggesting balanced demand.

Similar demand to the Mississippi average
Occupancy rate 85.8%
Residents per day (avg) 99
Occupancy rate
85.8%
Residents per day (avg)
99

Who this home usually serves

TYPE OF STAY

Mostly long-term care residents

Most residents stay for extended periods and receive ongoing daily care.

Might be optimal for
Long-term daily care Ongoing support needs

Breakdown by payment type

Medicare

18% of new residents, usually for short-term rehab.

Typical stay 1 - 2 months

Private pay

32% of new residents, often for short stays.

Typical stay 1 - 2 months

Medicaid

50% of new residents, often for long-term daily care.

Typical stay 2 - 3 months

Finances and operations

Proprietary home
Other
Home revenue
$13.3M
Profit
$725.3K
Proprietary home Other
Home revenue
$13,333,109.00
Profit
$725,251.00
Payroll costs Info The portion of the home's budget spent on staff, including nurses, caregivers, and other employees who support care and operations.
$4.7M
34.9% of revenue
Other operating costs Info All remaining costs needed to run the home, such as food, utilities, building maintenance, supplies and administrative expenses.
$8.0M
Total costs $12.6M
Bed community size
115-bed community
A larger shared setting that may offer more common spaces and organized community services.
Walk Score
Walk Score: 41 / 100
Somewhat walkable. A few nearby services may be reachable on foot, but most trips require transportation.

About this community

Occupancy Rate
93%
Occupied Beds
107 of 115
Percentage of available beds currently in use by residents.
Facility Type
Nursing Home Facility

Additional licensing details

County: Jackson

Ownership & operating entity

Ocean Springs Health and Rehabilitation Center is legally operated by MS HUD Ocean Springs,, and administrated by LLC James T. Williams.

Care Services

Provides Assisted Living
Offers Alzheimer's Care
Nursing Services
Rehabilitation Services
Memory Care
Skilled Nursing
Licensed Nurses/CNAs
24-Hour Staffing

Programs & Activities

Specific Programs
Skilled Nursing Care, Comprehensive Post-acute Care, Rehabilitation Therapy, Physical Therapy, Occupational Therapy, Speech Therapy, Long-term Care Services, Alzheimer's and Dementia Care
Operating Hours
Always Open 24 Hours

Types of Care at Ocean Springs Health and Rehabilitation Center

Skilled Nursing Memory Care
Contact Ocean Springs Health and Rehabilitation Center

Access & Eligibility

Ways to qualify for care at this community, including accepted programs and payment options.

Medicaid Accepted

This facility is certified for eligible Medicaid services.

Medicare Accepted

This facility is certified for eligible Medicare services.

Payment & Funding Options

Medicaid Medicare

Inspection History

In Mississippi, the State Department of Health, Bureau of Health Facilities Licensure conducts unannounced surveys to monitor facility compliance with health, safety, and resident rights laws.

76 visits/inspections

41 visits/inspections triggered by complaints

6 other visits

2 life safety inspections

Results

26 with issues

50 without issues

Latest inspection

Date:January 8, 2026
Type:Complaint Investigation

81 deficiencies

Deficiencies indicate regulatory issues. A higher number implies the facility had several areas requiring improvement.

Compare Nursing Homes around Biloxi

The information below is reported by the Mississippi State Department of Health, Bureau of Health Facilities Licensure.
River Chase Village
SNF

Nursing Homes 24/7 care needed

RC

Respite Care

Gautier
60
No
-
35
RIVER CHASE VILLAGE, INC.
90.5%
$7,040,521.00
$2,590,849.00
36.8%
50.60
2/5
4.0600
2/5
2/5
3/5
2
16
2
-6%
-12%
+10%
Pleasant Hills Community Living Center
SNF

Nursing Homes 24/7 care needed

Jackson
100
No
A+
30
OGLESBY, LANDA
85.0%
$10,048,862.00
$4,401,396.00
43.8%
79.50
2/5
4.0345
2/5
2/5
2/5
4
22
2
+2%
-13%
+3%
Ocean Springs Health and Rehabilitation Center
MC

Memory Care Specialized care for those with Memory Loss, Alzheimer's, or dementia, ensuring safety and support.

SNF

Nursing Homes 24/7 care needed

Ocean Springs
115
No
-
41
ALBERT, MICHAEL
85.8%
$12,832,907.00
$4,657,651.00
36.3%
99.40
1/5
1.3123
2/5
1/5
3/5
4
29
3
-19%
-72%
+4%

Places of interest near Ocean Springs Health and Rehabilitation Center

Address 7.5 miles from city center — 0.16 miles to nearest hospital (Ocean Springs Hospital - Singing River Health System)

Address 1199 Ocean Springs Rd, Ocean Springs, MS 39564

Calculate Travel Distance to Ocean Springs Health and Rehabilitation Center

Add your location

Address

Staffing Data

Source: CMS Payroll-Based Journal (Q2 2025)

133
Total Staff
112
Employees
21
Contractors
14,356
Total Hours (Quarter)
60
Avg Staff/Day
8
Avg Shift (hrs)
Nursing Staff Breakdown
Role Count Avg Shift (hrs) Uses Contractors?
Registered Nurse109.7 No
Licensed Practical Nurse229.3 No
Certified Nursing Assistant547.9 No
Staff by Category
Administration
2 staff
4.4hs shift avg
Nursing Staff
89 staff
8.4hs shift avg
Physicians & Practitioners
3 staff
8.3hs shift avg
Therapy Services
34 staff
7.4hs shift avg
Activities & Recreation
0 staff
0hs shift avg
Social Services
2 staff
6.1hs shift avg
Dietary Services
2 staff
7.7hs shift avg
Other Services
1 staff
8.8hs shift avg
Contractor Analysis
7.4%
of total hours from contractors
1,066 contractor hours this quarter
Physical Therapy Aide: 4 Qualified Social Worker: 2 Speech Language Pathologist: 6 Medical Director: 1 Physical Therapy Assistant: 4 Respiratory Therapy Technician: 4
Role Employees Contractors Total Staff Total Hours Days Worked % of Days Avg Shift (hrs)
Certified Nursing Assistant540545,69830100%7.9
Licensed Practical Nurse220222,79930100%9.3
Physical Therapist160162,19030100%7.5
Registered Nurse100101,05430100%9.7
RN Director of Nursing3034402377%7.7
Speech Language Pathologist0663512273%7.6
Clinical Nurse Specialist2022732170%8.5
Physical Therapy Aide0442552273%8
Mental Health Service Worker1011862170%8.8
Physical Therapy Assistant0441712480%6.9
Administrator1011682170%8
Nurse Practitioner1011682170%8
Dietitian1011632170%7.8
Other Dietary Services Staff1011522067%7.6
Respiratory Therapy Technician0441392377%5.5
Qualified Social Worker0221352273%6.1
Medical Director011162170%0.8

Health Inspection History

Inspections
Total health inspections 5

Mississippi average 4.4


Last Health inspection on Sep 2025

Total health citations 29
Citations per inspection
5.8

Health citations are formal notices following inspections when they fail to comply with safety and care standards.

24 of 29 citations resulted from standard inspections; 4 of 29 resulted from complaint investigations; and 1 of 29 came from combined inspections (standard and complaint).

Breakdown of citation severity (last 3 years)
Critical Health citations More info 2
100% worse than Mississippi average

Mississippi average: 1


Serious Health citations More info 1
9% better than Mississippi average

Mississippi average: 1.1

2 critical citations More info Mississippi average: 1

1 serious citation More info Mississippi average: 1.1

25 moderate citations More info Mississippi average: 14.6

1 minor citation More info Mississippi average: 0.3
Citations history (last 3 years)
Abuse/Neglect moderate citation Sep 11, 2025
Corrected

Administration moderate citation Sep 11, 2025
Corrected

Administration moderate citation Sep 11, 2025
Corrected

Infection Control moderate citation Sep 11, 2025
Corrected

Facility Characteristics

Source: CMS Long-Term Care Facility Characteristics (Data as of Jan 2026)

Ownership: For-Profit Corporation
Part of: Avardis
Resident Census by Payment Source
108 Total Residents
Medicare 33 (30.6%)
Medicaid 68 (63%)
Private Pay/Other 7 (6.5%)
Programs & Services
Residents' Group
Family Engagement

Active councils help families stay involved in care decisions and facility operations.

Quality of care over time

These measures show how residents usually do over time at this home, based on health outcomes and preventive care.

High-risk clinical events score Info A composite score based on pressure ulcers, falls with injury, weight loss, walking ability decline, and activities of daily living decline. 10.5
16% better than Mississippi average

Mississippi average: 12.4

Functional decline score Info A composite score based on activities of daily living decline, walking ability decline, and incontinence. 20.8
7% better than Mississippi average

Mississippi average: 22.3

Long-stay resident measures
Need for Help with Daily Activities Increased Info Percent of long-stay residents whose need for help with daily activities has increased 17.2%
19% better than Mississippi average

Mississippi average: 21.2%

Walking Ability Worsened Info Percent of long-stay residents whose ability to move independently worsened 18.3%
25% better than Mississippi average

Mississippi average: 24.5%

Low Risk Residents with Bowel/Bladder Incontinence Info Percent of low risk long-stay residents who lose control of their bowels or bladder 26.9%
25% worse than Mississippi average

Mississippi average: 21.4%

Falls with Major Injury Info Percent of long-stay residents experiencing one or more falls with major injury 3.1%
In line with Mississippi average

Mississippi average: 3.2%

High Risk Residents with Pressure Ulcers Info Percent of long-stay high risk residents with pressure ulcers 6.8%
5% better than Mississippi average

Mississippi average: 7.1%

Urinary Tract Infection Info Percent of long-stay residents with a urinary tract infection 0.3%
87% better than Mississippi average

Mississippi average: 2.6%

Lost Too Much Weight Info Percent of long-stay residents who lose too much weight 6.8%
9% worse than Mississippi average

Mississippi average: 6.2%

Depressive Symptoms Info Percent of long-stay residents who have depressive symptoms 6.4%
314% worse than Mississippi average

Mississippi average: 1.5%

Antipsychotic Use Info Percent of long-stay residents who received an antipsychotic medication 20.1%
5% better than Mississippi average

Mississippi average: 21.2%

Pneumococcal Vaccine Info Percent of long-stay residents assessed and appropriately given the pneumococcal vaccine 98.7%
In line with Mississippi average

Mississippi average: 95.9%

Influenza Vaccine Info Percent of long-stay residents assessed and appropriately given the seasonal influenza vaccine 100.0%
In line with Mississippi average

Mississippi average: 97.0%

Hospitalizations per 1,000 days Info Number of hospitalizations per 1,000 long-stay resident days. 1.77
27% better than Mississippi average

Mississippi average: 2.44

ED visits per 1,000 days Info Number of outpatient emergency department visits per 1,000 long-stay resident days. 2.08
28% better than Mississippi average

Mississippi average: 2.88

Short-stay resident measures
Pneumococcal Vaccine Info Percent of short-stay residents assessed and appropriately given the pneumococcal vaccine 96.1%
9% better than Mississippi average

Mississippi average: 87.9%

Antipsychotic medication increase Info Percent of short-stay residents who newly received an antipsychotic medication 3.2%
27% worse than Mississippi average

Mississippi average: 2.5%

Influenza Vaccine Info Percent of short-stay residents assessed and appropriately given the seasonal influenza vaccine 95.5%
13% better than Mississippi average

Mississippi average: 84.6%

Re-hospitalized after SNF stay Info Percentage of short-stay residents who were re-hospitalized after their nursing home admission. 23.6%
15% better than Mississippi average

Mississippi average: 27.9%

Emergency department visits Info Percentage of short-stay residents who had an outpatient emergency department visit. 13.2%
14% better than Mississippi average

Mississippi average: 15.3%

Falls with major injury Info Percentage of SNF residents who experience falls with major injury during their stay. 0.0%
100% better than Mississippi average

Mississippi average: 0.8%

Ability to care for self at discharge Info Percentage of residents at or above expected ability to care for themselves at discharge. 50.8%
5% worse than Mississippi average

Mississippi average: 53.7%

Successful return to home or community Info Rate of successful return to home or community from a skilled nursing facility. 50.3%
In line with Mississippi average

Mississippi average: 50.6%

Penalties and fines

Federal penalties imposed by CMS for regulatory violations, including civil money penalties (fines) and denials of payment for new Medicare/Medicaid admissions.

Source: CMS Penalties Database (Data as of Jan 2026)

Total fines amount $38K
In line with Mississippi average

Mississippi average: $39K

Number of fines 4
100% more fines than Mississippi average

Mississippi average: 2.0

Payment Denials Info Serious action where Medicare and/or Medicaid temporarily stops payments for new residents until issues are fixed. 0
100% fewer payment denials than Mississippi average

Mississippi average: 0.2

Fines amount comparison
This facility $38K
Mississippi average $39K
Penalty History

Penalties are imposed by CMS for violations of federal nursing home regulations.

Civil Money Penalty Info Fines imposed for noncompliance, which can be assessed per day or per instance of violation. Feb 13, 2025
$5K
Civil Money Penalty Info Fines imposed for noncompliance, which can be assessed per day or per instance of violation. Feb 13, 2025
$5K
Civil Money Penalty Info Fines imposed for noncompliance, which can be assessed per day or per instance of violation. Apr 18, 2024
$12K
Civil Money Penalty Info Fines imposed for noncompliance, which can be assessed per day or per instance of violation. Jul 26, 2023
$16K

Last updated: Jan 2026

Guides for Better Senior Living

Care Cost Calculator: See Prices in Your Area

Nursing Home Data Explorer

Don’t Wait Too Long: 7 Red Flag Signs Your Parent Needs Assisted Living Now

The True Cost of Assisted Living in 2025 – And How Families Are Paying For It

Understanding Senior Living Costs: Pricing Models, Discounts & Financial Assistance

Financial Aid for Mississippi Seniors

Get financial aid guidance

Elderly and Disabled Waiver

Mississippi Medicaid E&D Waiver

Age 65+ or disabled, Mississippi resident, Medicaid- eligible, nursing home-level care need.

~$2,829/month (300% FBR, individual).

$4,000 (individual, higher than most states).

Higher asset limit; rural focus.

Mississippi Caregiver Respite Program

MS NFCSP Respite

Caregiver of someone 60+, Mississippi resident.

No strict limit; prioritizes low-income.

Not applicable.

Limited slots; rural emphasis.

Assisted Living (AL) Waiver

Mississippi Assisted Living Waiver

Age 65+ or disabled, Mississippi resident, Medicaid-eligible, NFLOC, living in approved AL facility.

~$2,829/month (300% FBR, individual); QIT required.

$4,000 (individual), $6,000 (couple).

Only for AL facilities with waiver contracts; small program size.

Independent Living (IL) Waiver

Mississippi Independent Living Waiver

Age 16+ (65+ for seniors), Mississippi resident, Medicaid-eligible, NFLOC but capable of self-direction.

~$2,829/month (300% FBR, individual); QIT required.

$4,000 (individual), $6,000 (couple).

Self-directed care; limited to in-home settings.

Medicare Savings Program (MSP)

Mississippi Medicare Savings Program

Age 65+ or disabled, Mississippi resident, Medicare Part A/B.

~$2,510/month (QMB), ~$3,380/month (SLMB), ~$3,598/month (QI)—individual.

$9,430 (individual), $14,130 (couple).

Three tiers; no waitlist; includes Extra Help for Part D.

Mississippi Homemaker Program

Mississippi Homemaker Program (via Area Agencies on Aging)

Age 60+, Mississippi resident, not Medicaid-eligible, needs assistance with daily living.

~$1,063/month (100% FPL, individual); prioritizes low-income.

Not strictly assessed; need-based focus.

10 AAAs; waitlist possible due to funding caps.

Senior Community Service Employment Program (SCSEP)

Mississippi SCSEP

Age 55+, unemployed, low-income, Mississippi resident.

~$1,983/month (125% FPL).

Not specified; income-focused.

Priority for veterans, rural residents; MDES oversees.

VA Aid and Attendance (A&A) and Housebound Benefits

Mississippi VA Aid and Attendance/Housebound

Age 65+ or disabled veteran/spouse, Mississippi resident, wartime service, need for ADL help (A&A) or homebound.

Net income < ~$1,984/month (veteran with dependent, A&A); pension offsets income.

~$155,356 (net worth limit).

High veteran population in rural areas.

Who we are

Your Senior Care Partner, Every Step of the Way

We help families find affordable senior communities and unlock same day discounts, Medicaid, and Medicare options tailored to your needs.

Contact us Today