Olympic View Care

Nursing Home · Port Angeles, WA
CMS overall rating Info The Overall CMS Rating is scored from 1 to 5 stars and combines results from health inspections, staffing levels, and quality measures. Health inspections carry the most weight. Staffing and quality scores can increase or decrease the final rating based on performance compared to state and national standards.
Olympic View Care

Nursing Home in Port Angeles

CMS overall rating Info The Overall CMS Rating is scored from 1 to 5 stars and combines results from health inspections, staffing levels, and quality measures. Health inspections carry the most weight. Staffing and quality scores can increase or decrease the final rating based on performance compared to state and national standards.
Calculator: See prices in your area
Olympic View Care accepts Medicare, Medicaid, and private pay.

Overview of Olympic View Care

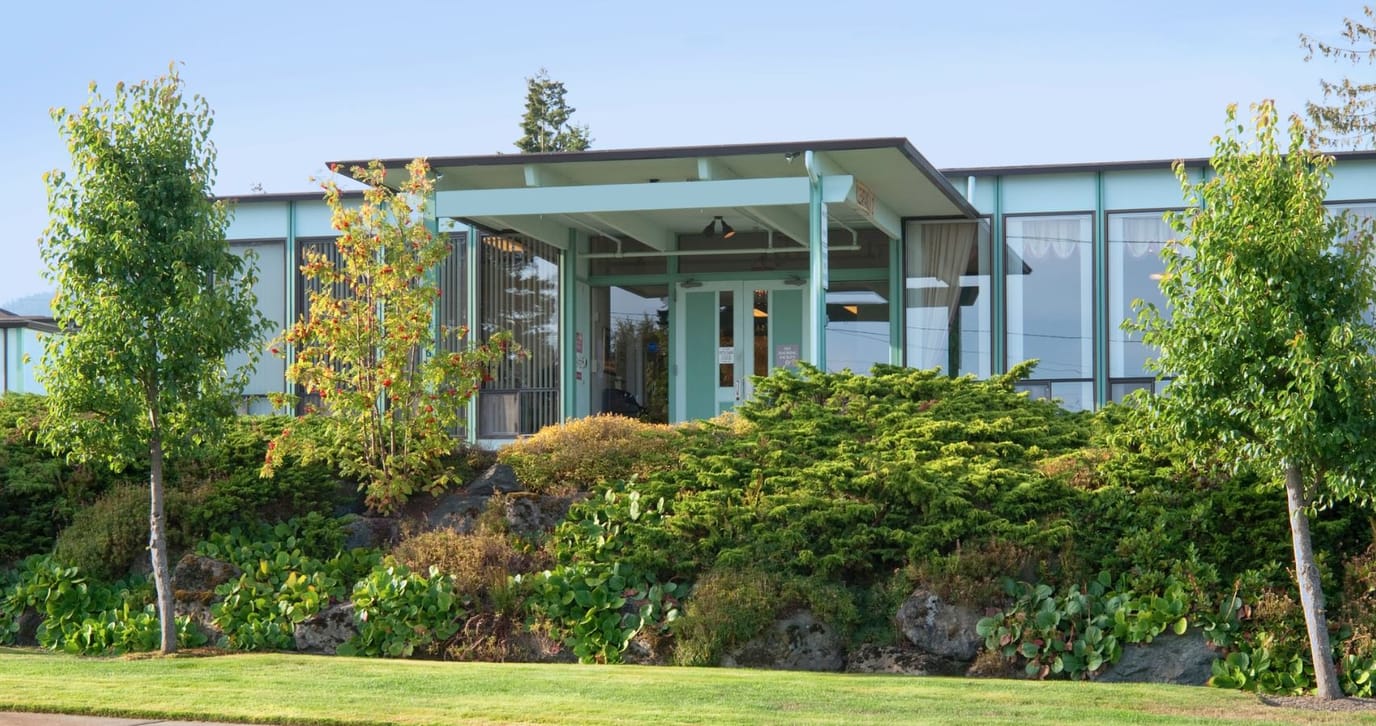
Olympic View Care is a 24-hour skilled nursing and rehabilitation facility that provides the support and nursing care needed by residents. The care home offers a range of services, including physical therapy, speech therapy, nutritional support, occupational therapy, and wellness-focused activities. Olympic View Care’s experienced staff deliver quality care while giving residents a serene, safe, and comfortable place to enjoy healing and rest.

The care home exceeds expectations through professional care, innovation, and a positive attitude. Olympic View Care’s passionate team consists of experts in long-term care and short-term rehabilitation, compassionately caring for residents and providing a full range of services to help them heal, regain strength, and live as independently as possible. The care home’s staff, from the leadership team to the direct care staff, work to exceed expectations and provide care to meet every resident’s needs, including assistance with personal care, concierge services, and companionship.

(360) 452-9206

Quality ratings

Measured by Centers for Medicare & Medicaid Services (CMS)

Overall rating Info The Overall CMS Rating combines results from health inspections, staffing levels and quality measures. Health inspections carry the most weight. Staffing and quality scores can increase or decrease the final rating based on performance compared to state and national standards.
▼ 69.0% Below WA avg.
Health Inspection Info Based on the results of the facility's three most recent standard inspections and any complaint investigations. CMS reviews the number, scope, and severity of deficiencies, with more recent findings weighted more heavily.
▼ 64.5% Below WA avg.
Staffing Info Measures average nursing staff hours per resident per day, including Registered Nurses (RNs) and total nursing staff. Ratings are adjusted based on the level of care residents require and are compared to state and national benchmarks.
▲ 16.8% Above WA avg.
Quality Measures Info Based on clinical and physical health indicators reported to CMS, such as hospital readmissions, falls, pressure ulcers, and improvements in mobility. These measures reflect how well residents' health needs are being managed.
▲ 1.7% Above WA avg.

Staffing hours breakdown

Info Daily nursing hours per resident by staff type, reported to CMS. Higher is generally better — compare this facility to state and national averages to see where staffing stands.

Hours per resident per day — compared to Washington state averages

Total nursing care / resident Info This home is ranked 16th out of 59 homes in Washington.

Total adjusted nursing hours per resident per day, combining RN, LPN, and aide time. CMS adjusts this for case-mix so facilities can be fairly compared.
4h 33m per day
Rank #16 / 59Nurse hours — state benchmarkedThis home is ranked 16th out of 59 homes in Washington.Shows adjusted nurse hours per resident per day benchmarked to the Washington average, with a ranking across 59 Washington SNFs. More hours mean more direct care. The national average is about 3.5 hrs; below 3.0 is a red flag.
This facility Washington avg (4h 13m per day)
vs Washington avg
+8%

5 of 6 metrics below state avg

Standout metric Nurse Aide is +11% above state avg
Staff typeHours / dayvs state avg
Registered Nurse (RN) Info RNs hold the highest nursing license and can assess residents, interpret test results, and direct care plans. More RN hours per day often signals stronger clinical oversight and faster response to health changes. 35m per day ▼ 34% State avg: 53m per day · National avg: 41m per day
LPN / LVN Info Licensed Practical Nurses (LPNs) or Licensed Vocational Nurses (LVNs) deliver routine hands-on care — medication administration, wound dressing, and monitoring vital signs. They work under RN supervision and make up a large share of daily bedside care. 40m per day ▼ 18% State avg: 49m per day · National avg: 52m per day
Nurse Aide Info Certified Nurse Aides (CNAs) provide the most direct day-to-day assistance: bathing, dressing, feeding, and mobility. Nurse aide hours are typically the largest staffing category and directly affect residents' quality of life. 2h 59m per day ▲ 11% State avg: 2h 41m per day · National avg: 2h 21m per day
Total Nursing (Weekend) Info Combined nursing hours (RN + LPN + Nurse Aide) per resident per day on weekends. Staffing often drops on weekends — this figure reveals whether the facility maintains adequate coverage outside of weekday hours. 3h 4m per day ▼ 19% State avg: 3h 47m per day · National avg: 3h 26m per day
Physical Therapist Info Hours per resident per day provided by licensed Physical Therapists (PTs) or PT Assistants. PT services help residents recover mobility after injury or illness and are especially important for post-acute (short-stay) rehabilitation. 2m per day ▼ 60% State avg: 5m per day · National avg: 4m per day
RN (Weekend) Info Registered nurse hours specifically on weekends. Facilities sometimes reduce RN presence on Saturdays and Sundays — a low weekend RN figure compared to weekday hours can indicate reduced clinical oversight when most administrative staff are absent. 28m per day ▼ 26% State avg: 38m per day · National avg: 29m per day

Capacity and availability

This home usually has availability

Occupancy lower than 85% suggests more openings may be available.

Lower occupancy than the Washington average: 72.5%
Occupancy rate 72.4% Rank #28 / 62Occupancy rate — state benchmarkedThis home is ranked 28th out of 62 homes in Washington.Shows this facility's occupancy rate versus the Washington average, with its statewide rank out of 62. Higher occupancy signals strong local demand and financial stability.
Avg. Length of Stay 97 days
Occupancy rate
72.4% Rank #28 / 62Occupancy rate — state benchmarkedThis home is ranked 28th out of 62 homes in Washington.Shows this facility's occupancy rate versus the Washington average, with its statewide rank out of 62. Higher occupancy signals strong local demand and financial stability.
Avg. Length of Stay
97 days

Who this home usually serves

TYPE OF STAY

Mostly short-term rehab stays

Most residents typically stay for a few weeks or months before returning home or moving on.

Breakdown by payment type

Medicare

60% of new residents, usually for short-term rehab.

Typical stay 25 days

Private pay

34% of new residents, often for short stays.

Typical stay 1 - 2 months

Medicaid

6% of new residents, often for long-term daily care.

Typical stay 3 years

Finances and operations

Privately-owned community
Operated by a business corporation.
Home revenue
$11.8M
Profit
$903.4K
Privately-owned community Operated by a business corporation.
Home revenue
$11.8M Rank #46 / 62Revenue — state benchmarkedThis home is ranked 46th out of 62 homes in Washington.Shows this facility's annual revenue compared to the Washington SNF average. Higher revenue generally means more resources for staffing and capital — read alongside Payroll %.
Profit
$903.4K
Payroll costs Info The portion of the home's budget spent on staff, including nurses, caregivers, and other employees who support care and operations. Rank #45 / 62Payroll — state benchmarkedThis home is ranked 45th out of 62 homes in Washington.Shows total annual staff payroll benchmarked to the Washington average. Higher payroll investment relative to peers often signals better staffing and less reliance on cheaper contract labor.
$5.7M
48.6% of revenue Rank #26 / 62Payroll % — state benchmarkedThis home is ranked 26th out of 62 homes in Washington.Shows payroll as a percentage of revenue versus the Washington average. Well-run SNFs often land around 55–65%. Below 25% may signal understaffing or heavy agency use — read with Staffing ratings.
Other operating costs Info All remaining costs needed to run the home, such as food, utilities, building maintenance, supplies and administrative expenses.
$5.2M
Total costs $10.9M
Walk Score
Walk Score: 50 / 100 Rank #27 / 55Walk Score — state benchmarkedThis home is ranked 27th out of 55 homes in Washington.Shows how walkable this facility's neighborhood is compared to the average Walk Score across Washington SNFs. Higher scores benefit residents, families, and staff.
Moderately walkable. Some errands can be accomplished on foot, with a mix of nearby amenities.

What does this home offer?

Building type icon
Building type icon

Building Type: Single-story

Fitness and recreation icon

Fitness and Recreation

Types of Care at Olympic View Care

Nursing Home

Contact Olympic View Care

Health Inspection History

Inspections
Total health inspections 21

Washington average 7.8


Last Health inspection on Sep 2025

Total health citations
90 Rank #52 / 59Health citations — state benchmarkedThis home is ranked 52nd out of 59 homes in Washington.Shows this facility's total health deficiency citations benchmarked to the Washington state average, with a ranking across all 59 WA SNFs. Lower citation counts earn a better rank.

Washington average 48.9

Citations per inspection
4.29 Rank #9 / 59Citations per inspection — state benchmarkedThis home is ranked 9th out of 59 homes in Washington.Shows average deficiency citations per CMS inspection for this facility versus the Washington mean across 59 SNFs with citation data. Lower is better.

Washington average 6.92


Health citations are formal notices following inspections when they fail to comply with safety and care standards.

52 of 90 citations resulted from standard inspections; 35 of 90 resulted from complaint investigations; and 3 of 90 came from combined inspections (standard and complaint).

Breakdown of citation severity (last 2 years)
Critical Health citations More info
0
100% better than Washington average

Washington average: 0.3


Serious Health citations More info 3
76% worse than Washington average

Washington average: 1.7

0 critical citations More info Washington average: 0.3

3 serious citations More info Washington average: 1.7

86 moderate citations More info Washington average: 46.3

1 minor citation More info Washington average: 0.5
Citations history (last 2 years)
Administration moderate citation Info Issues related to how the facility is managed, including policies, procedures, and compliance with regulations. Sep 17, 2025
Corrected

Resident Rights moderate citation Info Issues related to resident's rights, including dignity, privacy, and the ability to make decisions about their care. Sep 17, 2025
Corrected

Environmental moderate citation Info Issues related to building safety, cleanliness, maintenance, and overall living conditions. Aug 12, 2025
Corrected

Resident Rights moderate citation Info Issues related to resident's rights, including dignity, privacy, and the ability to make decisions about their care. Aug 12, 2025
Corrected

Financial Assistance for
Nursing Home in Washington

Olympic View Care is located in Port Angeles, Washington.
Here are the financial assistance programs available to residents in Washington.

Get Financial aid guidance

Community Options Program Entry System (COPES)

WA Medicaid COPES

Age 65+ or disabled
General Washington resident, Medicaid-eligible, nursing home-level care need.
Income Limits (2025) ~$2,829/month 300% FBR, individual
Asset Limits $2,000 (individual), $3,000 (couple).
WA

High demand in urban areas (e.g., Seattle).

Benefits
Personal care (5-7 hours/day) Respite (240 hours/year) Adult day care ($70/day) Home modifications ($1,500 avg.)

Washington Family Caregiver Support Program

WA NFCSP

Age Caregiver of someone 60+ (or with dementia)
General Washington resident.
Income Limits No strict limit; prioritizes low-income.
Asset Limits Not applicable.
WA

High urban demand; rural outreach.

Benefits
In-home respite (4-6 hours/day) Adult day care (~$70/day) Short-term facility care (up to 5 days)

Community First Choice (CFC)

Washington Community First Choice

Age 65+ (or disabled 18+)
General WA resident, Medicaid-eligible, need help with 2+ ADLs/IADLs.
Income Limits (2025) ~$2,829/month; QIT optional.
Asset Limits $2,000 (individual), $3,000 (couple).
WA

Broader than COPES; serves ~20,000; self-directed option.

Benefits
Personal care (4-6 hours/day) Respite (~240 hours/year) Assistive devices Training Transportation

Older Americans Act (OAA) Services

Washington OAA Services

Age 60+
General WA resident; no income/asset limits.
Income Limits (2025) None; donations encouraged.
Asset Limits Not assessed.
WA

13 AAAs; includes Meals on Wheels; rural focus.

Benefits
Meals (~$5-$7/meal) Transportation Homemaker services (~4 hours/week) Respite (~5 days/year) Legal aid

Medicare Savings Program (MSP)

Washington Medicare Savings Program

Age 65+ or disabled
General WA resident, Medicare Part A/B.
Income Limits (2025) ~$2,510/month (QMB), ~$3,380/month (SLMB), ~$3,598/month (QI)—individual.
Asset Limits $9,430 (individual), $14,130 (couple).
WA

Includes Extra Help for Part D; no waitlist.

Benefits
Covers Part B premiums ($174.70/month) Deductibles ($240/year) Copays (~20%)

Low-Income Home Energy Assistance Program (LIHEAP)

Washington LIHEAP

Age 60+ prioritized
General WA resident, low-income household.
Income Limits (2025) ~$3,970/month 185% FPL
Asset Limits Not assessed.
WA

Covers gas, electric, wood; emergency aid available.

Benefits
Heating/cooling aid ($300-$1,000/season) Crisis aid ($500 max)

Senior Community Service Employment Program (SCSEP)

Washington SCSEP

Age 55+
General unemployed, low-income, WA resident.
Income Limits (2025) ~$1,983/month 125% FPL
Asset Limits Not specified.
WA

Priority for veterans, rural residents; AARP partnership.

Benefits
Paid training (~20 hours/week at ~$7.25/hour) Job placement

VA Aid and Attendance (A&A) and Housebound Benefits

Washington VA Aid and Attendance/Housebound

Age 65+ or disabled veteran/spouse
General WA resident, wartime service, ADL help (A&A) or homebound.
Income Limits (2025) Net income < ~$1,984/month (veteran with dependent, A&A); pension offsets income.
Asset Limits ~$155,356 net worth
WA

High veteran use; supports rural/urban needs.

Benefits
Cash (~$1,433-$2,642/month veteran, ~$951-$1,318 spouse) for care costs

Senior Citizens Property Tax Exemption

Washington Senior Property Tax Exemption

Age 61+ or disabled retiree
General WA resident, homeowner, income-based.
Income Limits (2025) ~$45,000-$70,000/year varies by county, e.g., King: $70,000
Asset Limits Not assessed; home value cap varies ~$250,000-$400,000
WA

Saves ~$500-$1,500/year; offered statewide.

Benefits
Tax exemption (~$500-$1,500/year depending on county)

Senior Farmers’ Market Nutrition Program (SFMNP)

Washington SFMNP

Age 60+
General WA resident, low-income.
Income Limits (2025) ~$2,322/month 185% FPL
Asset Limits Not assessed.
WA

Vouchers (~$80/season); serves ~20,000 via AAAs.

Benefits
Vouchers (~$80/season) for produce at farmers’ markets

Places of interest near Olympic View Care

Address 1.9 miles from city center Info Estimated distance in miles from Port Angeles's city center to Olympic View Care's address, calculated via Google Maps. — 0.73 miles to nearest hospital (North Olympic Peninsula VA Clinic)

Calculate Travel Distance to Olympic View Care

Add your location

Address

Staffing Data (Q2 2025)

This data corresponds to Q2 2025 and is based on CMS Payroll-Based Journal.

Total staff 153
Employees 113
Contractors 40
Staff to resident ratio 1.89:1
0% compared with Washington average

Washington average ratio: 1.85:1

Avg staff/day 39
Average shift 9.1 hours
12% better than Washington average

Washington average: 8.1 hours

Total staff hours (quarter) 32,264
Nursing staff breakdown
Registered Nurse

Manages medical care and health needs.

Total count 14
Average shift length Info Average shift length. Calculated as total hours divided by days worked and average staff per day. 8.6 hours

This role is partially covered by contractors.

Licensed Practical Nurse

Assists with medical care and medications.

Total count 16
Average shift length Info Average shift length. Calculated as total hours divided by days worked and average staff per day. 10.9 hours

This role is partially covered by contractors.

Certified Nursing Assistant

Helps with daily care and mobility.

Total count 54
Average shift length Info Average shift length. Calculated as total hours divided by days worked and average staff per day. 9.8 hours

This role is partially covered by contractors.

Contractor staffing

Total hours from contractors

3.9%

1,246 contractor hours this quarter

Certified Nursing Assistant: 18 Licensed Practical Nurse: 9 Registered Nurse: 9 Occupational Therapy Assistant: 2 Medical Director: 2
Staff by category
Certified Nursing Assistant36185416,12291100%9.8
Licensed Practical Nurse79163,89691100%10.9
Nurse Aide in Training140142,1208290%10.6
Registered Nurse59141,6508897%8.6
Clinical Nurse Specialist5051,5817279%8.9
Medication Aide/Technician8081,2178088%11.4
RN Director of Nursing2021,0917279%9.5
Speech Language Pathologist5059127684%7
Other Dietary Services Staff3036888897%6.6
Administrator2025206571%8
Nurse Practitioner1015206571%8
Dietitian1013945459%7.3
Occupational Therapy Aide3033876066%5.5
Physical Therapy Assistant6062996066%4.2
Physical Therapy Aide3032665055%5.2
Mental Health Service Worker3032493134%7.8
Respiratory Therapy Technician4042355662%4
Dental Services Staff2024389%5.3
Qualified Social Worker30338910%4.2
Medical Director022221820%1.2
Occupational Therapy Assistant022151618%0.9
54 Certified Nursing Assistant
% of Days 100%
16 Licensed Practical Nurse
% of Days 100%
14 Nurse Aide in Training
% of Days 90%
14 Registered Nurse
% of Days 97%
5 Clinical Nurse Specialist
% of Days 79%
8 Medication Aide/Technician
% of Days 88%
2 RN Director of Nursing
% of Days 79%
5 Speech Language Pathologist
% of Days 84%
3 Other Dietary Services Staff
% of Days 97%
2 Administrator
% of Days 71%
1 Nurse Practitioner
% of Days 71%
1 Dietitian
% of Days 59%
3 Occupational Therapy Aide
% of Days 66%
6 Physical Therapy Assistant
% of Days 66%
3 Physical Therapy Aide
% of Days 55%
3 Mental Health Service Worker
% of Days 34%
4 Respiratory Therapy Technician
% of Days 62%
2 Dental Services Staff
% of Days 9%
3 Qualified Social Worker
% of Days 10%
2 Medical Director
% of Days 20%
2 Occupational Therapy Assistant
% of Days 18%

Facility Characteristics

Source: CMS Long-Term Care Facility Characteristics (Data as of Jan 2026)

Total residents 81
Medicare
15
18.5% of residents
Medicaid
51
63% of residents
Private pay or other
15
18.5% of residents
Programs & Services
Residents Group

Residents meet regularly to discuss policies, care quality, and activities

Nurse Aide Training

State-approved Nurse Aide Training and Competency Evaluation Program on-site

Active Resident Council

Organized group of residents that meets regularly to discuss facility policies, quality of life, and activities.

Quality of care over time

These measures show how residents usually do over time at this home, based on health outcomes and preventive care.

High-risk clinical events score Info A composite score based on pressure ulcers, falls with injury, weight loss, walking ability decline, and activities of daily living decline. 8.8
13% better than Washington average

Washington average: 10.0

Functional decline score Info A composite score based on activities of daily living decline, walking ability decline, and incontinence. 13.2
37% better than Washington average

Washington average: 20.9

Long-stay resident measures
Significantly above average Washington avg: 3.6 Info CMS star rating based on long-stay quality measure performance. 5 stars = significantly above average, 1 star = significantly below average.
Need for Help with Daily Activities Increased Info Percent of long-stay residents whose need for help with daily activities has increased 12.7%
23% better than Washington average

Washington average: 16.4%

Walking Ability Worsened Info Percent of long-stay residents whose ability to move independently worsened 8.3%
62% better than Washington average

Washington average: 21.8%

Low Risk Residents with Bowel/Bladder Incontinence Info Percent of low risk long-stay residents who lose control of their bowels or bladder 18.7%
23% better than Washington average

Washington average: 24.3%

Falls with Major Injury Info Percent of long-stay residents experiencing one or more falls with major injury 0.9%
64% better than Washington average

Washington average: 2.6%

High Risk Residents with Pressure Ulcers Info Percent of long-stay high risk residents with pressure ulcers 17.5%
255% worse than Washington average

Washington average: 4.9%

Urinary Tract Infection Info Percent of long-stay residents with a urinary tract infection 0.5%
73% better than Washington average

Washington average: 1.7%

Lost Too Much Weight Info Percent of long-stay residents who lose too much weight 4.3%
26% better than Washington average

Washington average: 5.8%

Depressive Symptoms Info Percent of long-stay residents who have depressive symptoms 2.6%
84% better than Washington average

Washington average: 16.2%

Antipsychotic Use Info Percent of long-stay residents who received an antipsychotic medication 12.5%
14% better than Washington average

Washington average: 14.5%

Pneumococcal Vaccine Info Percent of long-stay residents assessed and appropriately given the pneumococcal vaccine 74.3%
23% worse than Washington average

Washington average: 96.2%

Influenza Vaccine Info Percent of long-stay residents assessed and appropriately given the seasonal influenza vaccine 83.9%
11% worse than Washington average

Washington average: 93.8%

Hospitalizations per 1,000 days Info Number of hospitalizations per 1,000 long-stay resident days. 1.28
7% better than Washington average

Washington average: 1.38

ED visits per 1,000 days Info Number of outpatient emergency department visits per 1,000 long-stay resident days. 0.81
46% better than Washington average

Washington average: 1.51

Short-stay resident measures
Significantly below average Washington avg: 3.6 Info CMS star rating based on short-stay quality measure performance. 5 stars = much above average, 1 star = much below average.
Pneumococcal Vaccine Info Percent of short-stay residents assessed and appropriately given the pneumococcal vaccine 61.4%
30% worse than Washington average

Washington average: 88.1%

Antipsychotic medication increase Info Percent of short-stay residents who newly received an antipsychotic medication 0.4%
75% better than Washington average

Washington average: 1.4%

Influenza Vaccine Info Percent of short-stay residents assessed and appropriately given the seasonal influenza vaccine 28.1%
66% worse than Washington average

Washington average: 82.0%

Re-hospitalized after SNF stay Info Percentage of short-stay residents who were re-hospitalized after their nursing home admission. 18.8%
6% better than Washington average

Washington average: 19.9%

Emergency department visits Info Percentage of short-stay residents who had an outpatient emergency department visit. 17.9%
36% worse than Washington average

Washington average: 13.2%

Falls with major injury Info Percentage of SNF residents who experience falls with major injury during their stay. 0.0%
100% better than Washington average

Washington average: 0.8%

Ability to care for self at discharge Info Percentage of residents at or above expected ability to care for themselves at discharge. 41.1%
23% worse than Washington average

Washington average: 53.7%

Successful return to home or community Info Rate of successful return to home or community from a skilled nursing facility. 44.7%
12% worse than Washington average

Washington average: 50.6%

Penalties and fines

Federal penalties imposed by CMS for regulatory violations, including civil money penalties (fines) and denials of payment for new Medicare/Medicaid admissions.

Source: CMS Penalties Database (Data as of Jan 2026)

Total fines amount $36K
56% lower than Washington average

Washington average: $82K

Number of fines 1
46% fewer fines than Washington average

Washington average: 1.8

Payment Denials Info Serious action where Medicare and/or Medicaid temporarily stops payments for new residents until issues are fixed. 1
261% more payment denials than Washington average

Washington average: 0.3

Fines amount comparison
This facility $36K
Washington average $82K
Penalty History

Penalties are imposed by CMS for violations of federal nursing home regulations.

2 penalties in the past 3 years

Multiple penalties were reported in the last 3 years.

Payment Denial Info Serious action where Medicare and/or Medicaid temporarily stops payments for new residents until issues are fixed. Mar 7, 2025
14 days
Civil Money Penalty Info Fines imposed for noncompliance, which can be assessed per day or per instance of violation. Dec 4, 2023
$36K

Last updated: Jan 2026

Guides for Better Senior Living

Care Cost Calculator: See Prices in Your Area

Nursing Home Data Explorer

Don’t Wait Too Long: 7 Red Flag Signs Your Parent Needs Assisted Living Now

The True Cost of Assisted Living in 2025 – And How Families Are Paying For It

Understanding Senior Living Costs: Pricing Models, Discounts & Financial Assistance

Frequently Asked Questions about Olympic View Care

Is Olympic View Care in a walkable area?

Olympic View Care has a walk score of 50. Moderately walkable. Some errands can be accomplished on foot, with a mix of nearby amenities.

What is the phone number of Olympic View Care?

(360) 452-9206 will put you in contact with the team at Olympic View Care.

Is Olympic View Care Medicare or Medicaid certified?

Yes — Olympic View Care is a CMS-certified provider of Medicare and Medicaid.

Explore Open Rooms
1 Contact details
2 What type of senior care service are you looking for?
3 What budget do you have in mind for senior care?
4 How soon do you need to find care?
5 Additional details

Thank you for your interest!

Our team will be in touch shortly to help with next steps.