Optalis Health & Rehabilitation of Troy
Nursing Home, Assisted Living, Independent Living, Memory Care & Respite Care · Troy, MI
CMS overall rating Info CMS (the Centers for Medicare & Medicaid Services) is the federal agency that rates nursing home quality. Its Overall Rating runs from 1 to 5 stars, combining health inspections, staffing, and quality measures, with inspections weighted most heavily.

Optalis Health & Rehabilitation of Troy

Nursing Home, Assisted Living, Independent Living, Memory Care & Respite Care · Troy, MI
CMS overall rating Info CMS (the Centers for Medicare & Medicaid Services) is the federal agency that rates nursing home quality. Its Overall Rating runs from 1 to 5 stars, combining health inspections, staffing, and quality measures, with inspections weighted most heavily.
Calculator: See prices in your area
Optalis Health & Rehabilitation of Troy accepts Medicare, Medicaid, and private pay.

Overview of Optalis Health & Rehabilitation of Troy

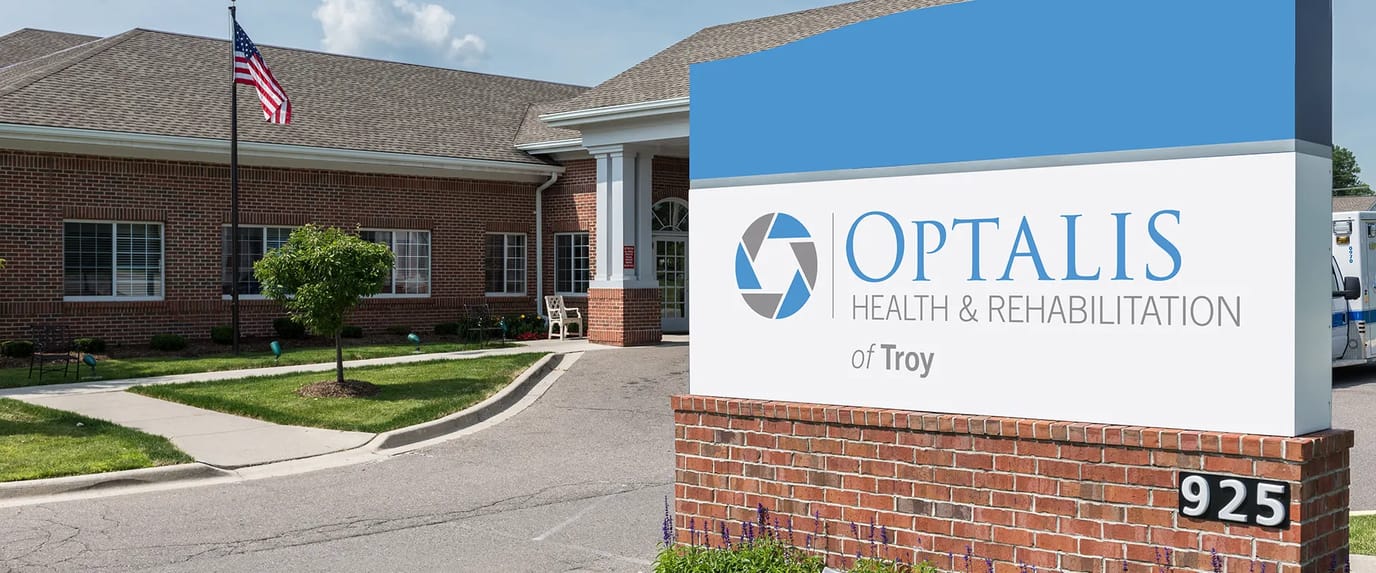
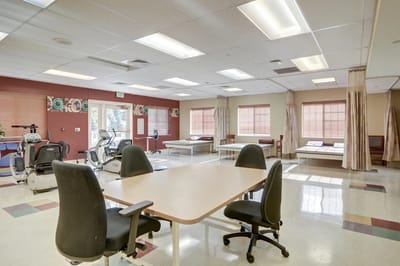
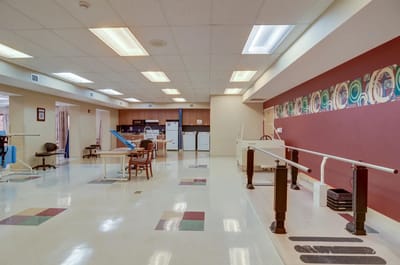
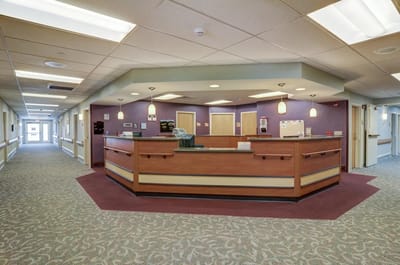
Optalis Health & Rehabilitation of Troy is a nursing home in Troy, MI, offering hospice care, rehabilitation, respite care, and skilled nursing. Promoting a nurturing and welcoming environment, the community ensures older adults have a comfortable stay. Well-balanced meals, housekeeping, and laundry services are also provided to help residents focus on their recovery. Through a person-centered approach to care, residents also receive the best possible care tailored to their unique needs and habits.

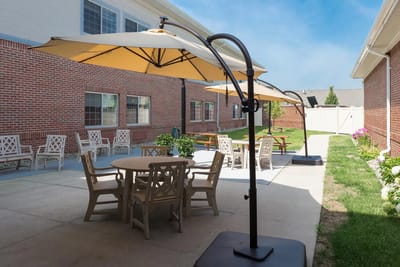
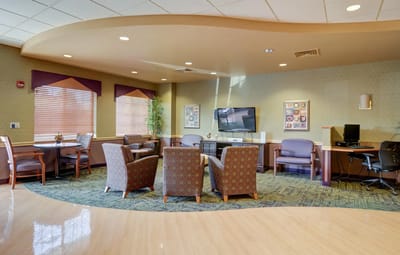
Bingo, chair exercises, and visits foster interactions and encourage residents to stay active. Cozy lounges, a state-of-the-art rehabilitation gym, and lively activity areas also ensure residents can relax and move around comfortably. Residents also experience a laid-back retirement, as it is conveniently located in the tree-lined residential area of Troy. As one of the trusted options for senior living in Michigan, this nursing home ensures older adults can thrive in retirement.

Quality ratings

Measured by Centers for Medicare & Medicaid Services (CMS)

Overall rating Info The Overall CMS Rating combines results from health inspections, staffing levels and quality measures. Health inspections carry the most weight. Staffing and quality scores can increase or decrease the final rating based on performance compared to state and national standards.
▼ 36.3% Below MI avg. ▼ 36.3% Below MI avg.MI average: 3.1Click the badge to see the full State ranking.Click here to see the full State ranking.
Health Inspection Info Based on the results of the facility's three most recent standard inspections and any complaint investigations. CMS reviews the number, scope, and severity of deficiencies, with more recent findings weighted more heavily.
▼ 64.6% Below MI avg. ▼ 64.6% Below MI avg.MI average: 2.8Click the badge to see the full State ranking.Click here to see the full State ranking.
Staffing Info Measures average nursing staff hours per resident per day, including Registered Nurses (RNs) and total nursing staff. Ratings are adjusted based on the level of care residents require and are compared to state and national benchmarks.
▼ 42.8% Below MI avg. ▼ 42.8% Below MI avg.MI average: 3.5Click the badge to see the full State ranking.Click here to see the full State ranking.
Quality Measures Info Based on clinical and physical health indicators reported to CMS, such as hospital readmissions, falls, pressure ulcers, and improvements in mobility. These measures reflect how well residents' health needs are being managed.
▲ 33.0% Above MI avg. ▲ 33.0% Above MI avg.MI average: 3.8Click the badge to see the full State ranking.Click here to see the full State ranking.

Staffing hours breakdown

Info Daily nursing hours per resident by staff type, reported to CMS. Higher is generally better — compare this facility to state and national averages to see where staffing stands.

Hours per resident per day — compared to Michigan state averages

Total nursing care / resident Info This home is ranked 94th out of 142 homes in Michigan for nurse hours. Total adjusted nursing hours per resident per day, combining RN, LPN, and aide time. CMS adjusts this for case-mix so facilities can be fairly compared.
3h 50m per day
Rank #94 / 142Nurse hours — State benchmarkedThis home is ranked 94th out of 142 homes in Michigan. Shows adjusted nurse hours per resident per day benchmarked to the Michigan average, with a ranking across 142 Michigan facilities. More hours mean more direct care. The national average is about 3.5 hrs; below 3.0 is a red flag.Rankings are based only on facilities in Michigan that report data for that category. Facilities without available data are excluded from the ranking.Click the rank badge to see the full State ranking.Click here to see the full State ranking.
This facility Michigan avg (4h 18m per day)
vs Michigan avg
-11%

3 of 6 metrics below state avg

Standout metric LPN / LVN is +90% above state avg
Staff typeHours / Day / Residentvs state avg
Registered Nurse (RN) Info RNs hold the highest nursing license and can assess residents, interpret test results, and direct care plans. More RN hours per day often signals stronger clinical oversight and faster response to health changes. 26m per day ▼ 43% State avg: 46m per day · National avg: 41m per day
LPN / LVN Info Licensed Practical Nurses (LPNs) or Licensed Vocational Nurses (LVNs) deliver routine hands-on care — medication administration, wound dressing, and monitoring vital signs. They work under RN supervision and make up a large share of daily bedside care. 1h 41m per day ▲ 90% State avg: 53m per day · National avg: 52m per day
Nurse Aide Info Certified Nurse Aides (CNAs) provide the most direct day-to-day assistance: bathing, dressing, feeding, and mobility. Nurse aide hours are typically the largest staffing category and directly affect residents' quality of life. 2h 4m per day ▼ 11% State avg: 2h 20m per day · National avg: 2h 20m per day
Weekend Total Nursing Info Combined nursing hours (RN + LPN + Nurse Aide) per resident per day on weekends. Staffing often drops on weekends — this figure reveals whether the facility maintains adequate coverage outside of weekday hours. 3h 39m per day ▲ 4% State avg: 3h 31m per day · National avg: 3h 27m per day
Physical Therapist Info Hours per resident per day provided by licensed Physical Therapists (PTs) or PT Assistants. PT services help residents recover mobility after injury or illness and are especially important for post-acute (short-stay) rehabilitation. 6m per day ▲ 48% State avg: 4m per day · National avg: 4m per day
Weekend RN Info Registered nurse hours specifically on weekends. Facilities sometimes reduce RN presence on Saturdays and Sundays — a low weekend RN figure compared to weekday hours can indicate reduced clinical oversight when most administrative staff are absent. 20m per day ▼ 31% State avg: 29m per day · National avg: 29m per day

Capacity and availability

This home usually has availability

Lower occupancy than the Michigan average: 75.8%
Occupancy rate
39.1% Rank #266 / 395Occupancy rate — State benchmarkedThis home is ranked 266th out of 395 homes in Michigan. Shows this facility's occupancy rate versus the Michigan average, with its Statewide rank out of 395. Higher occupancy signals strong local demand and financial stability.Rankings are based only on facilities in Michigan that report data for that category. Facilities without available data are excluded from the ranking.Click the rank badge to see the full State ranking.Click here to see the full State ranking.
Avg. Length of Stay
27 days
Bed community size
160-bed community Rank #24 / 435Bed count — State benchmarkedThis home is ranked 24th out of 435 homes in Michigan. Shows this facility's certified or reported bed count compared to other Michigan facilities. Larger communities may offer more amenities, programs, and on-site services for residents and families.Rankings are based only on facilities in Michigan that report data for that category. Facilities without available data are excluded from the ranking.Click the rank badge to see the full State ranking.Click here to see the full State ranking.
A large-scale community that may provide a wide range of amenities, services, and structured programs.
Walk Score
Walk Score: 18 / 100 Rank #543 / 703Walk Score — State benchmarkedThis home is ranked 543rd out of 703 homes in Michigan. Shows how walkable this facility's neighborhood is compared to the average Walk Score across Michigan facilities. Higher scores benefit residents, families, and staff.Rankings are based only on facilities in Michigan that report data for that category. Facilities without available data are excluded from the ranking.Click the rank badge to see the full State ranking.Click here to see the full State ranking.
Car-dependent. Most errands require a car, with limited nearby walkable options.

Contact Optalis Health & Rehabilitation of Troy

Staffing Data

Reporting period: October 1 – December 31, 2025 (Q4 2025). Source: CMS Payroll-Based Journal report.

Total staff 256
Employees 161
Contractors 95
Staff to resident ratio 3.24 : 1
91% more staff per resident than Michigan average
Michigan average ratio: 1.70 : 1 Michigan average ratio: 1.70 : 1See full Michigan ranking
Avg staff/day 68
Average shift 7.6 hours
0% compared with Michigan average
Michigan average: 7.9 hours Michigan average shift: 7.9 hoursSee full Michigan ranking
Total staff hours (quarter) 47,663

Nursing staff breakdown

Q4 2025 · Oct 1 – Dec 31 More info This data comes from the CMS Payroll-Based Journal report covering October 1 – December 31, 2025.
Registered Nurse

Manages medical care and health needs.

RN Staff Info All 13 RN Staff are full-time employees. No contractors work on this role. 13
Average shift length Info Average shift length. Calculated as total hours divided by days worked and average staff per day. 9.6 hours
Licensed Practical Nurse

Assists with medical care and medications.

LPN Staff Info 53 total: 48 full-time employees and 5 contractors. 53
Average shift length Info Average shift length. Calculated as total hours divided by days worked and average staff per day. 8.9 hours
Certified Nursing Assistant

Helps with daily care and mobility.

CNA Staff Info 131 total: 70 full-time employees and 61 contractors. 131
Average shift length Info Average shift length. Calculated as total hours divided by days worked and average staff per day. 6.9 hours

Contractor staffing

Q4 2025 · Oct 1 – Dec 31 More info This data comes from the CMS Payroll-Based Journal report covering October 1 – December 31, 2025.

Total hours from contractors

12.4%

5,899 contractor hours this quarter

Certified Nursing Assistant: 61 Respiratory Therapy Technician: 9 Physical Therapy Assistant: 8 Licensed Practical Nurse: 5 Physical Therapy Aide: 5 Speech Language Pathologist: 4 Qualified Social Worker: 3

Staff by category

Q4 2025 · Oct 1 – Dec 31 More info This data comes from the CMS Payroll-Based Journal report covering October 1 – December 31, 2025.
Certified Nursing Assistant706113118,61692100%6.9
Licensed Practical Nurse4855312,86092100%8.9
RN Director of Nursing8082,5799199%7.5
Registered Nurse130132,0138997%9.6
Clinical Nurse Specialist6061,5369098%7.8
Speech Language Pathologist0441,5046975%7.3
Other Dietary Services Staff4041,3338896%7.6
Physical Therapy Aide0551,3097076%7.5
Mental Health Service Worker5051,2406773%7.6
Physical Therapy Assistant0889538390%5.9
Respiratory Therapy Technician0999338289%5.9
Occupational Therapy Aide2026746975%7.8
Administrator1014806065%8
Qualified Social Worker0334576672%6.8
Nurse Practitioner1014485661%8
Qualified Activities Professional1014035257%7.8
Nurse Aide in Training2023243740%7.9
131 Certified Nursing Assistant
% of Days 100%
53 Licensed Practical Nurse
% of Days 100%
8 RN Director of Nursing
% of Days 99%
13 Registered Nurse
% of Days 97%
6 Clinical Nurse Specialist
% of Days 98%
4 Speech Language Pathologist
% of Days 75%
4 Other Dietary Services Staff
% of Days 96%
5 Physical Therapy Aide
% of Days 76%
5 Mental Health Service Worker
% of Days 73%
8 Physical Therapy Assistant
% of Days 90%
9 Respiratory Therapy Technician
% of Days 89%
2 Occupational Therapy Aide
% of Days 75%
1 Administrator
% of Days 65%
3 Qualified Social Worker
% of Days 72%
1 Nurse Practitioner
% of Days 61%
1 Qualified Activities Professional
% of Days 57%
2 Nurse Aide in Training
% of Days 40%

Penalties and fines

Includes penalties issued in 2023-2025

Federal penalties imposed by CMS for regulatory violations, including civil money penalties (fines) and denials of payment for new Medicare/Medicaid admissions.

Source: CMS Penalties Database (Data as of Jan 2026)

Total fines amount $622K Rank #145 / 145Federal fines — State benchmarkedThis home is ranked 145th out of 145 homes in Michigan. Shows this facility's cumulative CMS federal fine dollars versus the Michigan average among facilities with fines, and where it ranks among 145 facilities in the pool. Lower total dollars mean a better rank.Rankings are based only on facilities in Michigan that report data for that category. Facilities without available data are excluded from the ranking.Click the rank badge to see the full State ranking.Click here to see the full State ranking.
718% higher than Michigan average

Michigan average: $76K

Number of fines 6
197% more fines than Michigan average

Michigan average: 2.0

Payment Denials Info Serious action where Medicare and/or Medicaid temporarily stops payments for new residents until issues are fixed. 1
19% more payment denials than Michigan average

Michigan average: 0.8

Fines amount comparison
This facility $622K
Michigan average $76K
Penalty History

Penalties are imposed by CMS for violations of federal nursing home regulations.

6 penalties in the past 3 years

Multiple penalties were reported in the last 3 years.

Civil Money Penalty Info Fines imposed for noncompliance, which can be assessed per day or per instance of violation. Jun 25, 2025
$104K
Civil Money Penalty Info Fines imposed for noncompliance, which can be assessed per day or per instance of violation. Apr 9, 2025
$345K
Civil Money Penalty Info Fines imposed for noncompliance, which can be assessed per day or per instance of violation. Oct 23, 2023
$6K
Civil Money Penalty Info Fines imposed for noncompliance, which can be assessed per day or per instance of violation. Sep 28, 2023
$87K

Last updated: Jan 2026

Quality of care over time

These measures show how residents usually do over time at this home, based on health outcomes and preventive care.

High-risk clinical events score Info A composite score based on pressure ulcers, falls with injury, weight loss, walking ability decline, and activities of daily living decline. 10.4
24% worse than Michigan average

Michigan average: 8.4

Functional decline score Info A composite score based on activities of daily living decline, walking ability decline, and incontinence. 18.8
15% worse than Michigan average

Michigan average: 16.3

Long-stay resident measures
Need for Help with Daily Activities Increased Info Percent of long-stay residents whose need for help with daily activities has increased 11.8%
5% better than Michigan average

Michigan average: 12.5%

Walking Ability Worsened Info Percent of long-stay residents whose ability to move independently worsened 16.2%
6% worse than Michigan average

Michigan average: 15.3%

Low Risk Residents with Bowel/Bladder Incontinence Info Percent of low risk long-stay residents who lose control of their bowels or bladder 28.3%
35% worse than Michigan average

Michigan average: 21.0%

Falls with Major Injury Info Percent of long-stay residents experiencing one or more falls with major injury 3.9%
23% worse than Michigan average

Michigan average: 3.2%

High Risk Residents with Pressure Ulcers Info Percent of long-stay high risk residents with pressure ulcers 6.9%
20% worse than Michigan average

Michigan average: 5.7%

Urinary Tract Infection Info Percent of long-stay residents with a urinary tract infection 1.0%
43% better than Michigan average

Michigan average: 1.7%

Lost Too Much Weight Info Percent of long-stay residents who lose too much weight 13.3%
134% worse than Michigan average

Michigan average: 5.7%

Depressive Symptoms Info Percent of long-stay residents who have depressive symptoms 9.9%
156% worse than Michigan average

Michigan average: 3.9%

Antipsychotic Use Info Percent of long-stay residents who received an antipsychotic medication 24.5%
63% worse than Michigan average

Michigan average: 15.0%

Pneumococcal Vaccine Info Percent of long-stay residents assessed and appropriately given the pneumococcal vaccine 99.0%
In line with Michigan average

Michigan average: 94.9%

Influenza Vaccine Info Percent of long-stay residents assessed and appropriately given the seasonal influenza vaccine 100.0%
5% better than Michigan average

Michigan average: 95.0%

Short-stay resident measures
Pneumococcal Vaccine Info Percent of short-stay residents assessed and appropriately given the pneumococcal vaccine 96.8%
17% better than Michigan average

Michigan average: 82.5%

Antipsychotic medication increase Info Percent of short-stay residents who newly received an antipsychotic medication 0.7%
52% better than Michigan average

Michigan average: 1.4%

Influenza Vaccine Info Percent of short-stay residents assessed and appropriately given the seasonal influenza vaccine 97.0%
22% better than Michigan average

Michigan average: 79.5%

Breakdown by payment type

Medicare

33% of new residents, usually for short-term rehab.

Typical stay 20 days

Private pay

66% of new residents, often for short stays.

Typical stay 19 days

Medicaid

1% of new residents, often for long-term daily care.

Typical stay 2 years

Facility Characteristics

Source: CMS Long-Term Care Facility Characteristics (Data as of Jan 2026)

Total residents 79
Medicare
19
24.1% of residents
Medicaid
20
25.3% of residents
Private pay or other
40
50.6% of residents
Programs & Services
Residents Group

Residents meet regularly to discuss policies, care quality, and activities

Active Resident Council

Organized group of residents that meets regularly to discuss facility policies, quality of life, and activities.

Finances and operations

Based on CMS SNF Cost Report for fiscal year ending in 12/2023.

For-profit
Corporation
Net patient revenue Info Net patient revenue — what the home actually collects for resident care, after contractual allowances, bad debt and discounts are subtracted from its gross charges (CMS cost report, Worksheet G-3). It covers resident care only; money the home earns from other sources is shown separately as "Other income."
$8.0M
Net patient income Info Net patient income: net patient revenue minus the home's total operating expenses. A positive figure means it earns more from resident care than it spends to deliver it; a negative figure means the opposite. It excludes non-operating "other income."
-$1.4M
For-profit Corporation
Net patient revenue Info Net patient revenue — what the home actually collects for resident care, after contractual allowances, bad debt and discounts are subtracted from its gross charges (CMS cost report, Worksheet G-3). It covers resident care only; money the home earns from other sources is shown separately as "Other income."
$8.0M Rank #123 / 143Revenue — State benchmarkedThis home is ranked 123rd out of 143 homes in Michigan. Shows this facility's annual revenue compared to the Michigan average. Higher revenue generally means more resources for staffing and capital — read alongside Payroll %.Rankings are based only on facilities in Michigan that report data for that category. Facilities without available data are excluded from the ranking.Click the rank badge to see the full State ranking.Click here to see the full State ranking.
Net patient income Info Net patient income: net patient revenue minus the home's total operating expenses. A positive figure means it earns more from resident care than it spends to deliver it; a negative figure means the opposite. It excludes non-operating "other income."
-$1.4M
Other income Info Money the home earns outside of resident care — such as investments, grants, rentals and other non-operating sources (CMS cost report, Worksheet G-3). It is tracked separately from net patient revenue: it is not part of that figure, and it is not included in net patient income.
$190.7K
Payroll costs Info Staff salaries plus wage-related costs — benefits such as payroll taxes, health insurance and retirement — from the home's own accounting records (CMS cost report, Worksheet A). Contract or agency labor is counted separately, under other operating costs. Rank #113 / 143Payroll — State benchmarkedThis home is ranked 113th out of 143 homes in Michigan. Shows total annual staff payroll benchmarked to the Michigan average. Higher payroll investment relative to peers often signals better staffing and less reliance on cheaper contract labor.Rankings are based only on facilities in Michigan that report data for that category. Facilities without available data are excluded from the ranking.Click the rank badge to see the full State ranking.Click here to see the full State ranking.
$4.6M 57.3% of net patient revenue Info Payroll as a share of revenue: staff salaries and wage-related benefits divided by net patient revenue. A higher figure means more of each revenue dollar goes to staff pay. Rank #53 / 143Payroll % — State benchmarkedThis home is ranked 53rd out of 143 homes in Michigan. Shows payroll as a percentage of revenue versus the Michigan average. Well-run Michigan facilities typically land around 49–59% — the top third Statewide. Below 25% may signal understaffing or heavy agency use — read with Staffing ratings.Rankings are based only on facilities in Michigan that report data for that category. Facilities without available data are excluded from the ranking.Click the rank badge to see the full State ranking.Click here to see the full State ranking.
Other operating costs Info Everything it costs to run the home apart from payroll — food, utilities, supplies, maintenance, contract labor and administration. Calculated as total operating expense minus payroll (staff salaries and wage-related benefits).
$4.8M
Total costs Info The home's total operating expense for the year — all the costs of running it, salaries included (CMS cost report, Worksheet G-3).
$9.4M

What does this home offer?

Housing options icon

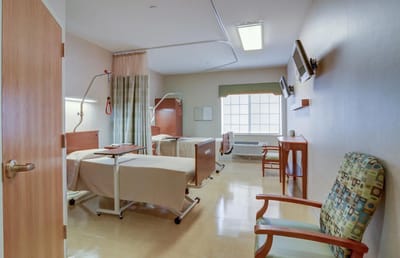
Housing Options: Private / Semi-Private Rooms

Building type icon
Building type icon

Building Type: Single-story

Housekeeping icon
Housekeeping icon

Housekeeping Services

Social and recreational activities icon

Social and Recreational Activities

Rehabilitative support icon

Rehabilitative Support

On-site medical care and health services icon

On-site Medical Care and Health Services

Who this home usually serves

TYPE OF STAY

Primarily short stays

Residents typically stay for brief periods, with frequent admissions and discharges throughout the year.

Most new residents arrive under private pay (66% of admissions), and a typical private pay stay runs around 19 days.

Admissions
644 total

Coverage residents most often arrive under.

Medicare 33%
Private pay 66%
Medicaid 1%
Discharges
631 total

Coverage residents most often leave under.

Medicare 29%
Private pay 68%
Medicaid 3%

Places of interest near Optalis Health & Rehabilitation of Troy

Address 1.2 miles from city center Info Estimated distance in miles from Troy's city center to Optalis Health & Rehabilitation of Troy's address, calculated via Google Maps.

Calculate Travel Distance to Optalis Health & Rehabilitation of Troy

Add your location

Address

Compare Nursing Homes around Troy

The information below is reported by the Michigan Department of Licensing and Regulatory Affairs (LARA).

3 facilities compared · CMS & MI Dept. of Health data

Optalis Health & Rehabilitation of Troy
NH
AL
IL
MC
RC
Troy
160
Facility 160
MI AVG 75
Rank #24 / 435
39.1%
Facility 39.1%
MI AVG 75.8%
Rank #266 / 395
-48%
3.84
Facility 3.84
MI AVG 4.30
Rank #94 / 142
-50%-11%
$389.0k
Facility $389.0k
MI AVG $87.6k
Rank #145 / 145
83
Facility 83
MI AVG 33.5
Rank #142 / 144
5.5
Facility 5.5
MI AVG 5.2
Rank #84 / 144
10100-
18
Facility 18
MI AVG 39
Rank #543 / 703
Luke Garrison
$8.0M
Facility $8.0M
MI AVG $15.8M
Rank #123 / 143
$4.6M
Facility $4.6M
MI AVG $5.6M
Rank #113 / 143
57.3%
Facility 57.3%
MI AVG 39%
Rank #53 / 143
235626
Regency at Troy
NH
Troy
154
Facility 154
MI AVG 75
Rank #29 / 435
--
4.32
Facility 4.32
MI AVG 4.30
Rank #46 / 142
-37%+1%
$0
Facility $0
MI AVG $87.6k
Rank #1 / 145
29
Facility 29
MI AVG 33.5
Rank #69 / 144
4.8
Facility 4.8
MI AVG 5.2
Rank #66 / 144
1128-
57
Facility 57
MI AVG 39
Rank #157 / 703
----235733
Pomeroy Living Rochester Skilled Nursing & Rehabilitation Services
NH
AL
HC
IL
MC
PC
RC
Rochester Hills
126
Facility 126
MI AVG 75
Rank #65 / 435
48.8%
Facility 48.8%
MI AVG 75.8%
Rank #216 / 395
-36%
3.88
Facility 3.88
MI AVG 4.30
Rank #77 / 142
-73%-10%
$115.4k
Facility $115.4k
MI AVG $87.6k
Rank #131 / 145
69
Facility 69
MI AVG 33.5
Rank #135 / 144
7.7
Facility 7.7
MI AVG 5.2
Rank #123 / 144
584-
4
Facility 4
MI AVG 39
Rank #654 / 703
Fifteeninone Corporate Group Inc
$7.2M
Facility $7.2M
MI AVG $15.8M
Rank #129 / 143
$3.8M
Facility $3.8M
MI AVG $5.6M
Rank #130 / 143
52.5%
Facility 52.5%
MI AVG 39%
Rank #53 / 143
235036

Financial Assistance for
Nursing Home in Michigan

Optalis Health & Rehabilitation of Troy is located in Troy, Michigan.
Here are the financial assistance programs available to residents in Michigan.

Get Financial aid guidance

MI Choice Waiver

Michigan Medicaid MI Choice Waiver

Age 65+ or disabled
General Michigan resident, Medicaid- eligible, nursing home-level care need.
Income Limits (2025) ~$2,829/month 300% FBR, individual
Asset Limits $2,000 (individual), $3,000 (couple).
MI

Delivered through regional waiver agents; waitlists possible.

Benefits
Personal care (5-7 hours/day) Respite care (240 hours/year) Home modifications ($1,500 avg.) Adult day care ($65/day)

Home Help Program

Michigan Home Help

Age 65+ or disabled
General Michigan resident, Medicaid- eligible or low-income.
Income Limits ~$1,732/month individual, Medicaid threshold
Asset Limits $2,000 individual
MI

Can hire family caregivers; less intensive than waiver.

Benefits
Personal care (up to 60 hours/month) Homemaker services Respite (varies)

Program of All-Inclusive Care for the Elderly (PACE)

Michigan PACE

Age 55+
General Michigan resident, nursing home-level care need, safe with PACE support.
Income Limits (2025) ~$2,829/month (Medicaid-eligible); private pay option available.
Asset Limits $2,000 (individual), $3,000 (couple).
MI

16 PACE centers (e.g., Ingham, Wayne counties); expanding slowly.

Benefits
Personal care (5-7 hours/day) Medical care Meals Transportation Therapy Respite

Medicare Savings Program (MSP)

Michigan Medicare Savings Program

Age 65+ or disabled
General Michigan resident, Medicare Part A/B.
Income Limits (2025) ~$2,510/month (QMB), ~$3,380/month (SLMB), ~$3,598/month (QI)—individual.
Asset Limits $9,430 (individual), $14,130 (couple).
MI

Three tiers; no waitlist; includes Extra Help for Part D.

Benefits
Covers Part B premiums ($174.70/month) Deductibles ($240/year) Copays (~20%)

National Family Caregiver Support Program (NFCSP) Respite

Michigan NFCSP Respite Care

Age
General Caregivers of 60+ needing care or 55+ caregivers of others; Michigan resident; functional needs (2+ ADLs).
Income Limits (2025) Prioritizes ~$24,980/year (individual); no strict cap.
Asset Limits Not assessed; need-based.
MI

16 AAAs; prioritizes low-income, rural caregivers.

Benefits
Respite (4-6 hours/week or 5 days/year) Adult day care ($60/day) Caregiver training

VA Aid and Attendance (A&A) and Housebound Benefits

Michigan VA Aid and Attendance/Housebound

Age 65+ or disabled veteran/spouse
General Michigan resident, wartime service, need for ADL help (A&A) or homebound.
Income Limits (2025) Net income < ~$1,984/month (veteran with dependent, A&A); pension offsets income.
Asset Limits ~$155,356 net worth limit
MI

High veteran demand in urban/rural areas.

Benefits
Cash (~$1,433-$2,642/month veteran, ~$951-$1,318 spouse) for care costs

Frequently Asked Questions about Optalis Health & Rehabilitation of Troy

Is Optalis Health & Rehabilitation of Troy in a walkable area?

Optalis Health & Rehabilitation of Troy has a walk score of 18. Car-dependent. Most errands require a car, with limited nearby walkable options.

What is the occupancy rate at Optalis Health & Rehabilitation of Troy?

Optalis Health & Rehabilitation of Troy's occupancy is 39.1%.

Does Optalis Health & Rehabilitation of Troy operate as a for-profit or non-profit?

Optalis Health & Rehabilitation of Troy is registered as a for-profit.

Are there photos of Optalis Health & Rehabilitation of Troy?

Yes — there are 7 photos of Optalis Health & Rehabilitation of Troy in the photo gallery on this page.

What is the address of Optalis Health & Rehabilitation of Troy?

Optalis Health & Rehabilitation of Troy is located at 925 W South Blvd, Troy, MI 48085.

What is the phone number of Optalis Health & Rehabilitation of Troy?

(248) 729-4400 will put you in contact with the team at Optalis Health & Rehabilitation of Troy.

Is Optalis Health & Rehabilitation of Troy Medicare or Medicaid certified?

Yes — Optalis Health & Rehabilitation of Troy is a CMS-certified provider of Medicare and Medicaid.

Guides for Better Senior Living

Care Cost Calculator: See Prices in Your Area

Nursing Home Data Explorer

Don’t Wait Too Long: 7 Red Flag Signs Your Parent Needs Assisted Living Now

The True Cost of Assisted Living in 2025 – And How Families Are Paying For It

Understanding Senior Living Costs: Pricing Models, Discounts & Financial Assistance