Orono Commons
Nursing Home · Fremont, CA
CMS overall rating Info The Overall CMS Rating is scored from 1 to 5 stars and combines results from health inspections, staffing levels, and quality measures. Health inspections carry the most weight. Staffing and quality scores can increase or decrease the final rating based on performance compared to state and national standards.

Orono Commons

Nursing Home · Fremont, CA
CMS overall rating Info The Overall CMS Rating is scored from 1 to 5 stars and combines results from health inspections, staffing levels, and quality measures. Health inspections carry the most weight. Staffing and quality scores can increase or decrease the final rating based on performance compared to state and national standards.
Calculator: See prices in your area
Orono Commons accepts Medicare, Medicaid, and private pay.

Overview of Orono Commons

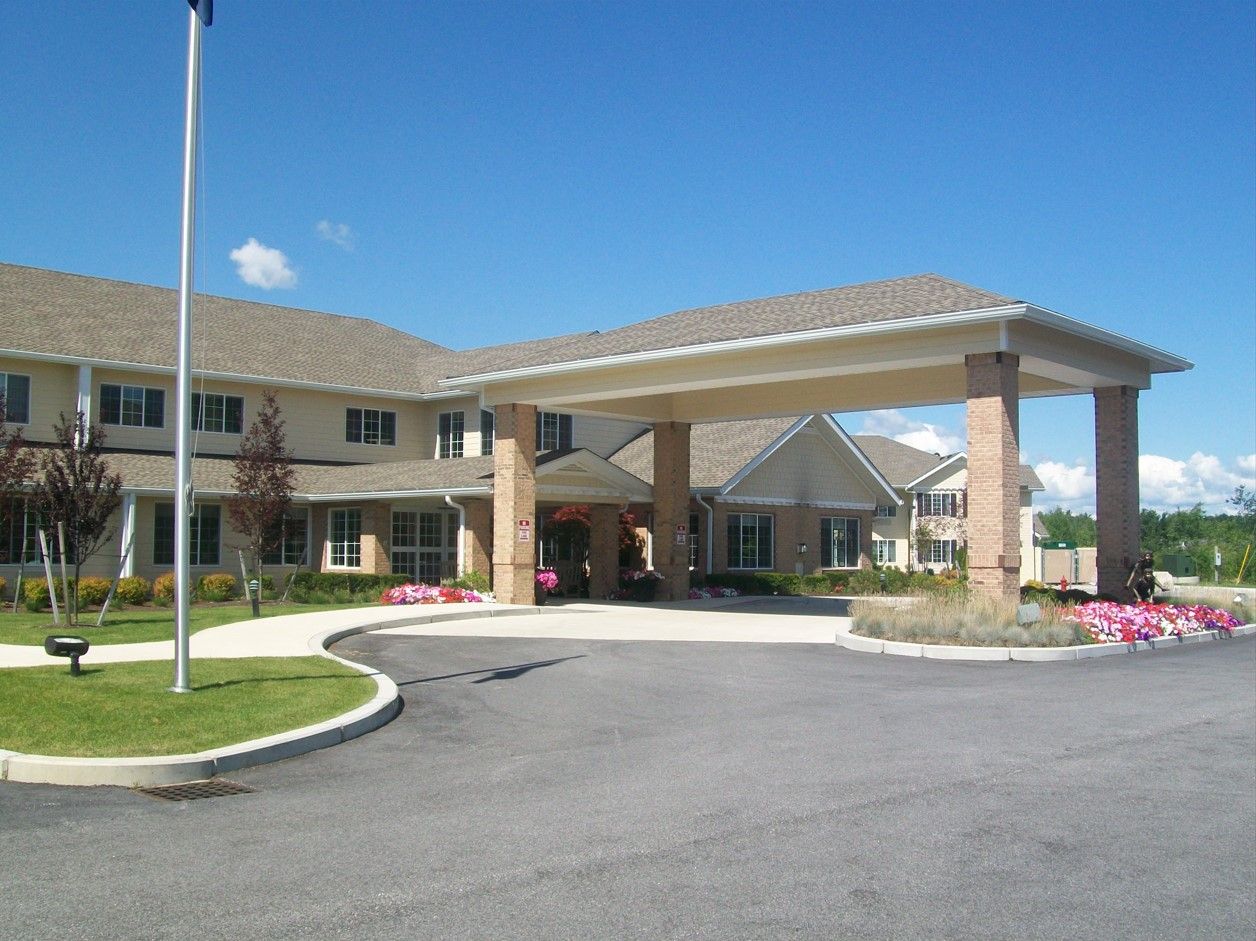
A member of the Genesis Healthcare Center, Orono Commons is the home for residents who seek to relax and recover. Specializing in short-term rehabilitation and long-term care, the multi-awarded community provides professional and compassionate service for its residents. Orono Commons cultivates the holistic needs of its residents in a home-like setting. 
The services are multidisciplinary for both skilled nursing and rehabilitation– focusing on post-surgical care, on-site therapy (physical, occupational, speech), strength conditioning, mobility improvement; colostomy care, dementia care, pain management, wound care; and medical professionals are on-call– medical directors, nurse practitioners, and physicians. 

(207) 866-4914

Quality ratings

Measured by Centers for Medicare & Medicaid Services (CMS)

Overall rating Info The Overall CMS Rating combines results from health inspections, staffing levels and quality measures. Health inspections carry the most weight. Staffing and quality scores can increase or decrease the final rating based on performance compared to state and national standards.
▼ 36.5% Below CA avg. ▼ 36.5% Below CA avg.Click the badge to see the full State ranking.Click here to see the full State ranking.
Health Inspection Info Based on the results of the facility's three most recent standard inspections and any complaint investigations. CMS reviews the number, scope, and severity of deficiencies, with more recent findings weighted more heavily.
▼ 28.5% Below CA avg. ▼ 28.5% Below CA avg.Click the badge to see the full State ranking.Click here to see the full State ranking.
Staffing Info Measures average nursing staff hours per resident per day, including Registered Nurses (RNs) and total nursing staff. Ratings are adjusted based on the level of care residents require and are compared to state and national benchmarks.
▼ 4.4% Below CA avg. ▼ 4.4% Below CA avg.Click the badge to see the full State ranking.Click here to see the full State ranking.
Quality Measures Info Based on clinical and physical health indicators reported to CMS, such as hospital readmissions, falls, pressure ulcers, and improvements in mobility. These measures reflect how well residents' health needs are being managed.
▼ 26.6% Below CA avg. ▼ 26.6% Below CA avg.Click the badge to see the full State ranking.Click here to see the full State ranking.

Staffing hours breakdown

Info Daily nursing hours per resident by staff type, reported to CMS. Higher is generally better — compare this facility to state and national averages to see where staffing stands.

Hours per resident per day — compared to California state averages

Total nursing care / resident Info This home is ranked 27th out of 30 homes in California. Total adjusted nursing hours per resident per day, combining RN, LPN, and aide time. CMS adjusts this for case-mix so facilities can be fairly compared.
3h 12m per day
Rank #27 / 30Nurse hours — State benchmarkedThis home is ranked 27th out of 30 homes in Maine. Shows adjusted nurse hours per resident per day benchmarked to the Maine average, with a ranking across 30 Maine SNFs. More hours mean more direct care. The national average is about 3.5 hrs; below 3.0 is a red flag.Click the rank badge to see the full State ranking.Click here to see the full State ranking.
This facility California avg (4h 13m per day)
vs California avg
-24%

3 of 6 metrics below state avg

Standout metric Physical Therapist is +100% above state avg
Staff typeHours / Day / Residentvs state avg
Registered Nurse (RN) Info RNs hold the highest nursing license and can assess residents, interpret test results, and direct care plans. More RN hours per day often signals stronger clinical oversight and faster response to health changes. 1h 24m per day ▲ 33% State avg: 1h 3m per day · National avg: 41m per day
LPN / LVN Info Licensed Practical Nurses (LPNs) or Licensed Vocational Nurses (LVNs) deliver routine hands-on care — medication administration, wound dressing, and monitoring vital signs. They work under RN supervision and make up a large share of daily bedside care. 9m per day ▼ 67% State avg: 27m per day · National avg: 52m per day
Nurse Aide Info Certified Nurse Aides (CNAs) provide the most direct day-to-day assistance: bathing, dressing, feeding, and mobility. Nurse aide hours are typically the largest staffing category and directly affect residents' quality of life. 2h 3m per day ▼ 28% State avg: 2h 51m per day · National avg: 2h 21m per day
Weekend Total Nursing Info Combined nursing hours (RN + LPN + Nurse Aide) per resident per day on weekends. Staffing often drops on weekends — this figure reveals whether the facility maintains adequate coverage outside of weekday hours. 3h 19m per day ▼ 15% State avg: 3h 55m per day · National avg: 3h 26m per day
Physical Therapist Info Hours per resident per day provided by licensed Physical Therapists (PTs) or PT Assistants. PT services help residents recover mobility after injury or illness and are especially important for post-acute (short-stay) rehabilitation. 8m per day ▲ 100% State avg: 4m per day · National avg: 4m per day
Weekend RN Info Registered nurse hours specifically on weekends. Facilities sometimes reduce RN presence on Saturdays and Sundays — a low weekend RN figure compared to weekday hours can indicate reduced clinical oversight when most administrative staff are absent. 56m per day ▲ 27% State avg: 44m per day · National avg: 29m per day

Capacity and availability

This home usually has limited availability

Occupancy between 85% and 95% suggests balanced demand.

Higher occupancy than the California average: 84.7%
Occupancy rate 94.2% Rank #130 / 247Occupancy rate — State benchmarkedThis home is ranked 130th out of 247 homes in Maine. Shows this facility's occupancy rate versus the Maine average, with its Statewide rank out of 247. Higher occupancy signals strong local demand and financial stability.Click the rank badge to see the full State ranking.Click here to see the full State ranking.
Avg. Length of Stay 96 days
Occupancy rate
94.2% Rank #130 / 247Occupancy rate — State benchmarkedThis home is ranked 130th out of 247 homes in Maine. Shows this facility's occupancy rate versus the Maine average, with its Statewide rank out of 247. Higher occupancy signals strong local demand and financial stability.Click the rank badge to see the full State ranking.Click here to see the full State ranking.
Avg. Length of Stay
96 days
Walk Score
Walk Score: 11 / 100 Rank #281 / 421Walk Score — State benchmarkedThis home is ranked 281st out of 421 homes in Maine. Shows how walkable this facility's neighborhood is compared to the average Walk Score across Maine SNFs. Higher scores benefit residents, families, and staff.Click the rank badge to see the full State ranking.Click here to see the full State ranking.
Car-dependent. Most errands require a car, with limited nearby walkable options.

Contact Orono Commons

Staffing Data

Reporting period: October 1 – December 31, 2025 (Q4 2025). Source: CMS Payroll-Based Journal report.

Total staff 142
Employees 90
Contractors 52
Staff to resident ratio 1.89:1
0% compared with California average
California average ratio: 1.81:1 California average ratio: 1.81:1See full California ranking
Avg staff/day 39
Average shift 8.1 hours
5% better than California average
California average: 7.7 hours California average shift: 7.7 hoursSee full California ranking
Total staff hours (quarter) 29,137

Nursing staff breakdown

Q4 2025 · Oct 1 – Dec 31 More info This data comes from the CMS Payroll-Based Journal report covering October 1 – December 31, 2025.
Registered Nurse

Manages medical care and health needs.

RN Staff 30
Average shift length Info Average shift length. Calculated as total hours divided by days worked and average staff per day. 8.8 hours

This role is partially covered by contractors.

Licensed Practical Nurse

Assists with medical care and medications.

LPN Staff 5
Average shift length Info Average shift length. Calculated as total hours divided by days worked and average staff per day. 10.5 hours

This role is partially covered by contractors.

Certified Nursing Assistant

Helps with daily care and mobility.

CNA Staff 66
Average shift length Info Average shift length. Calculated as total hours divided by days worked and average staff per day. 8.1 hours

This role is partially covered by contractors.

Contractor staffing

Q4 2025 · Oct 1 – Dec 31 More info This data comes from the CMS Payroll-Based Journal report covering October 1 – December 31, 2025.

Total hours from contractors

16.1%

4,679 contractor hours this quarter

Certified Nursing Assistant: 32 Registered Nurse: 11 Licensed Practical Nurse: 4 Occupational Therapy Assistant: 2 Medication Aide/Technician: 1 Medical Director: 1 Occupational Therapy Aide: 1

Staff by category

Q4 2025 · Oct 1 – Dec 31 More info This data comes from the CMS Payroll-Based Journal report covering October 1 – December 31, 2025.
Certified Nursing Assistant34326611,89392100%8.1
Registered Nurse1911307,12292100%8.8
Medication Aide/Technician8192,3519098%10
Other Dietary Services Staff4041,1798896%7.4
Clinical Nurse Specialist4049996267%8.1
Respiratory Therapy Technician3038776773%7.4
Licensed Practical Nurse1458156571%10.5
Physical Therapy Assistant3037257278%7.6
Speech Language Pathologist4044976267%7.1
Administrator1014966267%8
Nurse Practitioner1014685964%7.9
Other Social Services Staff1014645560%8.4
Physical Therapy Aide1014246267%6.8
Mental Health Service Worker2023513740%8.3
Qualified Social Worker3031794043%4.5
Occupational Therapy Aide0111712729%6.3
Occupational Therapy Assistant022773942%1.9
Medical Director011451112%4.1
Nurse Aide in Training101311%3
66 Certified Nursing Assistant
% of Days 100%
30 Registered Nurse
% of Days 100%
9 Medication Aide/Technician
% of Days 98%
4 Other Dietary Services Staff
% of Days 96%
4 Clinical Nurse Specialist
% of Days 67%
3 Respiratory Therapy Technician
% of Days 73%
5 Licensed Practical Nurse
% of Days 71%
3 Physical Therapy Assistant
% of Days 78%
4 Speech Language Pathologist
% of Days 67%
1 Administrator
% of Days 67%
1 Nurse Practitioner
% of Days 64%
1 Other Social Services Staff
% of Days 60%
1 Physical Therapy Aide
% of Days 67%
2 Mental Health Service Worker
% of Days 40%
3 Qualified Social Worker
% of Days 43%
1 Occupational Therapy Aide
% of Days 29%
2 Occupational Therapy Assistant
% of Days 42%
1 Medical Director
% of Days 12%
1 Nurse Aide in Training
% of Days 1%

Penalties and fines

Includes penalties issued in 2025

Federal penalties imposed by CMS for regulatory violations, including civil money penalties (fines) and denials of payment for new Medicare/Medicaid admissions.

Source: CMS Penalties Database (Data as of Jan 2026)

Total fines amount $10K Rank #23 / 30Federal fines — State benchmarkedThis home is ranked 23rd out of 30 homes in Maine. Shows this facility's cumulative CMS federal fine dollars versus the Maine average among facilities with fines, and where it ranks among 30 skilled nursing facilities in the pool. Lower total dollars mean a better rank.Click the rank badge to see the full State ranking.Click here to see the full State ranking.
57% lower than California average

California average: $24K

Number of fines 1
18% fewer fines than California average

California average: 1.2

Payment Denials Info Serious action where Medicare and/or Medicaid temporarily stops payments for new residents until issues are fixed. 0
100% fewer payment denials than California average

California average: 0.2

Fines amount comparison
This facility $10K
California average $24K
Penalty History

Penalties are imposed by CMS for violations of federal nursing home regulations.

1 penalty in the past 3 years

May 7, 2025 · $10K

Civil Money Penalty Info Fines imposed for noncompliance, which can be assessed per day or per instance of violation. May 7, 2025
$10K

Last updated: Jan 2026

Quality of care over time

These measures show how residents usually do over time at this home, based on health outcomes and preventive care.

High-risk clinical events score Info A composite score based on pressure ulcers, falls with injury, weight loss, walking ability decline, and activities of daily living decline. 16.7
18% worse than California average

California average: 14.2

Functional decline score Info A composite score based on activities of daily living decline, walking ability decline, and incontinence. 29.5
In line with California average

California average: 29.1

Long-stay resident measures
Below average California avg: 2.6 Info CMS star rating based on long-stay quality measure performance. 5 stars = significantly above average, 1 star = significantly below average.
Need for Help with Daily Activities Increased Info Percent of long-stay residents whose need for help with daily activities has increased 29.9%
15% worse than California average

California average: 26.0%

Walking Ability Worsened Info Percent of long-stay residents whose ability to move independently worsened 30.5%
In line with California average

California average: 31.4%

Low Risk Residents with Bowel/Bladder Incontinence Info Percent of low risk long-stay residents who lose control of their bowels or bladder 28.1%
6% better than California average

California average: 29.8%

Falls with Major Injury Info Percent of long-stay residents experiencing one or more falls with major injury 0.0%
100% better than California average

California average: 4.4%

High Risk Residents with Pressure Ulcers Info Percent of long-stay high risk residents with pressure ulcers 12.0%
168% worse than California average

California average: 4.5%

Urinary Tract Infection Info Percent of long-stay residents with a urinary tract infection 3.3%
19% worse than California average

California average: 2.8%

Lost Too Much Weight Info Percent of long-stay residents who lose too much weight 11.1%
102% worse than California average

California average: 5.5%

Depressive Symptoms Info Percent of long-stay residents who have depressive symptoms 10.1%
In line with California average

California average: 10.5%

Antipsychotic Use Info Percent of long-stay residents who received an antipsychotic medication 23.6%
19% worse than California average

California average: 19.8%

Pneumococcal Vaccine Info Percent of long-stay residents assessed and appropriately given the pneumococcal vaccine 53.4%
41% worse than California average

California average: 90.1%

Influenza Vaccine Info Percent of long-stay residents assessed and appropriately given the seasonal influenza vaccine 98.3%
In line with California average

California average: 95.5%

Hospitalizations per 1,000 days Info Number of hospitalizations per 1,000 long-stay resident days. 1.61
16% worse than California average

California average: 1.39

ED visits per 1,000 days Info Number of outpatient emergency department visits per 1,000 long-stay resident days. 0.76
63% better than California average

California average: 2.08

Short-stay resident measures
Above average California avg: 3.3 Info CMS star rating based on short-stay quality measure performance. 5 stars = much above average, 1 star = much below average.
Pneumococcal Vaccine Info Percent of short-stay residents assessed and appropriately given the pneumococcal vaccine 20.0%
72% worse than California average

California average: 70.8%

Antipsychotic medication increase Info Percent of short-stay residents who newly received an antipsychotic medication 1.8%
24% worse than California average

California average: 1.4%

Influenza Vaccine Info Percent of short-stay residents assessed and appropriately given the seasonal influenza vaccine 23.8%
68% worse than California average

California average: 74.5%

Re-hospitalized after SNF stay Info Percentage of short-stay residents who were re-hospitalized after their nursing home admission. 22.6%
10% worse than California average

California average: 20.5%

Emergency department visits Info Percentage of short-stay residents who had an outpatient emergency department visit. 6.5%
58% better than California average

California average: 15.6%

Falls with major injury Info Percentage of SNF residents who experience falls with major injury during their stay. 1.2%
55% worse than California average

California average: 0.8%

Ability to care for self at discharge Info Percentage of residents at or above expected ability to care for themselves at discharge. 57.1%
6% better than California average

California average: 53.7%

Successful return to home or community Info Rate of successful return to home or community from a skilled nursing facility. 56.1%
11% better than California average

California average: 50.6%

Breakdown by payment type

Medicare

46% of new residents, usually for short-term rehab.

Typical stay 1 months

Private pay

47% of new residents, often for short stays.

Typical stay 2 - 3 months

Medicaid

8% of new residents, often for long-term daily care.

Typical stay 2 years

Facility Characteristics

Source: CMS Long-Term Care Facility Characteristics (Data as of Jan 2026)

Total residents 75
Medicare
10
13.3% of residents
Medicaid
42
56% of residents
Private pay or other
23
30.7% of residents
Programs & Services
Nurse Aide Training

State-approved Nurse Aide Training and Competency Evaluation Program on-site

Finances and operations

Privately-owned community
Operated by a business corporation.
Home revenue
$13.9M
Profit
$957.5K
Privately-owned community Operated by a business corporation.
Home revenue
$13.9M Rank #17 / 36Revenue — State benchmarkedThis home is ranked 17th out of 36 homes in Maine. Shows this facility's annual revenue compared to the Maine SNF average. Higher revenue generally means more resources for staffing and capital — read alongside Payroll %.Click the rank badge to see the full State ranking.Click here to see the full State ranking.
Profit
$957.5K
Payroll costs Info The portion of the home's budget spent on staff, including nurses, caregivers, and other employees who support care and operations. Rank #22 / 36Payroll — State benchmarkedThis home is ranked 22nd out of 36 homes in Maine. Shows total annual staff payroll benchmarked to the Maine average. Higher payroll investment relative to peers often signals better staffing and less reliance on cheaper contract labor.Click the rank badge to see the full State ranking.Click here to see the full State ranking.
$7.1M
51.3% of revenue Rank #22 / 36Payroll % — State benchmarkedThis home is ranked 22nd out of 36 homes in Maine. Shows payroll as a percentage of revenue versus the Maine average. Well-run Maine SNFs typically land around 60–66% — the top third Statewide. Below 25% may signal understaffing or heavy agency use — read with Staffing ratings.Click the rank badge to see the full State ranking.Click here to see the full State ranking.
Other operating costs Info All remaining costs needed to run the home, such as food, utilities, building maintenance, supplies and administrative expenses.
$5.8M
Total costs $12.9M

Who this home usually serves

TYPE OF STAY

Mix of rehab and long-term care

This home supports both short-term rehab and long-term care, with residents staying for a wide range of durations.

Places of interest near Orono Commons

Address 0.8 miles from city center Info Estimated distance in miles from Orono's city center to Orono Commons's address, calculated via Google Maps. — 3.1 miles to nearest hospital (PCHC - Helen Hunt Health Center)

Calculate Travel Distance to Orono Commons

Add your location

Address

Financial Assistance for
Nursing Home in California

Orono Commons is located in Orono, California.
Here are the financial assistance programs available to residents in California.

Get Financial aid guidance

Multipurpose Senior Services Program

MSSP (Medi-Cal Waiver)

Age 65+
General California resident, Medi-Cal eligible, nursing home risk.
Income Limits (2025) ~$2,829/month 300% FBR, individual
Asset Limits $2,000 (individual), $3,000 (couple).
CA

County-managed; waitlists possible.

Benefits
In-home support (4-6 hours/day) Respite care (14 days/year) Meals (~$6/meal) Transportation (8 trips/month) Care management

In-Home Supportive Services (IHSS)

California IHSS

Age 65+
General California resident, Medicaid-eligible or low-income.
Income Limits ~$1,732/month individual, Medi-Cal threshold
Asset Limits $2,000 individual
CA

Can hire family as caregivers.

Benefits
Personal care (up to 283 hours/month) Homemaker services Respite (varies)

Multipurpose Senior Services Program (MSSP)

CA MSSP

Age 65+
General California resident, Medi-Cal-eligible, nursing home-eligible but community-capable.
Income Limits ~$2,829/month 300% FBR, individual
Asset Limits $2,000 individual
CA

Available in 38 counties; waitlists common.

Benefits
Case management Respite care (up to 10 days/year) Minor home mods (avg. $500) Adult day care (~$50/day)

Property Tax Postponement Program (PTP)

CA PTP

Age 62+
General California resident, own and live in home, 40% equity.
Income Limits (2025) ~$51,500/year household, adjusted annually
Asset Limits Equity-based; no strict asset cap.
CA

Deferred taxes accrue interest (5% as of 2024); repaid upon sale/death.

Benefits
Property tax deferral (avg. $1,000-$3,000/year, varies by county)

Assisted Living Waiver (ALW)

CA ALW

Age 65+ or disabled
General California resident, Medi-Cal-eligible, nursing home-eligible.
Income Limits ~$2,829/month 300% FBR, individual
Asset Limits $2,000 individual
CA

Available in 15 counties (e.g., LA, Sacramento); waitlists common.

Benefits
Personal care in ALFs (5-7 hours/day) Medication management Social services

California CARES Program

CA CARES

Age
General Caregivers of California residents 60+ needing help with 3+ daily activities; no caregiver age limit.
Income Limits No strict limit; cost-sharing above ~$2,500/month threshold.
Asset Limits Not applicable; need-based.
CA

High demand in urban areas; complements IHSS respite.

Benefits
Respite care (up to 10 days/year) Counseling (4-6 sessions/year) Training (2-3 workshops/year) Supplies (~$200/year)

Compare Nursing Home around Fremont

The information below is reported by the California Department of Social Services and Department of Public Health.

4 facilities compared · CMS & CA Dept. of Health data

Filter by care type
Mission Valley Post Acute
NH

Nursing Home Licensed facility providing 24/7 skilled nursing care for residents with complex, ongoing medical needs. Staffed by RNs, LPNs, and CNAs. Inspected and star-rated annually by CMS. Accepts Medicare (short-term rehab) and Medicaid (long-term care).

AL

Assisted Living A licensed, long-term care setting for seniors or individuals with disabilities who need help with daily activities — like bathing, dressing, and medication management — but not 24-hour skilled nursing. Offers housing, meals, and around-the-clock support while aiming to maximize resident independence.

Fremont (Centerville)85 85.3% +1%3.63 +21%-14%$0225.5-81A- 72 Kelly Bills$15.2M$5.6M36.6%55276
Windsor Country Drive Care Center
NH

Nursing Home Licensed facility providing 24/7 skilled nursing care for residents with complex, ongoing medical needs. Staffed by RNs, LPNs, and CNAs. Inspected and star-rated annually by CMS. Accepts Medicare (short-term rehab) and Medicaid (long-term care).

AL

Assisted Living A licensed, long-term care setting for seniors or individuals with disabilities who need help with daily activities — like bathing, dressing, and medication management — but not 24-hour skilled nursing. Offers housing, meals, and around-the-clock support while aiming to maximize resident independence.

Fremont (Centerville)126 83.8% -1%3.81 +48%-10%$0335.51109C+ 79 -$23.0M$10.5M45.5%55885
Fremont Healthcare Center
NH

Nursing Home Licensed facility providing 24/7 skilled nursing care for residents with complex, ongoing medical needs. Staffed by RNs, LPNs, and CNAs. Inspected and star-rated annually by CMS. Accepts Medicare (short-term rehab) and Medicaid (long-term care).

AL

Assisted Living A licensed, long-term care setting for seniors or individuals with disabilities who need help with daily activities — like bathing, dressing, and medication management — but not 24-hour skilled nursing. Offers housing, meals, and around-the-clock support while aiming to maximize resident independence.

Fremont (Sundale)115 89.6% +6%4.14 +55%-2%$12.1k224.4-103A+ 78 Fremont Holding Company Gp LLC$21.8M$10.9M50.1%56422
Orono Commons
NH

Nursing Home Licensed facility providing 24/7 skilled nursing care for residents with complex, ongoing medical needs. Staffed by RNs, LPNs, and CNAs. Inspected and star-rated annually by CMS. Accepts Medicare (short-term rehab) and Medicaid (long-term care).

AL

Assisted Living A licensed, long-term care setting for seniors or individuals with disabilities who need help with daily activities — like bathing, dressing, and medication management — but not 24-hour skilled nursing. Offers housing, meals, and around-the-clock support while aiming to maximize resident independence.

Orono90 94.2% +13%3.20 +41%-29%$10.4k4010.0170- 11 Genesis Healthcare Of Maine LLC$13.9M$7.1M51.3%205031

Frequently Asked Questions about Orono Commons

What neighborhood is Orono Commons in?

Orono Commons is in the Orono neighborhood.

Is Orono Commons in a walkable area?

Orono Commons has a walk score of 11. Car-dependent. Most errands require a car, with limited nearby walkable options.

What is the occupancy rate at Orono Commons?

Orono Commons's occupancy is 94.2%.

What is the phone number of Orono Commons?

(207) 866-4914 will put you in contact with the team at Orono Commons.

Is Orono Commons Medicare or Medicaid certified?

Yes — Orono Commons is a CMS-certified provider of Medicare and Medicaid.

Guides for Better Senior Living

Care Cost Calculator: See Prices in Your Area

Nursing Home Data Explorer

Don’t Wait Too Long: 7 Red Flag Signs Your Parent Needs Assisted Living Now

The True Cost of Assisted Living in 2025 – And How Families Are Paying For It

Understanding Senior Living Costs: Pricing Models, Discounts & Financial Assistance

Explore Open Rooms
1 Contact details
2 What type of senior care service are you looking for?
3 What budget do you have in mind for senior care?
4 How soon do you need to find care?
5 Additional details

Thank you for your interest!

Our team will be in touch shortly to help with next steps.