Park Central Care & Rehabilitation Center
CMS overall rating Info CMS (the Centers for Medicare & Medicaid Services) is the federal agency that rates nursing home quality. Its Overall Rating runs from 1 to 5 stars, combining health inspections, staffing, and quality measures, with inspections weighted most heavily.

Park Central Care & Rehabilitation Center

CMS overall rating Info CMS (the Centers for Medicare & Medicaid Services) is the federal agency that rates nursing home quality. Its Overall Rating runs from 1 to 5 stars, combining health inspections, staffing, and quality measures, with inspections weighted most heavily.
Calculator: See prices in your area
Park Central Care & Rehabilitation Center accepts Medicare, Medicaid, and private pay.

Overview of Park Central Care & Rehabilitation Center

Park Central Care, located in Fremont, CA, is a nursing and rehabilitation facility offering skilled nursing services and rehabilitation services to its residents. As part of their basic healthcare programs, they provide their residents with 24/7 certified nursing assistance; from assistance with mobility or activities of daily living, to regular health and wellbeing monitoring.
Here, the residents are also provided assistance with medication monitoring, and dietary services to ensure that they receive the proper nutrition and medication they need on regular intervals. Furthermore, regular activities and entertainment are also scheduled, to ensure that the residents are given enough opportunity to stay physically and mentally active, as well as engaged within their community.

(510) 797-5300

Quality ratings

Measured by Centers for Medicare & Medicaid Services (CMS)

Overall rating Info The Overall CMS Rating combines results from health inspections, staffing levels and quality measures. Health inspections carry the most weight. Staffing and quality scores can increase or decrease the final rating based on performance compared to state and national standards.
▼ 4.7% Below CA avg. ▼ 4.7% Below CA avg.CA average: 3.1Click the badge to see the full State ranking.Click here to see the full State ranking.
Health Inspection Info Based on the results of the facility's three most recent standard inspections and any complaint investigations. CMS reviews the number, scope, and severity of deficiencies, with more recent findings weighted more heavily.
▲ 7.3% Above CA avg. ▲ 7.3% Above CA avg.CA average: 2.8Click the badge to see the full State ranking.Click here to see the full State ranking.
Staffing Info Measures average nursing staff hours per resident per day, including Registered Nurses (RNs) and total nursing staff. Ratings are adjusted based on the level of care residents require and are compared to state and national benchmarks.
▼ 4.4% Below CA avg. ▼ 4.4% Below CA avg.CA average: 3.1Click the badge to see the full State ranking.Click here to see the full State ranking.
Quality Measures Info Based on clinical and physical health indicators reported to CMS, such as hospital readmissions, falls, pressure ulcers, and improvements in mobility. These measures reflect how well residents' health needs are being managed.
▼ 2.1% Below CA avg. ▼ 2.1% Below CA avg.CA average: 4.1Click the badge to see the full State ranking.Click here to see the full State ranking.

Staffing hours breakdown

Info Daily nursing hours per resident by staff type, reported to CMS. Higher is generally better — compare this facility to state and national averages to see where staffing stands.

Hours per resident per day — compared to California state averages

Total nursing care / resident Info This home is ranked 105th out of 354 homes in California for nurse hours. Total adjusted nursing hours per resident per day, combining RN, LPN, and aide time. CMS adjusts this for case-mix so facilities can be fairly compared.
4h 25m per day
Rank #105 / 354Nurse hours — State benchmarkedThis home is ranked 105th out of 354 homes in California. Shows adjusted nurse hours per resident per day benchmarked to the California average, with a ranking across 354 California facilities. More hours mean more direct care. The national average is about 3.5 hrs; below 3.0 is a red flag.Rankings are based only on facilities in California that report data for that category. Facilities without available data are excluded from the ranking.Click the rank badge to see the full State ranking.Click here to see the full State ranking.
This facility California avg (4h 13m per day)
vs California avg
+5%

3 of 6 metrics below state avg

Standout metric Physical Therapist is +81% above state avg
Staff typeHours / Day / Residentvs state avg
Registered Nurse (RN) Info RNs hold the highest nursing license and can assess residents, interpret test results, and direct care plans. More RN hours per day often signals stronger clinical oversight and faster response to health changes. 34m per day ▼ 13% State avg: 39m per day · National avg: 41m per day
LPN / LVN Info Licensed Practical Nurses (LPNs) or Licensed Vocational Nurses (LVNs) deliver routine hands-on care — medication administration, wound dressing, and monitoring vital signs. They work under RN supervision and make up a large share of daily bedside care. 58m per day ▼ 20% State avg: 1h 13m per day · National avg: 52m per day
Nurse Aide Info Certified Nurse Aides (CNAs) provide the most direct day-to-day assistance: bathing, dressing, feeding, and mobility. Nurse aide hours are typically the largest staffing category and directly affect residents' quality of life. 2h 51m per day ▲ 8% State avg: 2h 39m per day · National avg: 2h 21m per day
Weekend Total Nursing Info Combined nursing hours (RN + LPN + Nurse Aide) per resident per day on weekends. Staffing often drops on weekends — this figure reveals whether the facility maintains adequate coverage outside of weekday hours. 4h 7m per day ■ Avg State avg: 4h 5m per day · National avg: 3h 26m per day
Physical Therapist Info Hours per resident per day provided by licensed Physical Therapists (PTs) or PT Assistants. PT services help residents recover mobility after injury or illness and are especially important for post-acute (short-stay) rehabilitation. 9m per day ▲ 81% State avg: 5m per day · National avg: 4m per day
Weekend RN Info Registered nurse hours specifically on weekends. Facilities sometimes reduce RN presence on Saturdays and Sundays — a low weekend RN figure compared to weekday hours can indicate reduced clinical oversight when most administrative staff are absent. 27m per day ▼ 9% State avg: 30m per day · National avg: 29m per day

Capacity and availability

This home usually has availability

Lower occupancy than the California average: 84.7%
Occupancy rate
62.6% Rank #1172 / 1537Occupancy rate — State benchmarkedThis home is ranked 1172nd out of 1537 homes in California. Shows this facility's occupancy rate versus the California average, with its Statewide rank out of 1537. Higher occupancy signals strong local demand and financial stability.Rankings are based only on facilities in California that report data for that category. Facilities without available data are excluded from the ranking.Click the rank badge to see the full State ranking.Click here to see the full State ranking.
Avg. Length of Stay
94 days
Bed community size
99-bed community Rank #725 / 1657Bed count — State benchmarkedThis home is ranked 725th out of 1657 homes in California. Shows this facility's certified or reported bed count compared to other California facilities. Larger communities may offer more amenities, programs, and on-site services for residents and families.Rankings are based only on facilities in California that report data for that category. Facilities without available data are excluded from the ranking.Click the rank badge to see the full State ranking.Click here to see the full State ranking.
A larger shared setting that may offer more common spaces and organized community services.
Years in operation
28 years in operation Rank #158 / 1487Years in operation — State benchmarkedThis home is ranked 158th out of 1487 homes in California. Shows how long this facility has been in operation compared to other California facilities. Longer operating histories may benefit residents, families, and staff.Rankings are based only on facilities in California that report data for that category. Facilities without available data are excluded from the ranking.Click the rank badge to see the full State ranking.Click here to see the full State ranking.
A longer operating history, which may indicate experience navigating regulations and delivering ongoing care.
Walk Score
Walk Score: 75 / 100 Rank #563 / 2092Walk Score — State benchmarkedThis home is ranked 563rd out of 2092 homes in California. Shows how walkable this facility's neighborhood is compared to the average Walk Score across California facilities. Higher scores benefit residents, families, and staff.Rankings are based only on facilities in California that report data for that category. Facilities without available data are excluded from the ranking.Click the rank badge to see the full State ranking.Click here to see the full State ranking.
Very walkable. Most errands can be accomplished on foot, and many essentials are within a short walk.
BBB Rating
BBB Rating: A+ (Not Accredited)
An independent rating from the Better Business Bureau based on factors such as complaint history, transparency, and business practices.
How BBB ratings work

About this community

License Details

Status2009-06-24t00:00:00z
CMS Certification Number56298

Contact Park Central Care & Rehabilitation Center

Inspection History

In California, the Department of Social Services (for assisted living facilities) and the Department of Public Health (for nursing homes) conduct inspections to ensure resident safety and regulatory compliance.

Health Inspection History

Inspections since 2018
Total health inspections 3

California average 12.5


Last Health inspection on Sep 2023
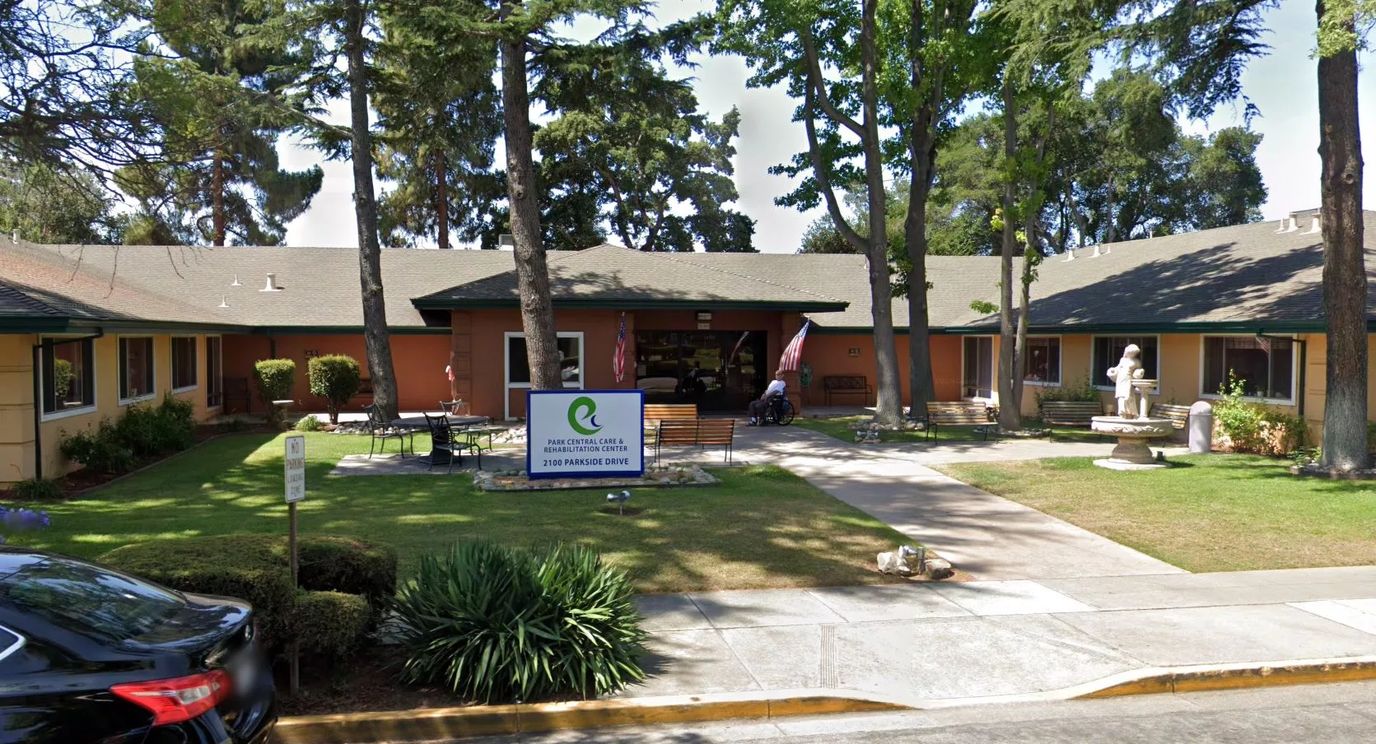
Total health citations
20 Rank #40 / 361Health citations — State benchmarkedThis home is ranked 40th out of 361 homes in California. Shows this facility's total health deficiency citations benchmarked to the California State average, with a ranking across all 361 CA facilities. Lower citation counts earn a better rank.Rankings are based only on facilities in California that report data for that category. Facilities without available data are excluded from the ranking.Click the rank badge to see the full State ranking.Click here to see the full State ranking.

California average 50.2

Citations per inspection
6.67 Rank #320 / 361Citations per inspection — State benchmarkedThis home is ranked 320th out of 361 homes in California. Shows average deficiency citations per CMS inspection for this facility versus the California mean across 361 facilities with citation data. Lower is better.Rankings are based only on facilities in California that report data for that category. Facilities without available data are excluded from the ranking.Click the rank badge to see the full State ranking.Click here to see the full State ranking.

California average 4.65


Health citations are formal notices following inspections when they fail to comply with safety and care standards.

All 20 citations resulted from standard inspections.

Breakdown of citation severity (last 8 years)
Critical health citations
0
100% better than California average

California average: 0.4


Serious health citations
1
In line with California average

California average: 1

0 critical citations California average: 0.4

1 serious citation California average: 1

19 moderate citations California average: 47.2

0 minor citations California average: 1.5
Citations history (last 8 years)
Administration moderate citation Sep 01, 2023
Corrected

Environmental moderate citation Sep 01, 2023
Corrected

Nursing Services moderate citation Sep 01, 2023
Corrected

Nursing Services moderate citation Sep 01, 2023
Corrected

Staffing Data

Reporting period: October 1 – December 31, 2025 (Q4 2025). Source: CMS Payroll-Based Journal report.

Total staff 172
Employees 106
Contractors 66
Staff to resident ratio 2.32 : 1
28% more staff per resident than California average
California average ratio: 1.81 : 1 California average ratio: 1.81 : 1See full California ranking
Avg staff/day 56
Average shift 7.4 hours
0% compared with California average
California average: 7.7 hours California average shift: 7.7 hoursSee full California ranking
Total staff hours (quarter) 37,975

Nursing staff breakdown

Q4 2025 · Oct 1 – Dec 31 More info This data comes from the CMS Payroll-Based Journal report covering October 1 – December 31, 2025.
Registered Nurse

Manages medical care and health needs.

RN Staff Info All 9 RN Staff are full-time employees. No contractors work on this role. 9
Average shift length Info Average shift length. Calculated as total hours divided by days worked and average staff per day. 8 hours
Licensed Practical Nurse

Assists with medical care and medications.

LPN Staff Info All 22 LPN Staff are full-time employees. No contractors work on this role. 22
Average shift length Info Average shift length. Calculated as total hours divided by days worked and average staff per day. 8 hours
Certified Nursing Assistant

Helps with daily care and mobility.

CNA Staff Info 117 total: 54 full-time employees and 63 contractors. 117
Average shift length Info Average shift length. Calculated as total hours divided by days worked and average staff per day. 7.4 hours

Contractor staffing

Q4 2025 · Oct 1 – Dec 31 More info This data comes from the CMS Payroll-Based Journal report covering October 1 – December 31, 2025.

Total hours from contractors

13.3%

5,054 contractor hours this quarter

Certified Nursing Assistant: 63 Respiratory Therapy Technician: 2 Physical Therapy Assistant: 1

Staff by category

Q4 2025 · Oct 1 – Dec 31 More info This data comes from the CMS Payroll-Based Journal report covering October 1 – December 31, 2025.
Certified Nursing Assistant546311721,95092100%7.4
Licensed Practical Nurse220226,94492100%8
Registered Nurse9093,81392100%8
Physical Therapy Assistant8191,3967885%6.7
Respiratory Therapy Technician6281,1579098%5.6
Speech Language Pathologist3031,1067683%6.9
Nurse Practitioner1015286672%8
RN Director of Nursing1015155863%8.9
Administrator1013966672%6
Physical Therapy Aide1011704347%4
117 Certified Nursing Assistant
% of Days 100%
22 Licensed Practical Nurse
% of Days 100%
9 Registered Nurse
% of Days 100%
9 Physical Therapy Assistant
% of Days 85%
8 Respiratory Therapy Technician
% of Days 98%
3 Speech Language Pathologist
% of Days 83%
1 Nurse Practitioner
% of Days 72%
1 RN Director of Nursing
% of Days 63%
1 Administrator
% of Days 72%
1 Physical Therapy Aide
% of Days 47%

Penalties and fines

Federal penalties imposed by CMS for regulatory violations, including civil money penalties (fines) and denials of payment for new Medicare/Medicaid admissions.

Source: CMS Penalties Database

No penalties in the past 3 years

No civil money penalties or payment denials were reported in the last 3 years.

Quality of care over time

These measures show how residents usually do over time at this home, based on health outcomes and preventive care.

High-risk clinical events score Info A composite score based on pressure ulcers, falls with injury, weight loss, walking ability decline, and activities of daily living decline. 12.6
90% worse than California average

California average: 6.6

Functional decline score Info A composite score based on activities of daily living decline, walking ability decline, and incontinence. 19.8
74% worse than California average

California average: 11.3

Long-stay resident measures
Above average California avg: 4.2 Info CMS star rating based on long-stay quality measure performance. 5 stars = significantly above average, 1 star = significantly below average.
Need for Help with Daily Activities Increased Info Percent of long-stay residents whose need for help with daily activities has increased 27.7%
150% worse than California average

California average: 11.1%

Walking Ability Worsened Info Percent of long-stay residents whose ability to move independently worsened 17.5%
46% worse than California average

California average: 12.0%

Low Risk Residents with Bowel/Bladder Incontinence Info Percent of low risk long-stay residents who lose control of their bowels or bladder 14.2%
25% worse than California average

California average: 11.3%

Falls with Major Injury Info Percent of long-stay residents experiencing one or more falls with major injury 3.3%
99% worse than California average

California average: 1.7%

High Risk Residents with Pressure Ulcers Info Percent of long-stay high risk residents with pressure ulcers 5.5%
12% worse than California average

California average: 5.0%

Urinary Tract Infection Info Percent of long-stay residents with a urinary tract infection 1.0%
17% better than California average

California average: 1.2%

Lost Too Much Weight Info Percent of long-stay residents who lose too much weight 9.1%
117% worse than California average

California average: 4.2%

Depressive Symptoms Info Percent of long-stay residents who have depressive symptoms 0.0%
100% better than California average

California average: 6.7%

Antipsychotic Use Info Percent of long-stay residents who received an antipsychotic medication 9.2%
8% better than California average

California average: 10.1%

Pneumococcal Vaccine Info Percent of long-stay residents assessed and appropriately given the pneumococcal vaccine 100.0%
In line with California average

California average: 98.5%

Influenza Vaccine Info Percent of long-stay residents assessed and appropriately given the seasonal influenza vaccine 100.0%
In line with California average

California average: 98.2%

Hospitalizations per 1,000 days Info Number of hospitalizations per 1,000 long-stay resident days. 2.05
9% better than California average

California average: 2.25

ED visits per 1,000 days Info Number of outpatient emergency department visits per 1,000 long-stay resident days. 0.50
69% better than California average

California average: 1.59

Short-stay resident measures
Significantly above average California avg: 3.5 Info CMS star rating based on short-stay quality measure performance. 5 stars = much above average, 1 star = much below average.
Pneumococcal Vaccine Info Percent of short-stay residents assessed and appropriately given the pneumococcal vaccine 96.9%
In line with California average

California average: 94.0%

Antipsychotic medication increase Info Percent of short-stay residents who newly received an antipsychotic medication 0.5%
68% better than California average

California average: 1.5%

Influenza Vaccine Info Percent of short-stay residents assessed and appropriately given the seasonal influenza vaccine 97.4%
In line with California average

California average: 93.2%

Re-hospitalized after SNF stay Info Percentage of short-stay residents who were re-hospitalized after their nursing home admission. 25.7%
11% worse than California average

California average: 23.2%

Emergency department visits Info Percentage of short-stay residents who had an outpatient emergency department visit. 6.0%
46% better than California average

California average: 11.2%

Falls with major injury Info Percentage of SNF residents who experience falls with major injury during their stay. 1.6%
103% worse than California average

California average: 0.8%

Ability to care for self at discharge Info Percentage of residents at or above expected ability to care for themselves at discharge. 48.0%
11% worse than California average

California average: 53.7%

Successful return to home or community Info Rate of successful return to home or community from a skilled nursing facility. 55.4%
10% better than California average

California average: 50.6%

Breakdown by payment type

Medicare

54% of new residents, usually for short-term rehab.

Typical stay 1 - 2 months

Private pay

36% of new residents, often for short stays.

Typical stay 1 - 2 months

Medicaid

11% of new residents, often for long-term daily care.

Typical stay 1 - 2 years

Facility Characteristics

Source: CMS Long-Term Care Facility Characteristics (Data as of Jan 2026)

Total residents 74
Medicare
18
24.3% of residents
Medicaid
36
48.6% of residents
Private pay or other
20
27% of residents
Programs & Services
Residents Group

Residents meet regularly to discuss policies, care quality, and activities

Active Resident Council

Organized group of residents that meets regularly to discuss facility policies, quality of life, and activities.

Finances and operations

Based on CMS SNF Cost Report for fiscal year ending in 12/2023.

Voluntary non-profit community
Operated by a church.
Net patient revenue Info Net patient revenue — what the home actually collects for resident care, after contractual allowances, bad debt and discounts are subtracted from its gross charges (CMS cost report, Worksheet G-3). It covers resident care only; money the home earns from other sources is shown separately as "Other income."
$9.9M
Net patient income Info Net patient income: net patient revenue minus the home's total operating expenses. A positive figure means it earns more from resident care than it spends to deliver it; a negative figure means the opposite. It excludes non-operating "other income."
-$470.5K
Voluntary non-profit community Operated by a church.
Net patient revenue Info Net patient revenue — what the home actually collects for resident care, after contractual allowances, bad debt and discounts are subtracted from its gross charges (CMS cost report, Worksheet G-3). It covers resident care only; money the home earns from other sources is shown separately as "Other income."
$9.9M Rank #304 / 355Revenue — State benchmarkedThis home is ranked 304th out of 355 homes in California. Shows this facility's annual revenue compared to the California average. Higher revenue generally means more resources for staffing and capital — read alongside Payroll %.Rankings are based only on facilities in California that report data for that category. Facilities without available data are excluded from the ranking.Click the rank badge to see the full State ranking.Click here to see the full State ranking.
Net patient income Info Net patient income: net patient revenue minus the home's total operating expenses. A positive figure means it earns more from resident care than it spends to deliver it; a negative figure means the opposite. It excludes non-operating "other income."
-$470.5K
Other income Info Money the home earns outside of resident care — such as investments, grants, rentals and other non-operating sources (CMS cost report, Worksheet G-3). It is tracked separately from net patient revenue: it is not part of that figure, and it is not included in net patient income.
$88.0K
Payroll costs Info Staff salaries plus wage-related costs — benefits such as payroll taxes, health insurance and retirement — from the home's own accounting records (CMS cost report, Worksheet A). Contract or agency labor is counted separately, under other operating costs. Rank #234 / 355Payroll — State benchmarkedThis home is ranked 234th out of 355 homes in California. Shows total annual staff payroll benchmarked to the California average. Higher payroll investment relative to peers often signals better staffing and less reliance on cheaper contract labor.Rankings are based only on facilities in California that report data for that category. Facilities without available data are excluded from the ranking.Click the rank badge to see the full State ranking.Click here to see the full State ranking.
$6.7M 67.4% of net patient revenue Info Payroll as a share of revenue: staff salaries and wage-related benefits divided by net patient revenue. A higher figure means more of each revenue dollar goes to staff pay. Rank #7 / 355Payroll % — State benchmarkedThis home is ranked 7th out of 355 homes in California. Shows payroll as a percentage of revenue versus the California average. Well-run California facilities typically land around 56–67% — the top third Statewide. Below 25% may signal understaffing or heavy agency use — read with Staffing ratings.Rankings are based only on facilities in California that report data for that category. Facilities without available data are excluded from the ranking.Click the rank badge to see the full State ranking.Click here to see the full State ranking.
Other operating costs Info Everything it costs to run the home apart from payroll — food, utilities, supplies, maintenance, contract labor and administration. Calculated as total operating expense minus payroll (staff salaries and wage-related benefits).
$3.7M
Total costs Info The home's total operating expense for the year — all the costs of running it, salaries included (CMS cost report, Worksheet G-3).
$10.4M

Who this home usually serves

TYPE OF STAY

Mostly short-term rehab stays

Most residents typically stay for a few weeks or months before returning home or moving on.

Most new residents arrive under Medicare (54% of admissions), and a typical Medicare stay runs around 1 - 2 months.

Admissions
214 total

Coverage residents most often arrive under.

Medicare 54%
Private pay 36%
Medicaid 11%
Discharges
224 total

Coverage residents most often leave under.

Medicare 48%
Private pay 35%
Medicaid 17%

Places of interest near Park Central Care & Rehabilitation Center

Address 1.1 miles from city center Info Estimated distance in miles from Fremont's city center to Park Central Care & Rehabilitation Center's address, calculated via Google Maps.

Calculate Travel Distance to Park Central Care & Rehabilitation Center

Add your location

Address

Compare Nursing Homes around Fremont

The information below is reported by the California Department of Social Services and Department of Public Health.

5 facilities compared · CMS & CA Dept. of Health data

Mission Valley Post Acute
NH
NC
Fremont (Centerville)
85
Facility 85
CA AVG 103
Rank #884 / 1657
85.3%
Facility 85.3%
CA AVG 84.7%
Rank #452 / 1537
+1%
3.63
Facility 3.63
CA AVG 4.22
Rank #269 / 354
+21%-14%
$0
Facility $0
CA AVG $56.5k
Rank #1 / 362
-
22
Facility 22
CA AVG 50.2
Rank #57 / 361
5.5
Facility 5.5
CA AVG 4.6
Rank #277 / 361
-82A
72
Facility 72
CA AVG 57
Rank #674 / 2092
Kelly Bills
$13.2M
Facility $13.2M
CA AVG $17.0M
Rank #206 / 355
$5.4M
Facility $5.4M
CA AVG $7.0M
Rank #273 / 355
41.2%
Facility 41.2%
CA AVG 45.2%
Rank #308 / 355
55276
Niles Canyon Post Acute
NH
Fremont (Canyon Heights - Vallejo Mills)
73
Facility 73
CA AVG 103
Rank #979 / 1657
77.3%
Facility 77.3%
CA AVG 84.7%
Rank #749 / 1537
-9%
4.24
Facility 4.24
CA AVG 4.22
Rank #138 / 354
-52%+1%
$6.3k
Facility $6.3k
CA AVG $56.5k
Rank #218 / 362
-
10
Facility 10
CA AVG 50.2
Rank #7 / 361
3.3
Facility 3.3
CA AVG 4.6
Rank #90 / 361
-64A
30
Facility 30
CA AVG 57
Rank #1720 / 2092
-
$10.8M
Facility $10.8M
CA AVG $17.0M
Rank #292 / 355
$5.1M
Facility $5.1M
CA AVG $7.0M
Rank #253 / 355
47.1%
Facility 47.1%
CA AVG 45.2%
Rank #36 / 355
55562
Fremont Healthcare Center
NH
NC
Fremont (Sundale)
115
Facility 115
CA AVG 103
Rank #616 / 1657
89.6%
Facility 89.6%
CA AVG 84.7%
Rank #335 / 1537
+6%
4.14
Facility 4.14
CA AVG 4.22
Rank #160 / 354
+55%-2%
$12.1k
Facility $12.1k
CA AVG $56.5k
Rank #250 / 362
-
22
Facility 22
CA AVG 50.2
Rank #57 / 361
4.4
Facility 4.4
CA AVG 4.6
Rank #207 / 361
-103A+
78
Facility 78
CA AVG 57
Rank #486 / 2092
Fremont Holding Company Gp LLC
$16.5M
Facility $16.5M
CA AVG $17.0M
Rank #119 / 355
$8.2M
Facility $8.2M
CA AVG $7.0M
Rank #101 / 355
49.9%
Facility 49.9%
CA AVG 45.2%
Rank #165 / 355
56422
Windsor Country Drive Care Center
NH
AL
Fremont (Centerville)
126
Facility 126
CA AVG 103
Rank #520 / 1657
83.8%
Facility 83.8%
CA AVG 84.7%
Rank #495 / 1537
-1%
3.81
Facility 3.81
CA AVG 4.22
Rank #229 / 354
+48%-10%
$0
Facility $0
CA AVG $56.5k
Rank #1 / 362
-
33
Facility 33
CA AVG 50.2
Rank #136 / 361
5.5
Facility 5.5
CA AVG 4.6
Rank #277 / 361
1112C+
79
Facility 79
CA AVG 57
Rank #451 / 2092
-
$17.4M
Facility $17.4M
CA AVG $17.0M
Rank #106 / 355
$9.3M
Facility $9.3M
CA AVG $7.0M
Rank #114 / 355
53.3%
Facility 53.3%
CA AVG 45.2%
Rank #215 / 355
55885
Park Central Care & Rehabilitation Center
NH
Fremont (Centerville)
99
Facility 99
CA AVG 103
Rank #725 / 1657
62.6%
Facility 62.6%
CA AVG 84.7%
Rank #1172 / 1537
-26%
4.42
Facility 4.42
CA AVG 4.22
Rank #105 / 354
-42%+5%
$0
Facility $0
CA AVG $56.5k
Rank #1 / 362
-
20
Facility 20
CA AVG 50.2
Rank #40 / 361
6.7
Facility 6.7
CA AVG 4.6
Rank #320 / 361
162A+
75
Facility 75
CA AVG 57
Rank #563 / 2092
Antony Thekkek
$9.9M
Facility $9.9M
CA AVG $17.0M
Rank #304 / 355
$6.7M
Facility $6.7M
CA AVG $7.0M
Rank #234 / 355
67.4%
Facility 67.4%
CA AVG 45.2%
Rank #7 / 355
56298

Financial Assistance for
Nursing Home in California

Park Central Care & Rehabilitation Center is located in Fremont, California.
Here are the financial assistance programs available to residents in California.

Get Financial aid guidance

Multipurpose Senior Services Program

MSSP (Medi-Cal Waiver)

Age 65+
General California resident, Medi-Cal eligible, nursing home risk.
Income Limits (2025) ~$2,829/month 300% FBR, individual
Asset Limits $2,000 (individual), $3,000 (couple).
CA

County-managed; waitlists possible.

Benefits
In-home support (4-6 hours/day) Respite care (14 days/year) Meals (~$6/meal) Transportation (8 trips/month) Care management

In-Home Supportive Services (IHSS)

California IHSS

Age 65+
General California resident, Medicaid-eligible or low-income.
Income Limits ~$1,732/month individual, Medi-Cal threshold
Asset Limits $2,000 individual
CA

Can hire family as caregivers.

Benefits
Personal care (up to 283 hours/month) Homemaker services Respite (varies)

Multipurpose Senior Services Program (MSSP)

CA MSSP

Age 65+
General California resident, Medi-Cal-eligible, nursing home-eligible but community-capable.
Income Limits ~$2,829/month 300% FBR, individual
Asset Limits $2,000 individual
CA

Available in 38 counties; waitlists common.

Benefits
Case management Respite care (up to 10 days/year) Minor home mods (avg. $500) Adult day care (~$50/day)

Property Tax Postponement Program (PTP)

CA PTP

Age 62+
General California resident, own and live in home, 40% equity.
Income Limits (2025) ~$51,500/year household, adjusted annually
Asset Limits Equity-based; no strict asset cap.
CA

Deferred taxes accrue interest (5% as of 2024); repaid upon sale/death.

Benefits
Property tax deferral (avg. $1,000-$3,000/year, varies by county)

Assisted Living Waiver (ALW)

CA ALW

Age 65+ or disabled
General California resident, Medi-Cal-eligible, nursing home-eligible.
Income Limits ~$2,829/month 300% FBR, individual
Asset Limits $2,000 individual
CA

Available in 15 counties (e.g., LA, Sacramento); waitlists common.

Benefits
Personal care in ALFs (5-7 hours/day) Medication management Social services

California CARES Program

CA CARES

Age
General Caregivers of California residents 60+ needing help with 3+ daily activities; no caregiver age limit.
Income Limits No strict limit; cost-sharing above ~$2,500/month threshold.
Asset Limits Not applicable; need-based.
CA

High demand in urban areas; complements IHSS respite.

Benefits
Respite care (up to 10 days/year) Counseling (4-6 sessions/year) Training (2-3 workshops/year) Supplies (~$200/year)

Frequently Asked Questions about Park Central Care & Rehabilitation Center

What neighborhood is Park Central Care & Rehabilitation Center in?

Park Central Care & Rehabilitation Center is in the Centerville neighborhood of Fremont.

Is Park Central Care & Rehabilitation Center in a walkable area?

Park Central Care & Rehabilitation Center has a walk score of 75. Very walkable. Most errands can be accomplished on foot, and many essentials are within a short walk.

What is the occupancy rate at Park Central Care & Rehabilitation Center?

Park Central Care & Rehabilitation Center's occupancy is 58.5%.

Are there photos of Park Central Care & Rehabilitation Center?

Yes — there are 2 photos of Park Central Care & Rehabilitation Center in the photo gallery on this page.

What is the address of Park Central Care & Rehabilitation Center?

Park Central Care & Rehabilitation Center is located at 2100 Parkside Dr, Fremont, CA 94536.

What is the phone number of Park Central Care & Rehabilitation Center?

(510) 797-5300 will put you in contact with the team at Park Central Care & Rehabilitation Center.

Is Park Central Care & Rehabilitation Center Medicare or Medicaid certified?

Yes — Park Central Care & Rehabilitation Center is a CMS-certified provider of Medicare and Medicaid.

Guides for Better Senior Living

Care Cost Calculator: See Prices in Your Area

Nursing Home Data Explorer

Don’t Wait Too Long: 7 Red Flag Signs Your Parent Needs Assisted Living Now

The True Cost of Assisted Living in 2025 – And How Families Are Paying For It

Understanding Senior Living Costs: Pricing Models, Discounts & Financial Assistance