Park View Post Acute

Nursing Home
Overview of Park View Post Acute

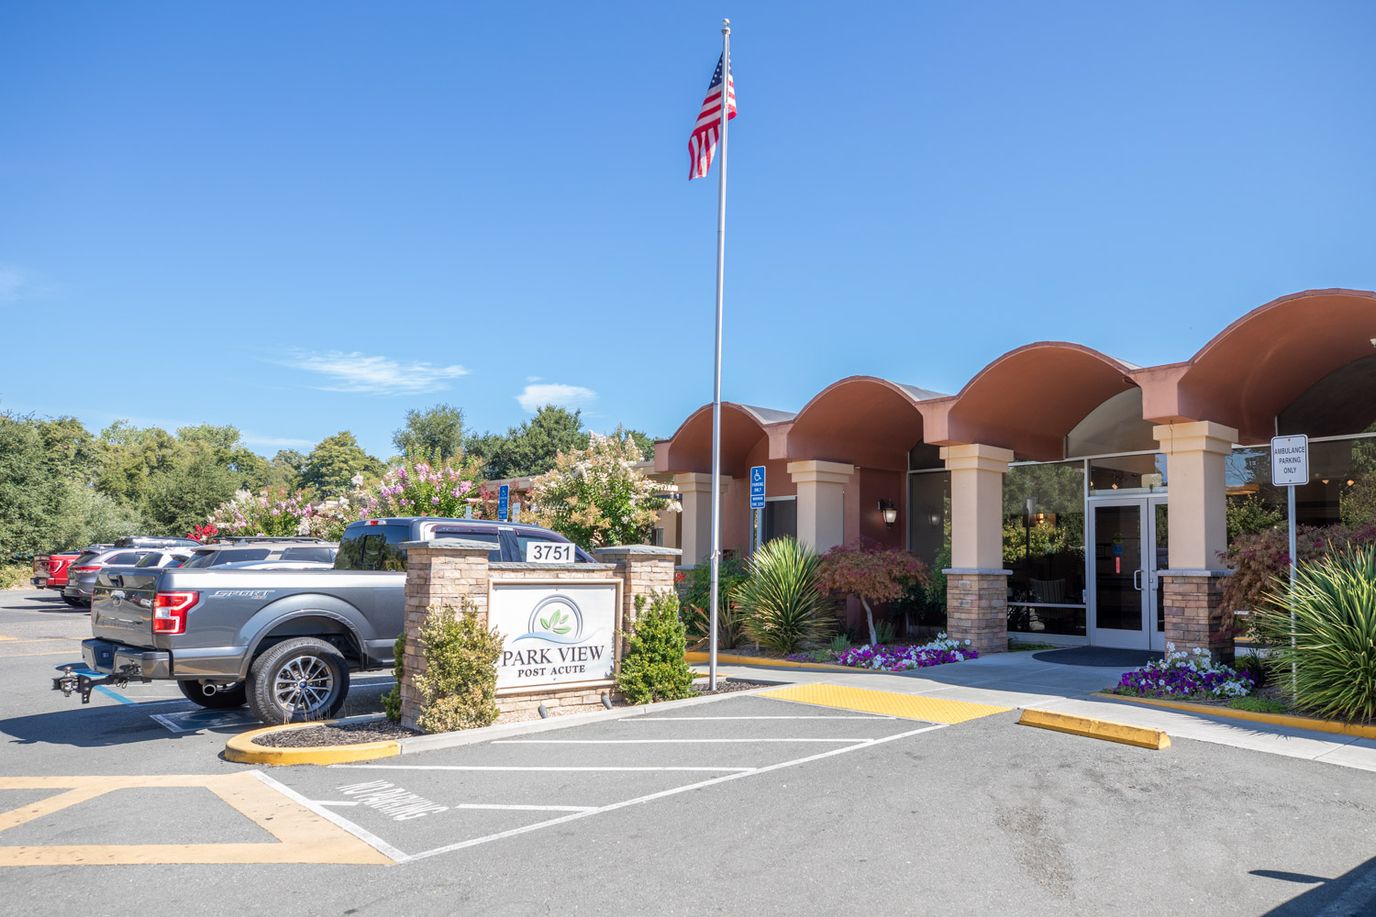
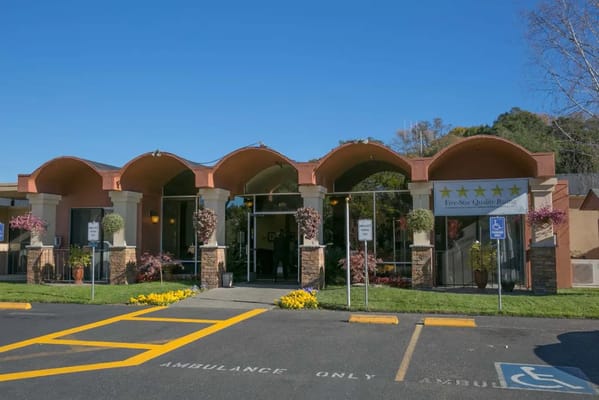
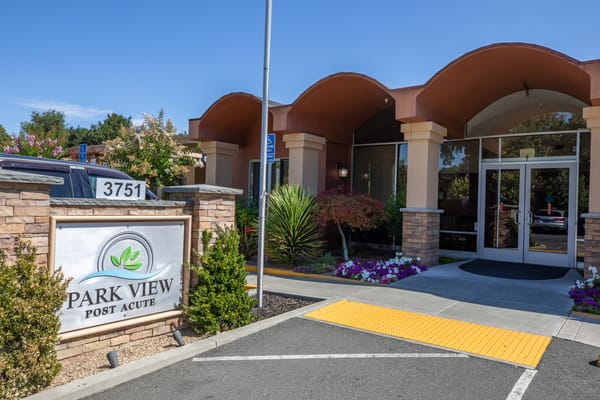
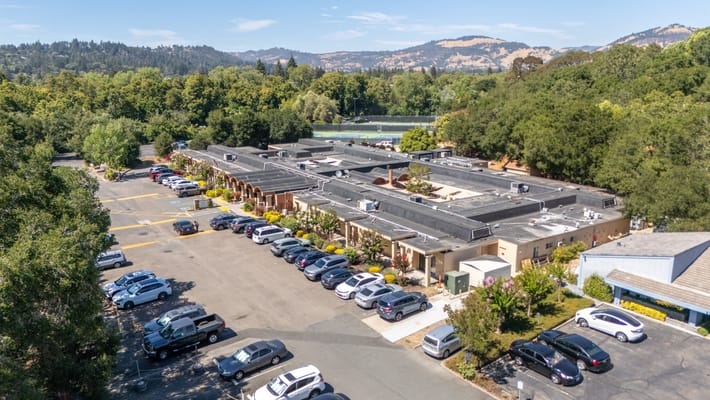
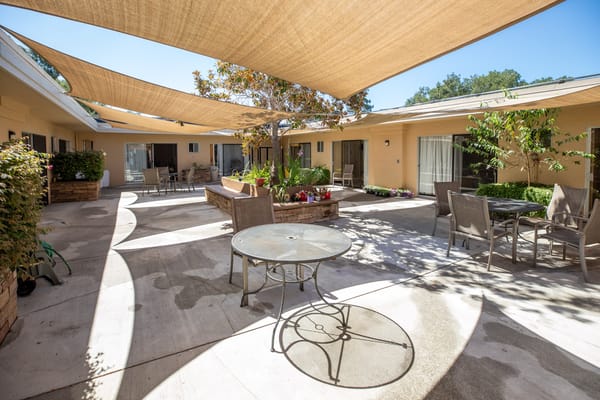
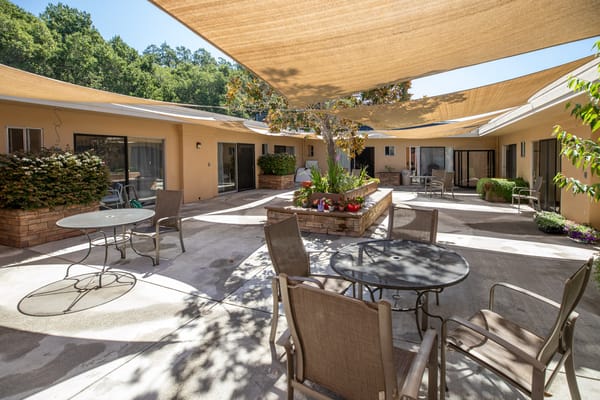
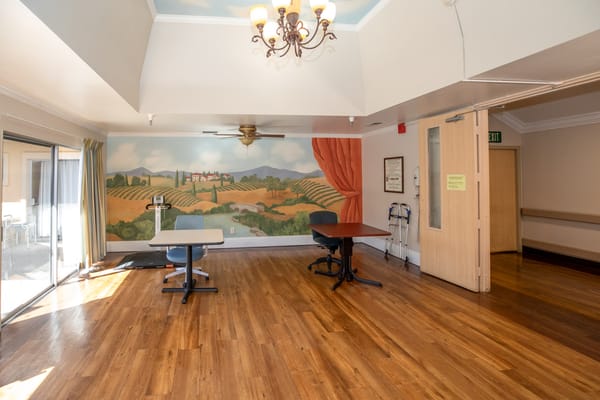
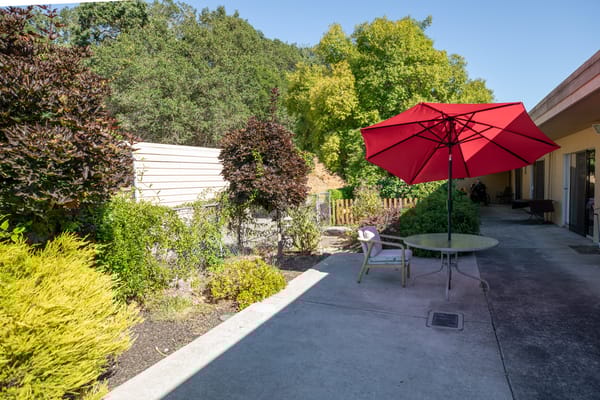
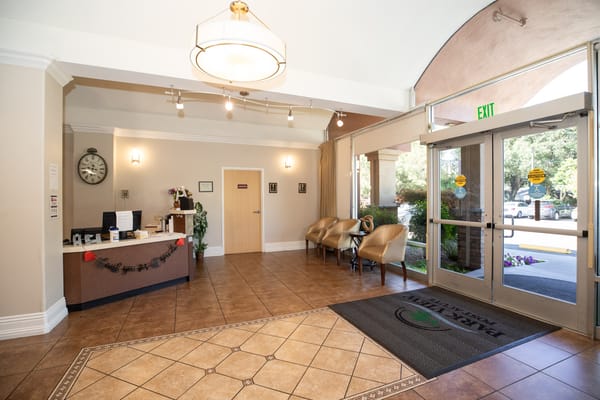
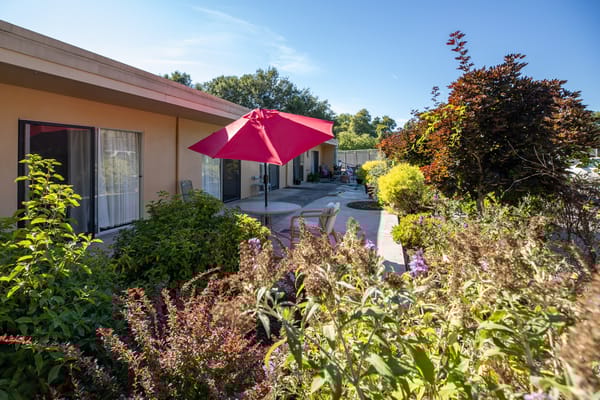
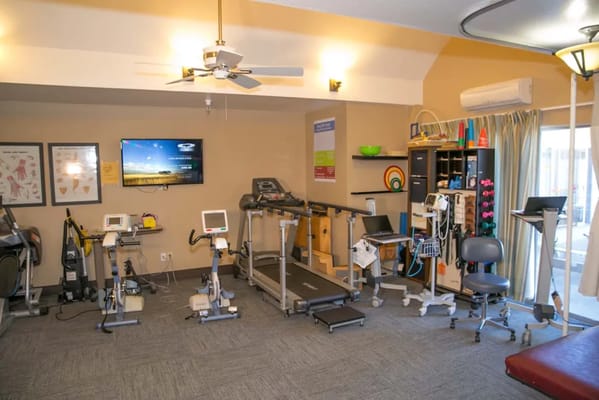
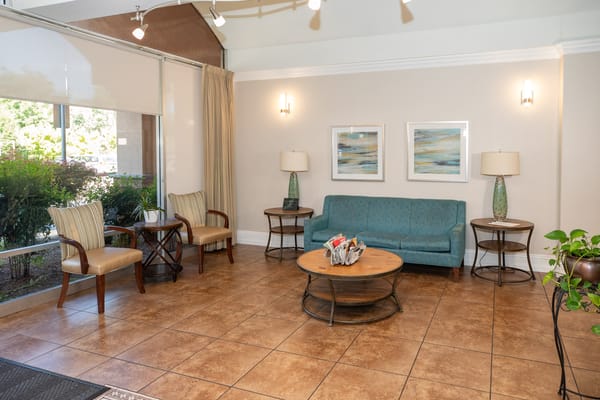
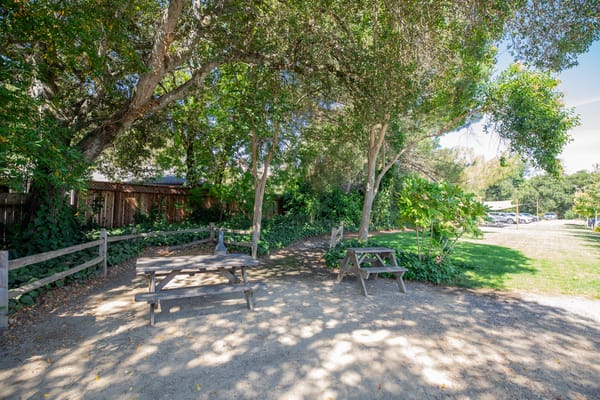
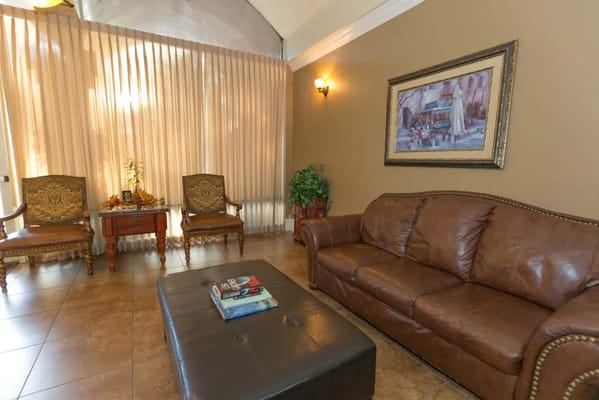
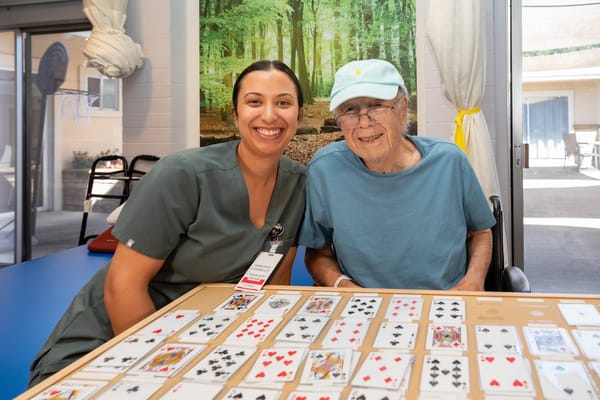
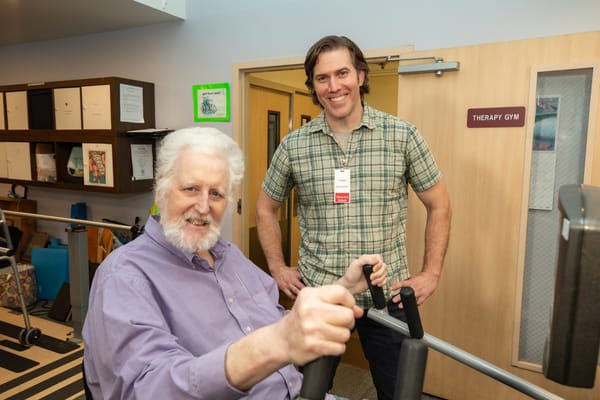
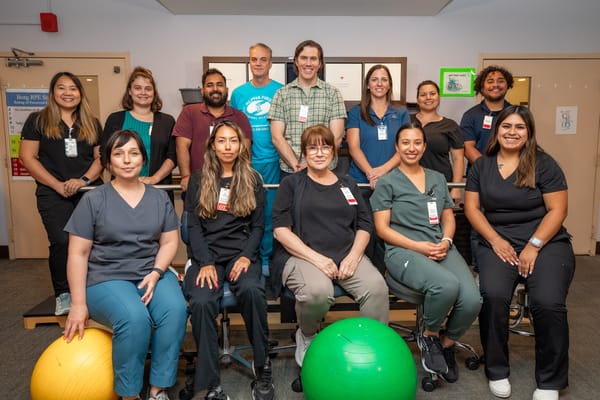
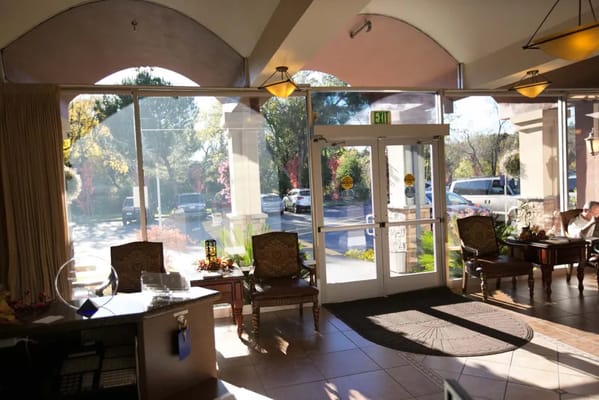
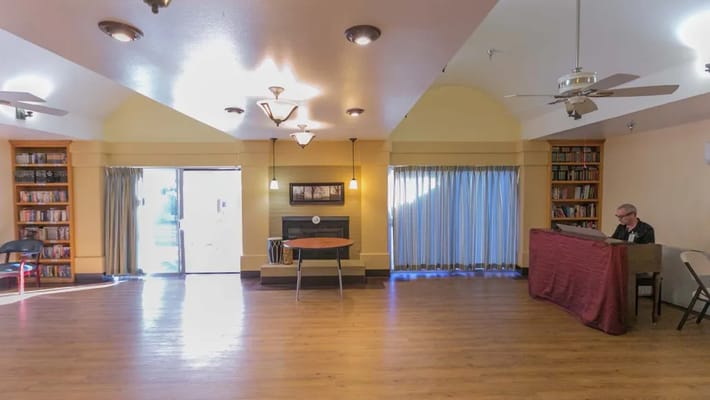
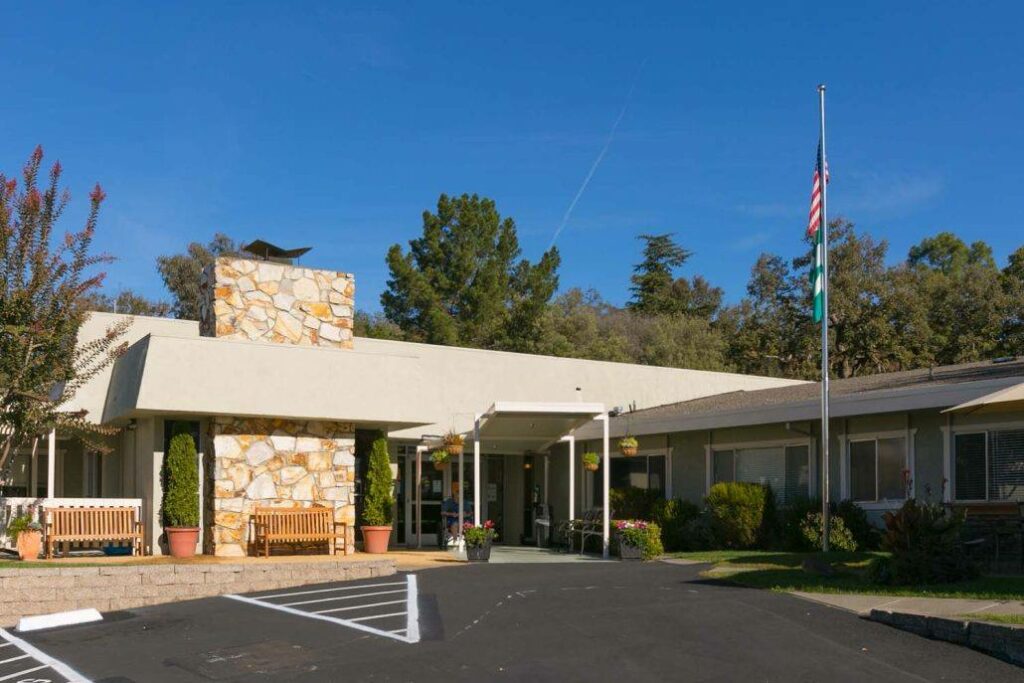
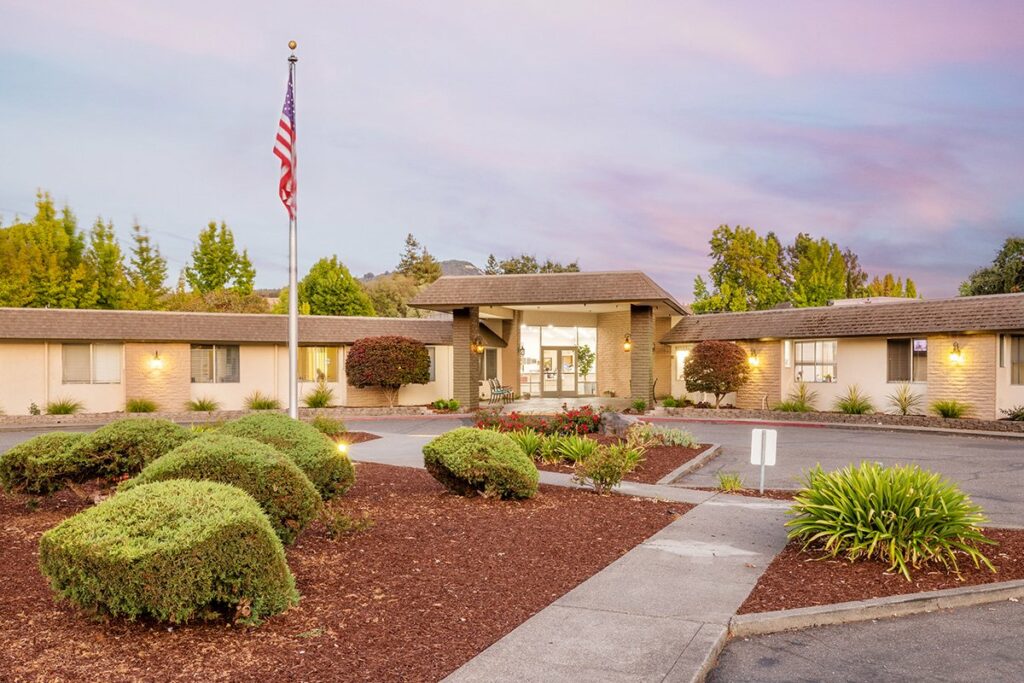
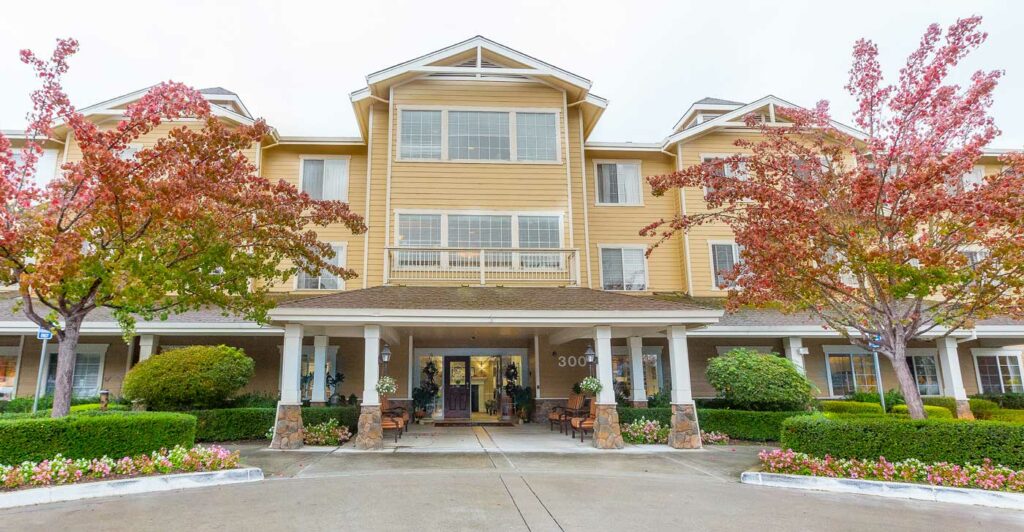
Tucked in Santa Rosa, California, Park View Post Acute is a cutting-edge community that goes beyond being a nursing home – it’s a state-of-the-art haven offering engaging activities and exciting excursions for seniors. Providing a comfortable, safe, and therapeutic environment, this facility boasts a prime location with a light-filled dining room, state-of-the-art therapy rooms, and carefully curated artworks enhancing the surroundings.

Park View Post Acute stands out with its clean, comfortable living spaces in a well-lit and classic home-like setting. Everything within this community is meticulously organized and well-kept, contributing to its well-deserved five-star quality ratings. Committed to the best care in nursing homes, Park View Post Acute aligns seamlessly with nursing home requirements, ensuring a senior living experience that prioritizes comfort, safety, and engagement.

Quality ratings

Measured by Centers for Medicare & Medicaid Services (CMS)

Overall rating Info Official CMS rating based on health inspections, staffing and quality measures.
3/5
California average: 3.1/5
Health Inspection Info Official CMS rating based on deficiencies found during state health inspections.
2/5
California average: 2.8/5
Staffing Info Official CMS rating based on nurse staffing hours per resident per day.
4/5
California average: 3.1/5
Quality Measures Info Official CMS rating based on clinical outcomes for residents.
5/5
California average: 4.1/5

Nursing care per resident

Info Average daily nursing hours per resident (adjusted for acuity). Higher values indicate more nursing time per resident.
4h 4m per day

This home provides 3% less nursing time per resident than the state average.

California average: 4h 13m per day

Staffing hours breakdown

Info Hours of care per resident per day, broken down by staff type. Data from CMS Medicare.
Staff type Facility State avg National avg
Registered Nurse (RN) Info Registered nurse hours per resident per day. 41m per day 39m per day 41m per day
LPN / LVN Info Licensed Practical Nurse / Licensed Vocational Nurse hours per resident per day. 1h 19m per day 1h 13m per day 52m per day
Nurse Aide Info Nurse aide hours per resident per day. 2h 38m per day 2h 39m per day 2h 21m per day
Total Nursing (Weekend) Info Total number of nurse staff hours per resident per day on weekends. 4h 6m per day 4h 5m per day 3h 26m per day
Physical Therapist Info Physical therapist staff hours per resident per day. 10m per day 5m per day 4m per day
RN (Weekend) Info Registered nurse hours per resident per day on weekends. 30m per day 30m per day 29m per day

Capacity and availability

Medium-capacity home

Offers a balance of services and community atmosphere.

Total beds 116

This home usually has limited availability

Occupancy is moderate, suggesting balanced demand.

Similar demand to the California average
Occupancy rate 94.8%
Residents per day (avg) 109
Occupancy rate
94.8%
Residents per day (avg)
109

Who this home usually serves

TYPE OF STAY

Mix of rehab and long-term care

This home supports both short-term rehab and long-term care, with residents staying for a wide range of durations.

Breakdown by payment type

Medicare

46% of new residents, usually for short-term rehab.

Typical stay 25 days

Private pay

51% of new residents, often for short stays.

Typical stay 21 days

Medicaid

2% of new residents, often for long-term daily care.

Typical stay 4 years

Finances and operations

Proprietary home
Corporation
Home revenue
$20.3M
Profit
$2.2M
Proprietary home Corporation
Home revenue
$20,269,123.00
Profit
$2,248,212.00
Payroll costs Info The portion of the home's budget spent on staff, including nurses, caregivers, and other employees who support care and operations.
$11.7M
57.7% of revenue
Other operating costs Info All remaining costs needed to run the home, such as food, utilities, building maintenance, supplies and administrative expenses.
$6.3M
Total costs $18.0M
Walk Score
Walk Score: 32 / 100
Somewhat walkable. A few nearby services may be reachable on foot, but most trips require transportation.
BBB Rating
BBB Rating: C (Not Accredited)
An independent rating from the Better Business Bureau based on factors such as complaint history, transparency, and business practices.
How BBB ratings work

About this community

Care Services

Accepts Medicaid
Accepts Medicare
Doctor on Staff
Nursing Services
Rehabilitation Services
Skilled Nursing
Licensed Nurses/CNAs
24-Hour Staffing

Programs & Activities

Specific Programs
In-House Therapy, Skilled Nursing, Stay Active, Videos & Photos, Contact Us, Careers
Religious Services
Yes

Types of Care at Park View Post Acute

Skilled Nursing
Contact Park View Post Acute

Access & Eligibility

Ways to qualify for care at this community, including accepted programs and payment options.

Medicaid Accepted

This facility is certified for eligible Medicaid services.

Medicare Accepted

This facility is certified for eligible Medicare services.

Payment & Funding Options

Medicaid Medicare

Compare Nursing Homes around Santa Rosa

The information below is reported by the California Department of Social Services and Department of Public Health.
Summerfield Healthcare Center
SNF

Nursing Homes 24/7 care needed

Santa Rosa
56
No
A
49
BUSH, CASON
86.6%
$9,908,310.00
$6,435,178.00
64.9%
50.10
5/5
3.9849
4/5
4/5
5/5
1
21
-
+91%
-6%
+2%
Santa Rosa Post-Acute
HC

Hospice Care

SNF

Nursing Homes 24/7 care needed

RC

Respite Care

Santa Rosa
99
No
-
45
BILLS, KEVAN
95.0%
$32,496,073.00
$7,659,524.00
23.6%
96.40
3/5
4.1536
2/5
4/5
5/5
1
67
3
+74%
-2%
+12%
Park View Post Acute
SNF

Nursing Homes 24/7 care needed

Santa Rosa
116
No
C
32
-
94.8%
$20,258,594.00
$11,705,277.00
57.8%
108.50
3/5
4.0739
2/5
4/5
5/5
-
54
1
+47%
-3%
+12%
Arbol Residences in Santa Rosa
AL

Assisted Living For seniors needing help with daily tasks but not full-time nursing.

MC

Memory Care Specialized care for those with Memory Loss, Alzheimer's, or dementia, ensuring safety and support.

SNF

Nursing Homes 24/7 care needed

Santa Rosa
154
No
A
38
2019 SJB FAMILY TRUST
90.0%
$15,156,168.00
$7,458,340.00
49.2%
25.00
2/5
5.9867
2/5
4/5
3/5
-
37
-
+81%
+42%
+6%

Places of interest near Park View Post Acute

Address 2.4 miles from city center — 0.22 miles to nearest hospital (Petaluma Prepared Childbirth)

Address 3751 Montgomery Dr, Santa Rosa, CA 95405

Calculate Travel Distance to Park View Post Acute

Add your location

Address

Staffing Data

Source: CMS Payroll-Based Journal (Q2 2025)

175
Total Staff
174
Employees
1
Contractors
57,251
Total Hours (Quarter)
84
Avg Staff/Day
7.5
Avg Shift (hrs)
Nursing Staff Breakdown
Role Count Avg Shift (hrs) Uses Contractors?
Registered Nurse228.2 No
Licensed Practical Nurse307.9 Yes
Certified Nursing Assistant767.2 No
Staff by Category
Administration
1 staff
8hs shift avg
Nursing Staff
131 staff
7.5hs shift avg
Physicians & Practitioners
2 staff
7.2hs shift avg
Therapy Services
26 staff
7hs shift avg
Activities & Recreation
0 staff
0hs shift avg
Social Services
2 staff
7.1hs shift avg
Dietary Services
4 staff
7.2hs shift avg
Other Services
9 staff
8.1hs shift avg
Contractor Analysis
0.6%
of total hours from contractors
321 contractor hours this quarter
Licensed Practical Nurse: 1
Role Employees Contractors Total Staff Total Hours Days Worked % of Days Avg Shift (hrs)
Certified Nursing Assistant7607624,77491100%7.2
Licensed Practical Nurse2913011,07291100%7.9
Registered Nurse220225,79591100%8.2
Dental Services Staff9093,3346875%8.1
Speech Language Pathologist6062,1048897%7.4
Physical Therapy Assistant7071,7318998%6.6
Respiratory Therapy Technician7071,6488290%6.6
Other Dietary Services Staff4041,53691100%7.2
Physical Therapy Aide3031,3347886%7.7
RN Director of Nursing3031,3298695%7.5
Qualified Social Worker2026426369%7.1
Nurse Practitioner1015856571%9
Occupational Therapy Aide3035367279%7
Administrator1015206571%8
Clinical Nurse Specialist1013115965%5.3

Health Inspection History

Inspections
Total health inspections 11

California average 12.5


Last Health inspection on Sep 2025

Total health citations 54
Citations per inspection
4.91

Health citations are formal notices following inspections when they fail to comply with safety and care standards.

37 of 54 citations resulted from standard inspections; 13 of 54 resulted from complaint investigations; and 4 of 54 came from combined inspections (standard and complaint).

Breakdown of citation severity (last 3 years)
Critical Health citations More info 0
100% better than California average

California average: 0.4


Serious Health citations More info 1
In line with California average

California average: 1

0 critical citations More info California average: 0.4

1 serious citation More info California average: 1

53 moderate citations More info California average: 47.2

0 minor citations More info California average: 1.5
Citations history (last 3 years)
Pharmacy moderate citation Sep 03, 2025
Corrected

Care Planning moderate citation Jul 17, 2025
Corrected

Care Planning moderate citation Jun 02, 2025
Corrected

Care Planning moderate citation Jun 02, 2025
Corrected

Facility Characteristics

Source: CMS Long-Term Care Facility Characteristics (Data as of Jan 2026)

Ownership: For-Profit LLC
Part of: Ensign Services
Resident Census by Payment Source
106 Total Residents
Medicare 27 (25.5%)
Medicaid 52 (49.1%)
Private Pay/Other 27 (25.5%)
Programs & Services
Residents' Group
Family Engagement

Active councils help families stay involved in care decisions and facility operations.

Quality of care over time

These measures show how residents usually do over time at this home, based on health outcomes and preventive care.

High-risk clinical events score Info A composite score based on pressure ulcers, falls with injury, weight loss, walking ability decline, and activities of daily living decline. 4.9
26% better than California average

California average: 6.6

Functional decline score Info A composite score based on activities of daily living decline, walking ability decline, and incontinence. 11.5
In line with California average

California average: 11.3

Long-stay resident measures
Need for Help with Daily Activities Increased Info Percent of long-stay residents whose need for help with daily activities has increased 6.2%
44% better than California average

California average: 11.1%

Walking Ability Worsened Info Percent of long-stay residents whose ability to move independently worsened 10.2%
15% better than California average

California average: 12.0%

Low Risk Residents with Bowel/Bladder Incontinence Info Percent of low risk long-stay residents who lose control of their bowels or bladder 18.1%
61% worse than California average

California average: 11.3%

Falls with Major Injury Info Percent of long-stay residents experiencing one or more falls with major injury 4.2%
150% worse than California average

California average: 1.7%

High Risk Residents with Pressure Ulcers Info Percent of long-stay high risk residents with pressure ulcers 2.8%
43% better than California average

California average: 5.0%

Urinary Tract Infection Info Percent of long-stay residents with a urinary tract infection 1.0%
23% better than California average

California average: 1.2%

Lost Too Much Weight Info Percent of long-stay residents who lose too much weight 1.1%
74% better than California average

California average: 4.2%

Depressive Symptoms Info Percent of long-stay residents who have depressive symptoms 9.0%
34% worse than California average

California average: 6.7%

Antipsychotic Use Info Percent of long-stay residents who received an antipsychotic medication 7.8%
23% better than California average

California average: 10.1%

Pneumococcal Vaccine Info Percent of long-stay residents assessed and appropriately given the pneumococcal vaccine 100.0%
In line with California average

California average: 98.5%

Influenza Vaccine Info Percent of long-stay residents assessed and appropriately given the seasonal influenza vaccine 98.3%
In line with California average

California average: 98.2%

Hospitalizations per 1,000 days Info Number of hospitalizations per 1,000 long-stay resident days. 2.12
6% better than California average

California average: 2.25

ED visits per 1,000 days Info Number of outpatient emergency department visits per 1,000 long-stay resident days. 0.93
42% better than California average

California average: 1.59

Short-stay resident measures
Pneumococcal Vaccine Info Percent of short-stay residents assessed and appropriately given the pneumococcal vaccine 99.6%
6% better than California average

California average: 94.0%

Antipsychotic medication increase Info Percent of short-stay residents who newly received an antipsychotic medication 1.0%
31% better than California average

California average: 1.5%

Influenza Vaccine Info Percent of short-stay residents assessed and appropriately given the seasonal influenza vaccine 99.0%
6% better than California average

California average: 93.2%

Re-hospitalized after SNF stay Info Percentage of short-stay residents who were re-hospitalized after their nursing home admission. 26.1%
13% worse than California average

California average: 23.2%

Emergency department visits Info Percentage of short-stay residents who had an outpatient emergency department visit. 10.6%
5% better than California average

California average: 11.2%

Falls with major injury Info Percentage of SNF residents who experience falls with major injury during their stay. 0.7%
In line with California average

California average: 0.8%

Ability to care for self at discharge Info Percentage of residents at or above expected ability to care for themselves at discharge. 52.1%
In line with California average

California average: 53.7%

Successful return to home or community Info Rate of successful return to home or community from a skilled nursing facility. 56.3%
11% better than California average

California average: 50.6%

Guides for Better Senior Living

Care Cost Calculator: See Prices in Your Area

Nursing Home Data Explorer

Don’t Wait Too Long: 7 Red Flag Signs Your Parent Needs Assisted Living Now

The True Cost of Assisted Living in 2025 – And How Families Are Paying For It

Understanding Senior Living Costs: Pricing Models, Discounts & Financial Assistance

Financial Aid for California Seniors

Get financial aid guidance

Multipurpose Senior Services Program

MSSP (Medi-Cal Waiver)

Age 65+, California resident, Medi-Cal eligible, nursing home risk.

~$2,829/month (300% FBR, individual).

$2,000 (individual), $3,000 (couple).

County-managed; waitlists possible.

In-Home Supportive Services (IHSS)

California IHSS

Age 65+, California resident, Medicaid-eligible or low-income.

~$1,732/month (individual, Medi-Cal threshold).

$2,000 (individual).

Can hire family as caregivers.

Multipurpose Senior Services Program (MSSP)

CA MSSP

Age 65+, California resident, Medi-Cal-eligible, nursing home-eligible but community-capable.

~$2,829/month (300% FBR, individual).

$2,000 (individual).

Available in 38 counties; waitlists common.

Property Tax Postponement Program (PTP)

CA PTP

Age 62+, California resident, own and live in home, 40% equity.

~$51,500/year (household, adjusted annually).

Equity-based; no strict asset cap.

Deferred taxes accrue interest (5% as of 2024); repaid upon sale/death.

Assisted Living Waiver (ALW)

CA ALW

Age 65+ or disabled, California resident, Medi-Cal-eligible, nursing home-eligible.

~$2,829/month (300% FBR, individual).

$2,000 (individual).

Available in 15 counties (e.g., LA, Sacramento); waitlists common.

California CARES Program

CA CARES

Caregivers of California residents 60+ needing help with 3+ daily activities; no caregiver age limit.

No strict limit; cost-sharing above ~$2,500/month threshold.

Not applicable; need-based.

High demand in urban areas; complements IHSS respite.

Low-Income Home Energy Assistance Program (LIHEAP)

CA LIHEAP

Age 60+ priority, California resident, low-income, utility/heating need.

~$2,510/month (200% of poverty level, individual).

Not applicable; income-focused.

High demand in inland/coastal extremes; weatherization capped at $5,000/home.

Who we are

Your Senior Care Partner, Every Step of the Way

We help families find affordable senior communities and unlock same day discounts, Medicaid, and Medicare options tailored to your needs.

Contact us Today
Tour Icon
Planning a tour? Check our touring checklist.
Chat Icon
Thinking of living here? We can help you speak to a current resident