Park View Post Acute
CMS overall rating Info CMS (the Centers for Medicare & Medicaid Services) is the federal agency that rates nursing home quality. Its Overall Rating runs from 1 to 5 stars, combining health inspections, staffing, and quality measures, with inspections weighted most heavily.

Park View Post Acute

CMS overall rating Info CMS (the Centers for Medicare & Medicaid Services) is the federal agency that rates nursing home quality. Its Overall Rating runs from 1 to 5 stars, combining health inspections, staffing, and quality measures, with inspections weighted most heavily.
Calculator: See prices in your area
Park View Post Acute accepts Medicaid, Medicare, and private pay.

Overview of Park View Post Acute

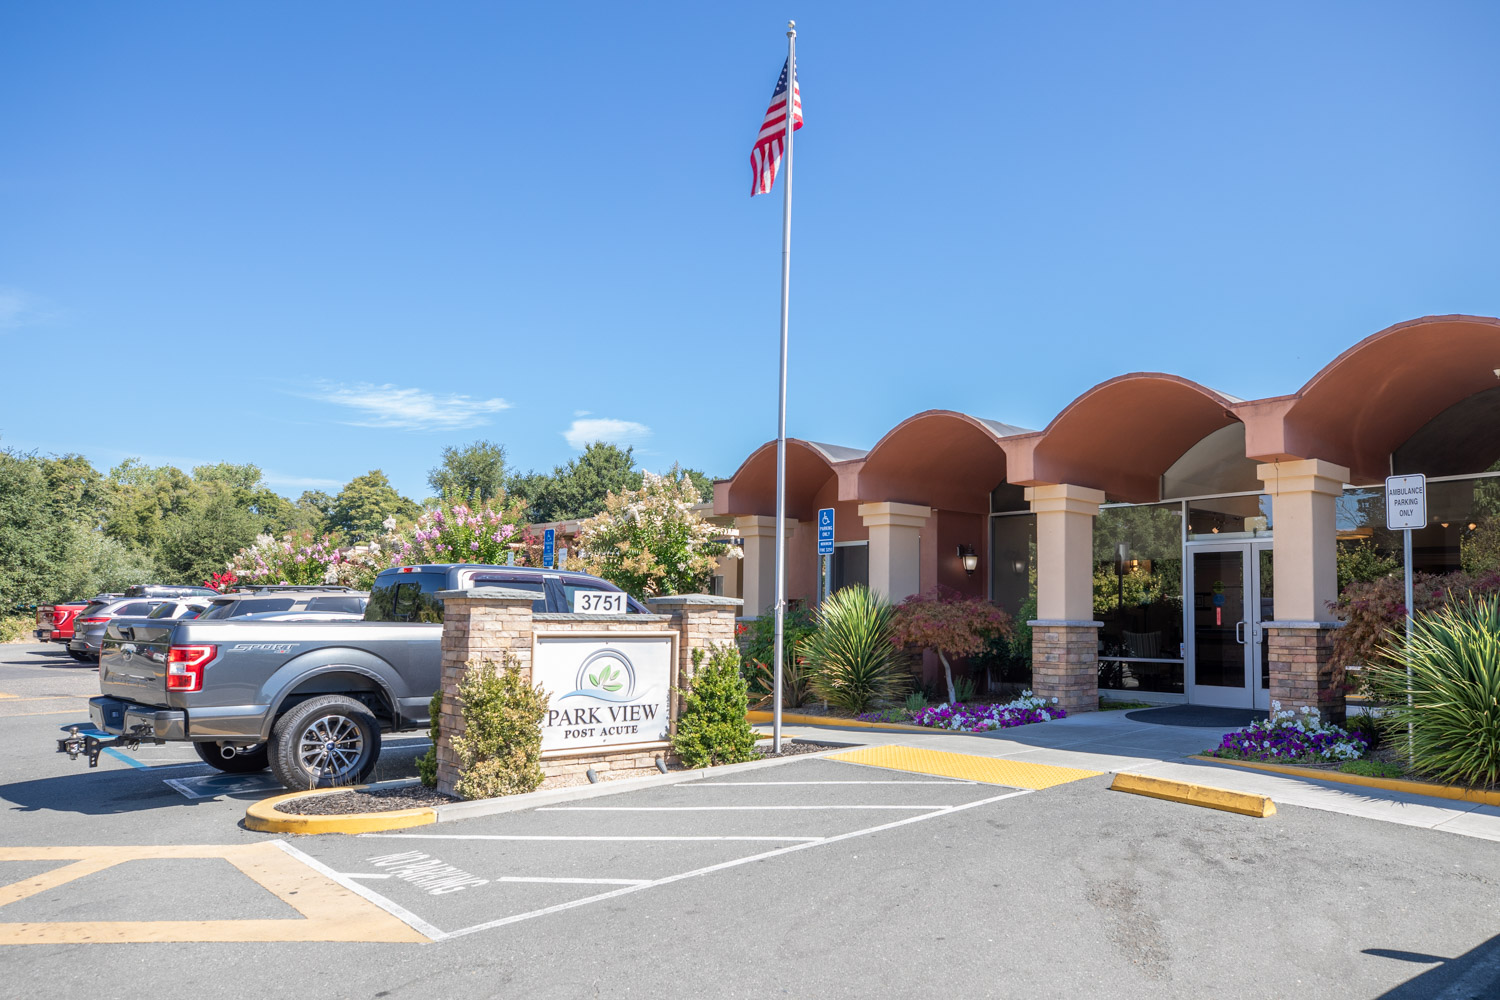
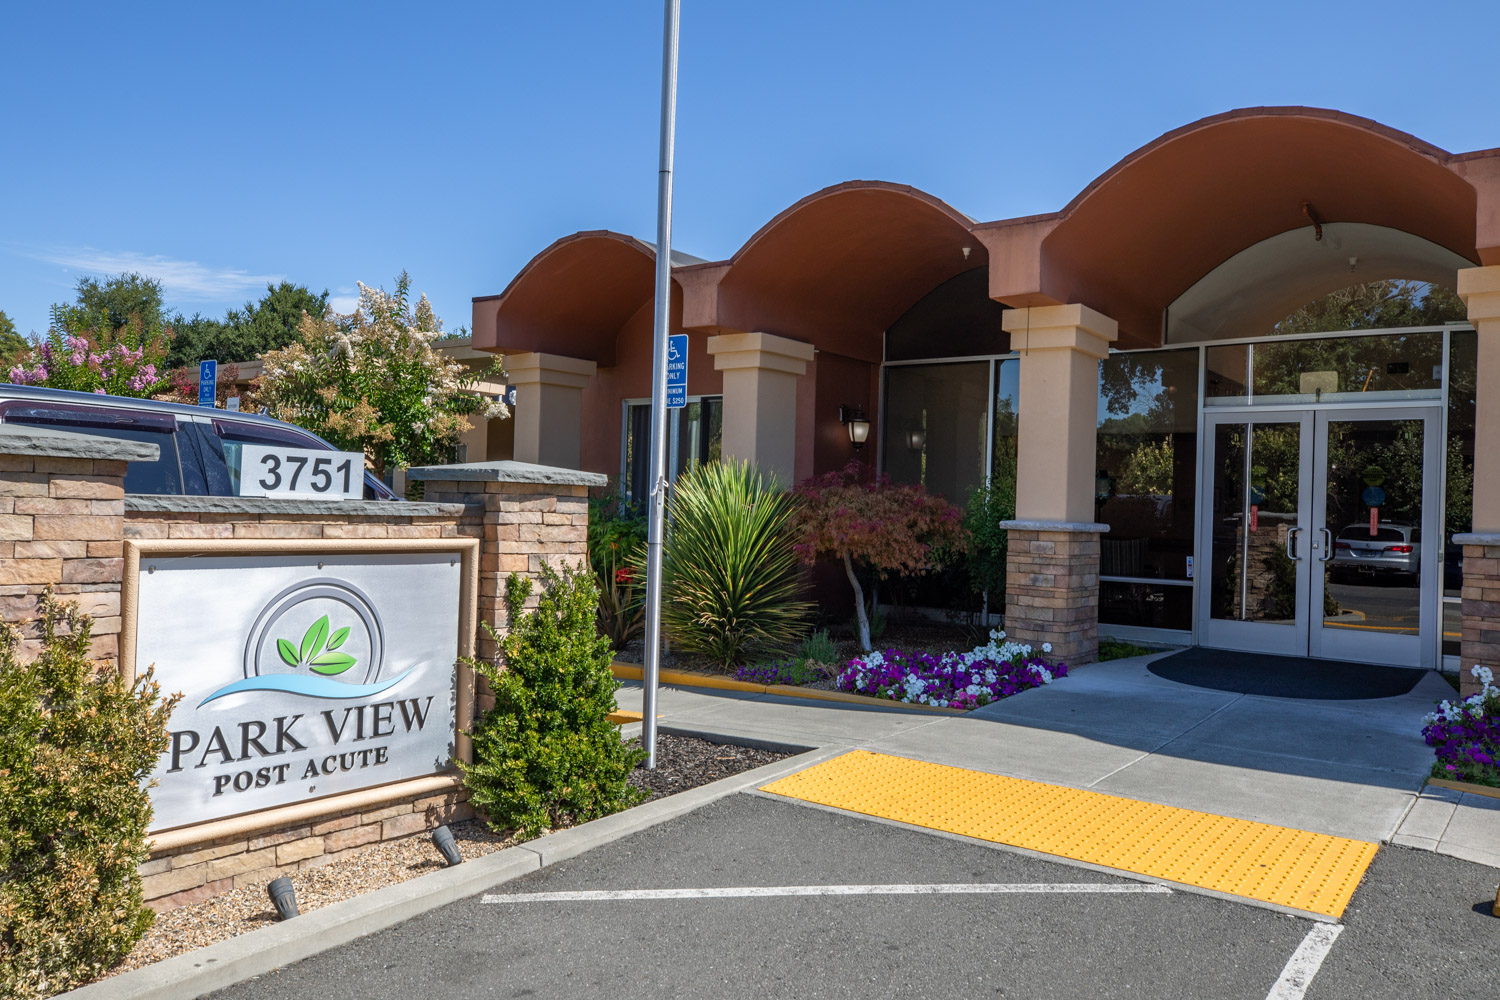
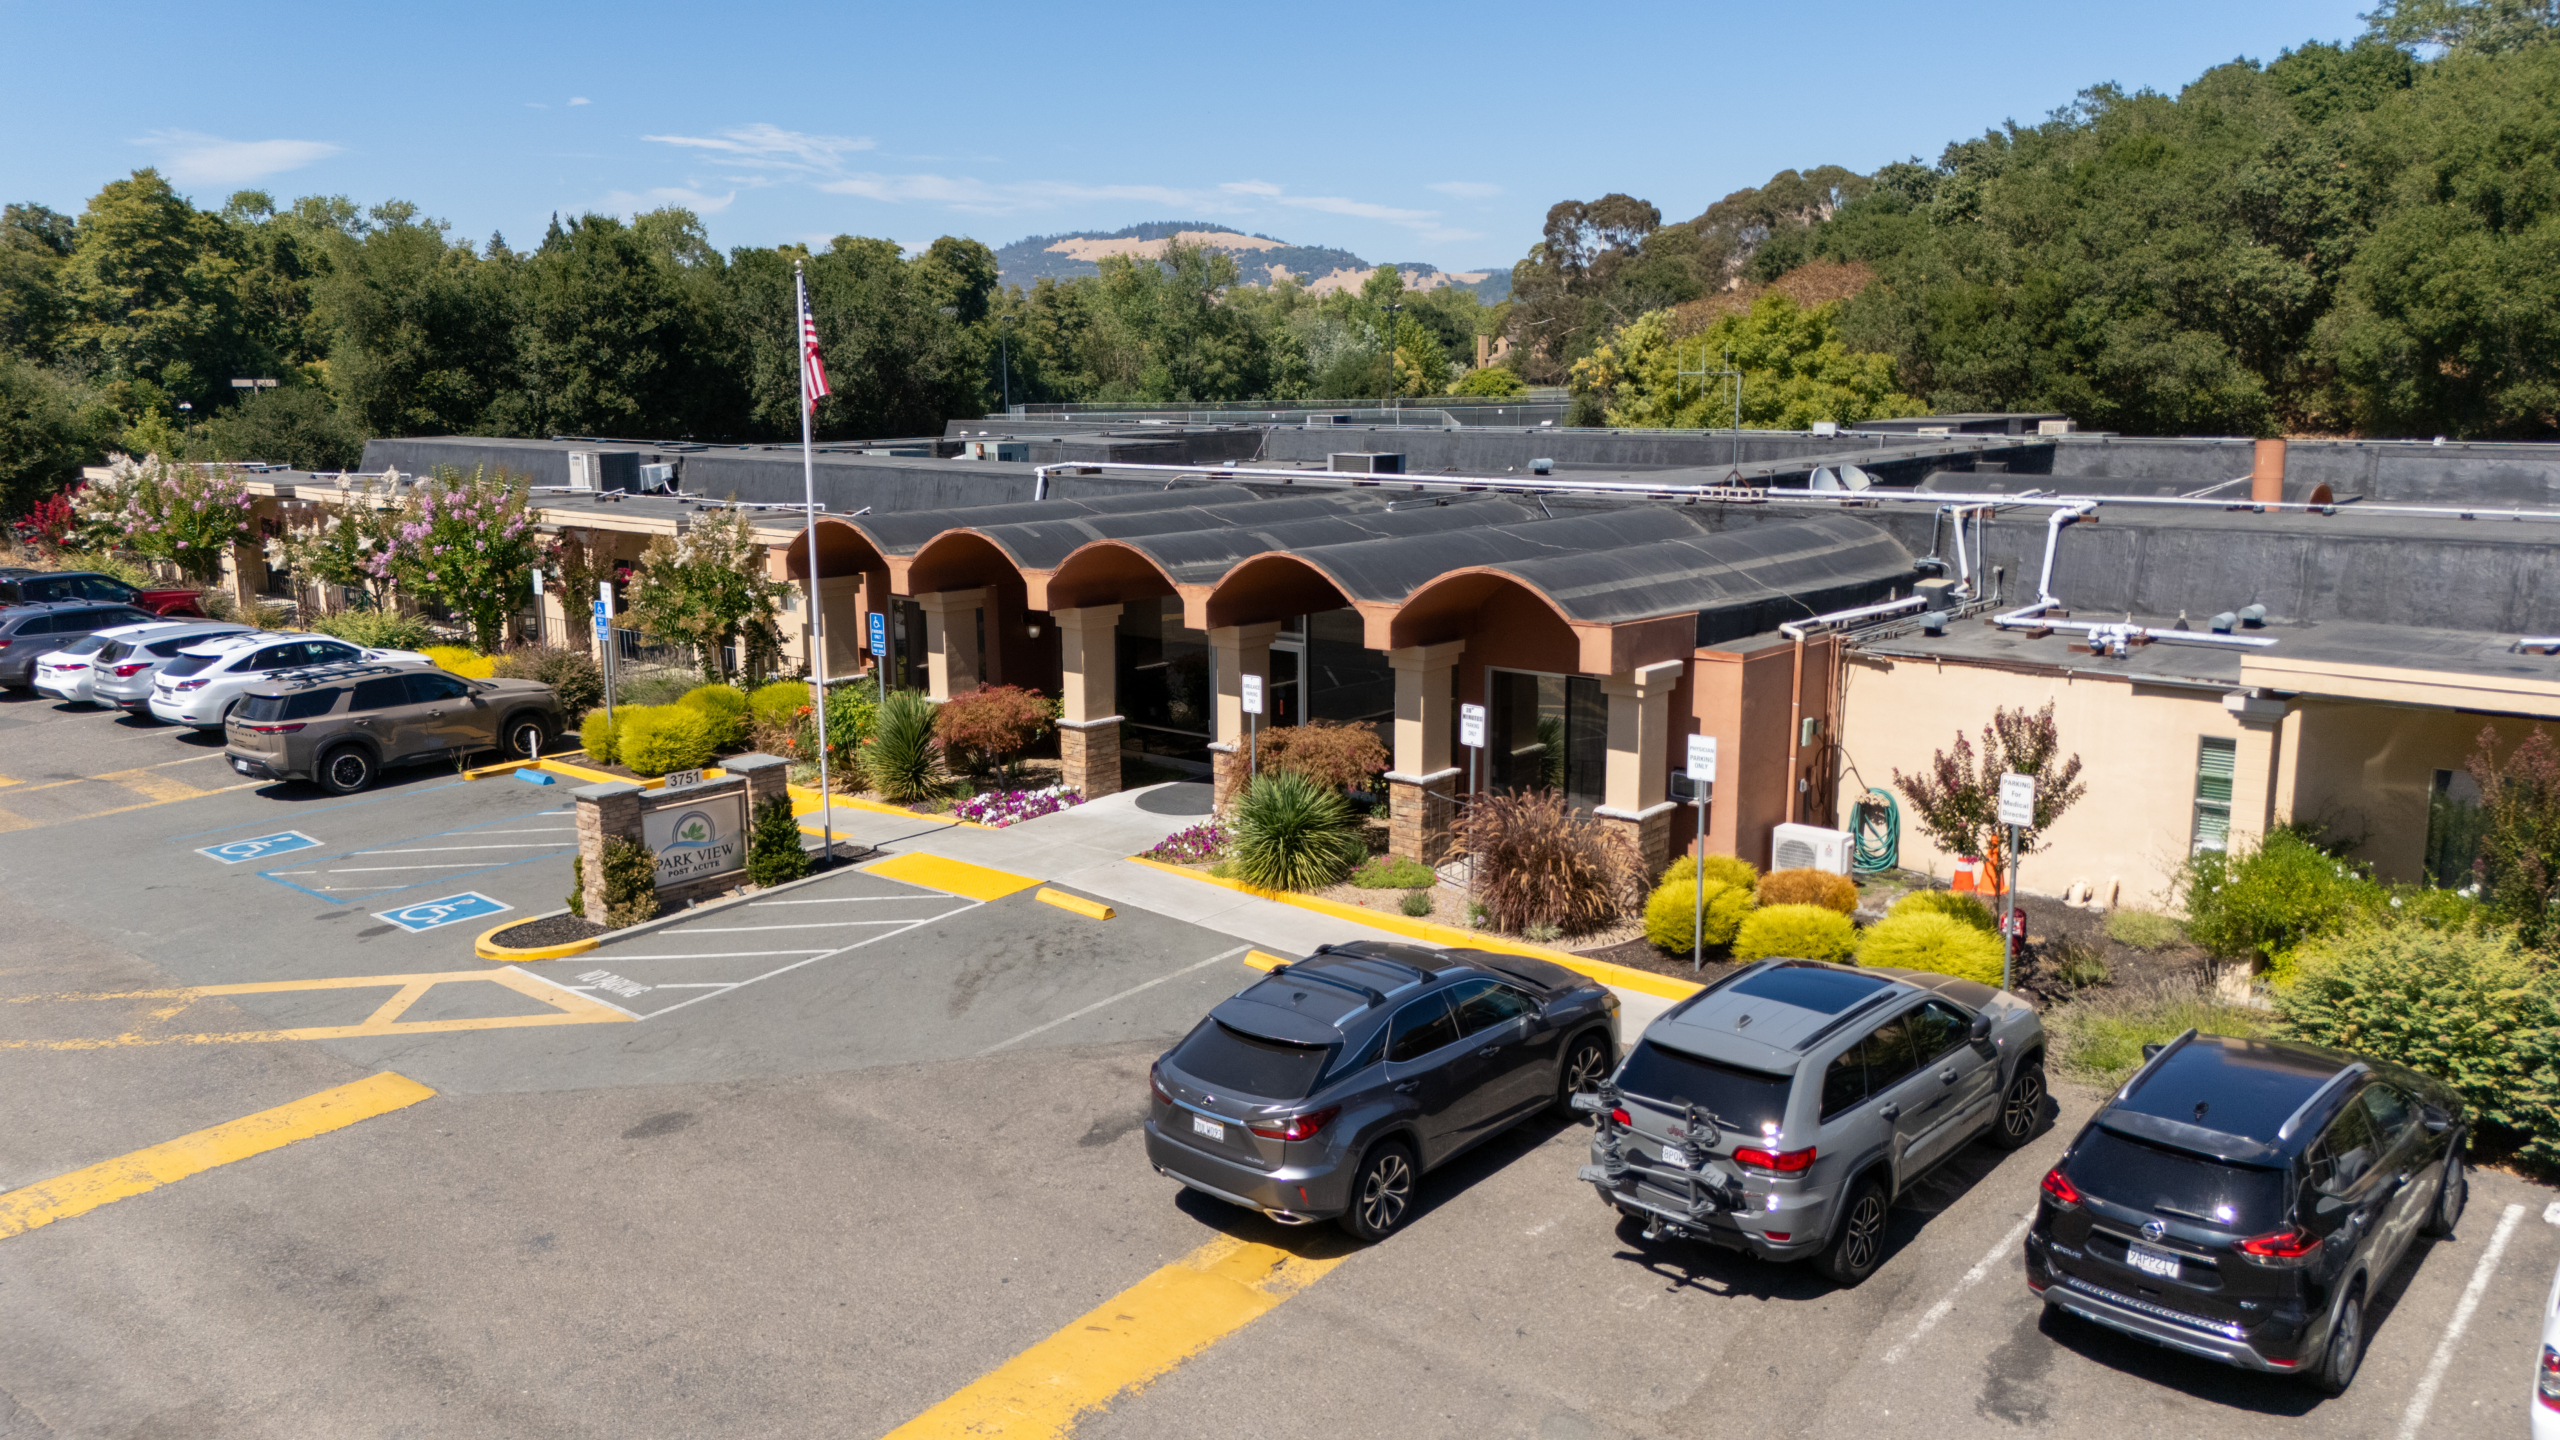
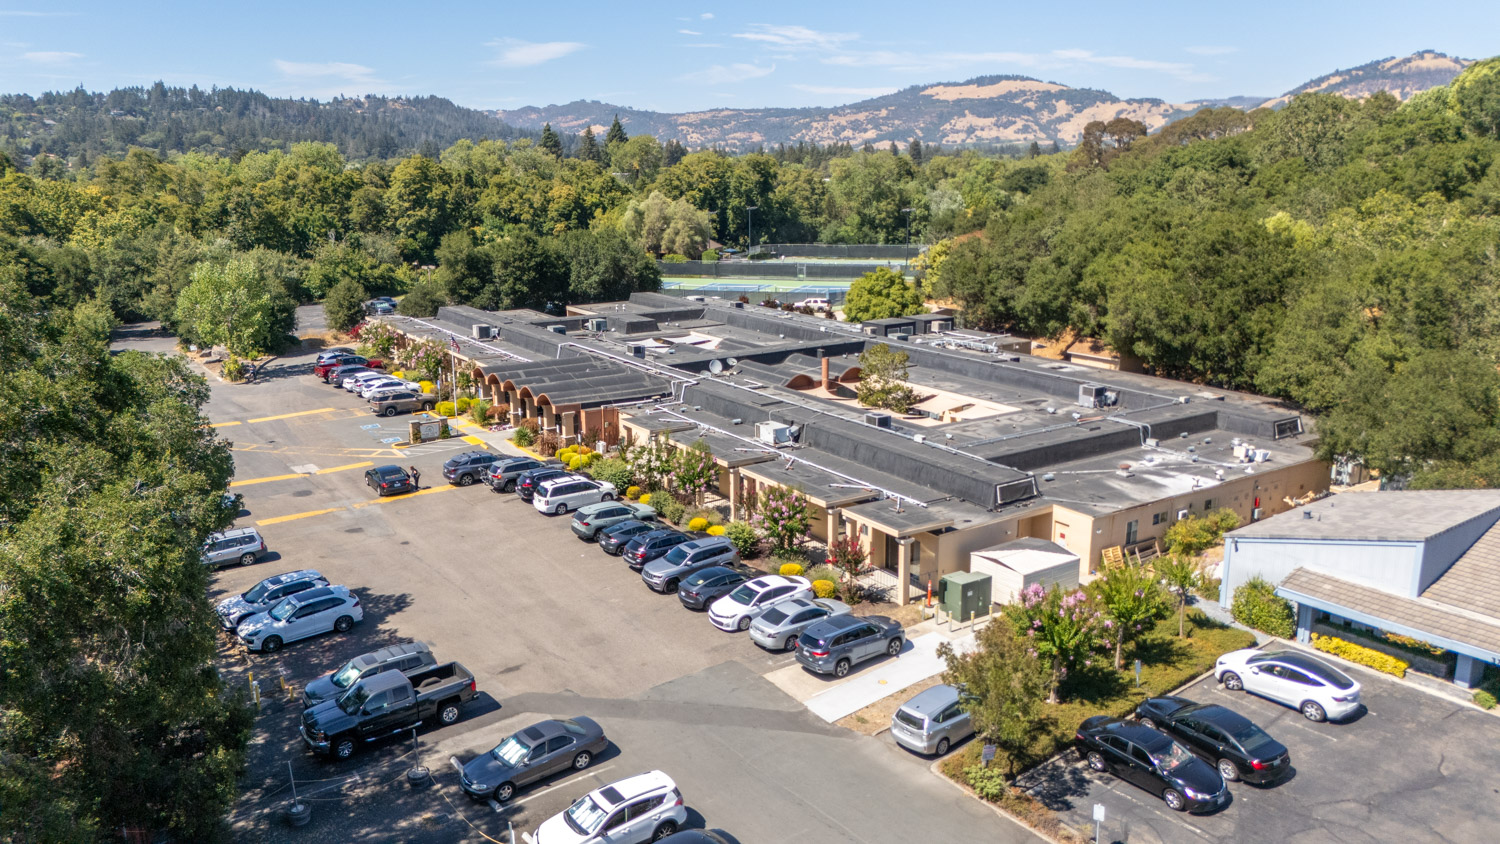
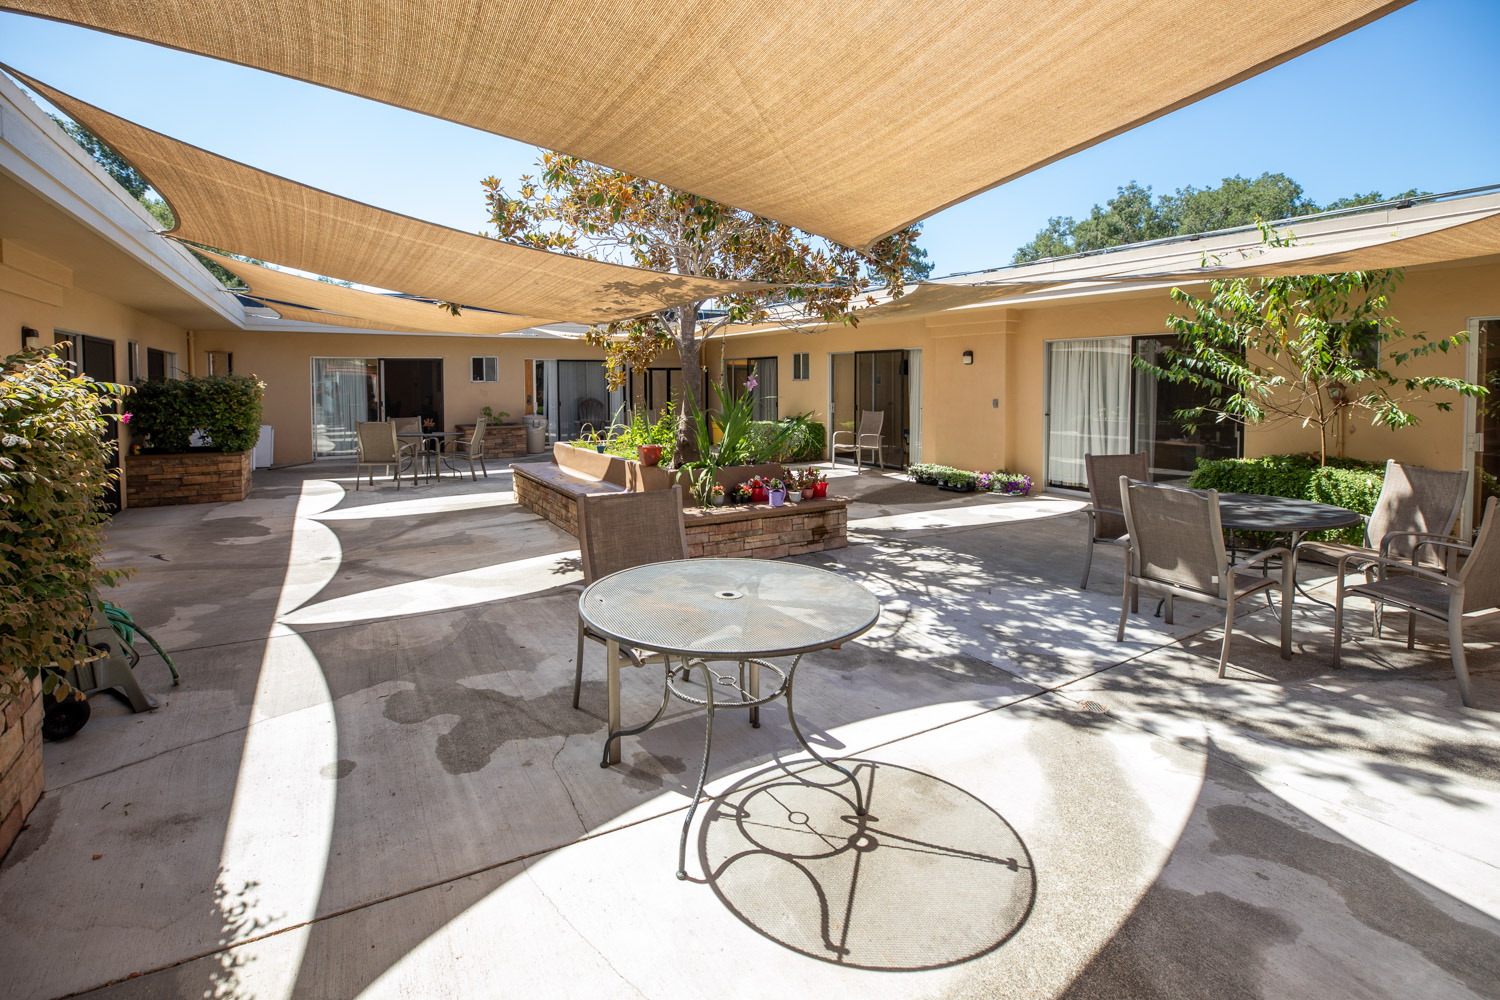
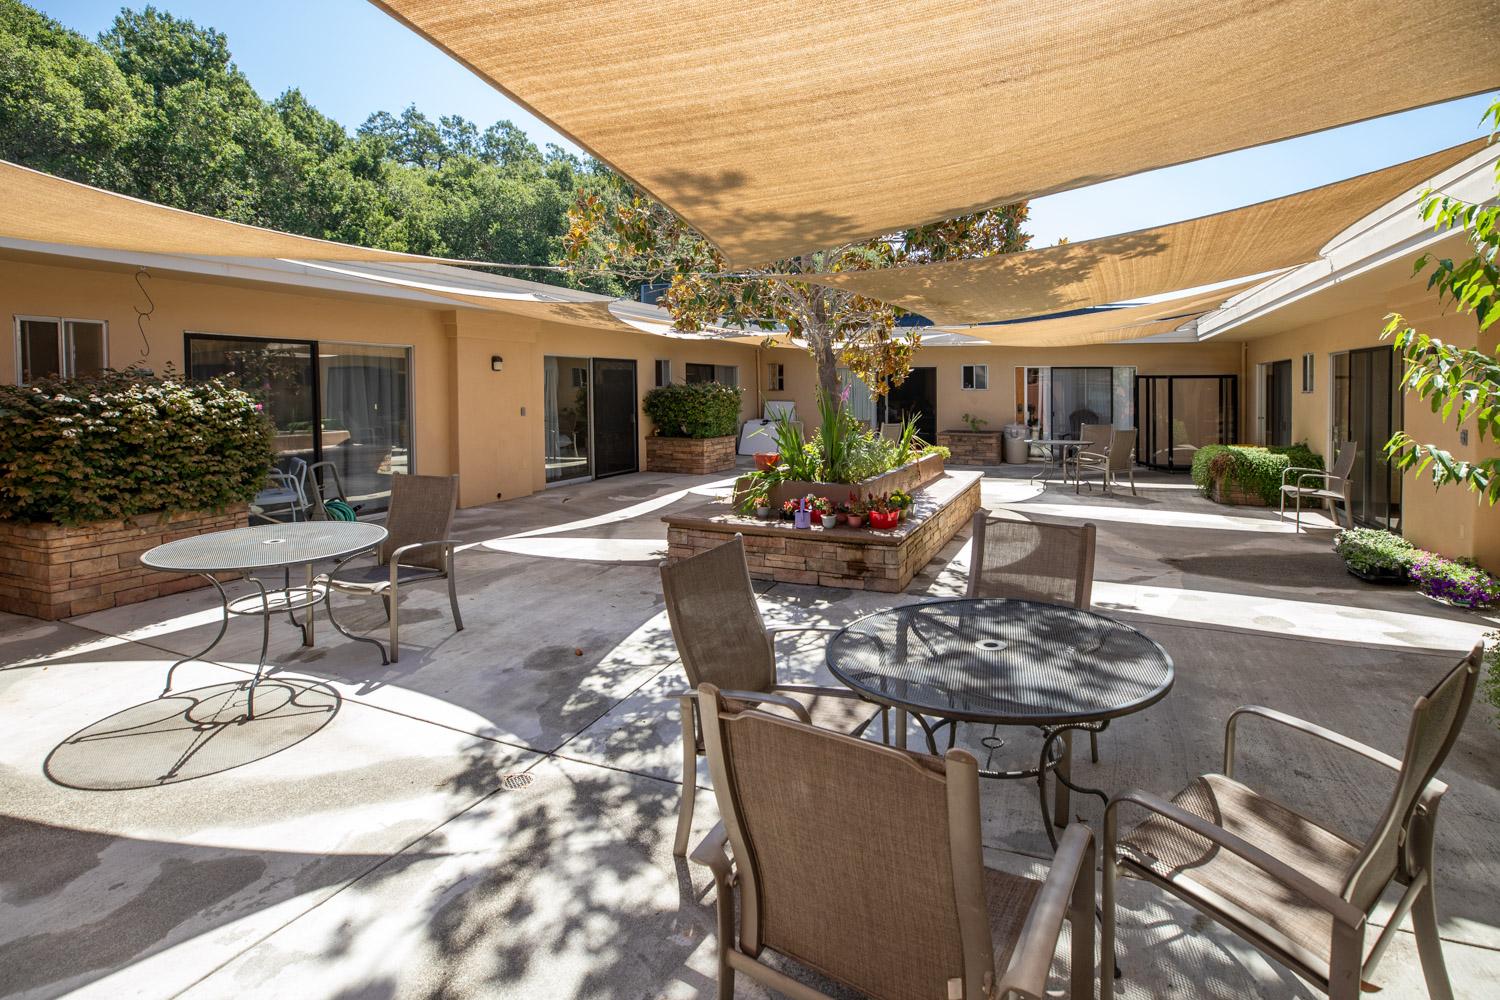
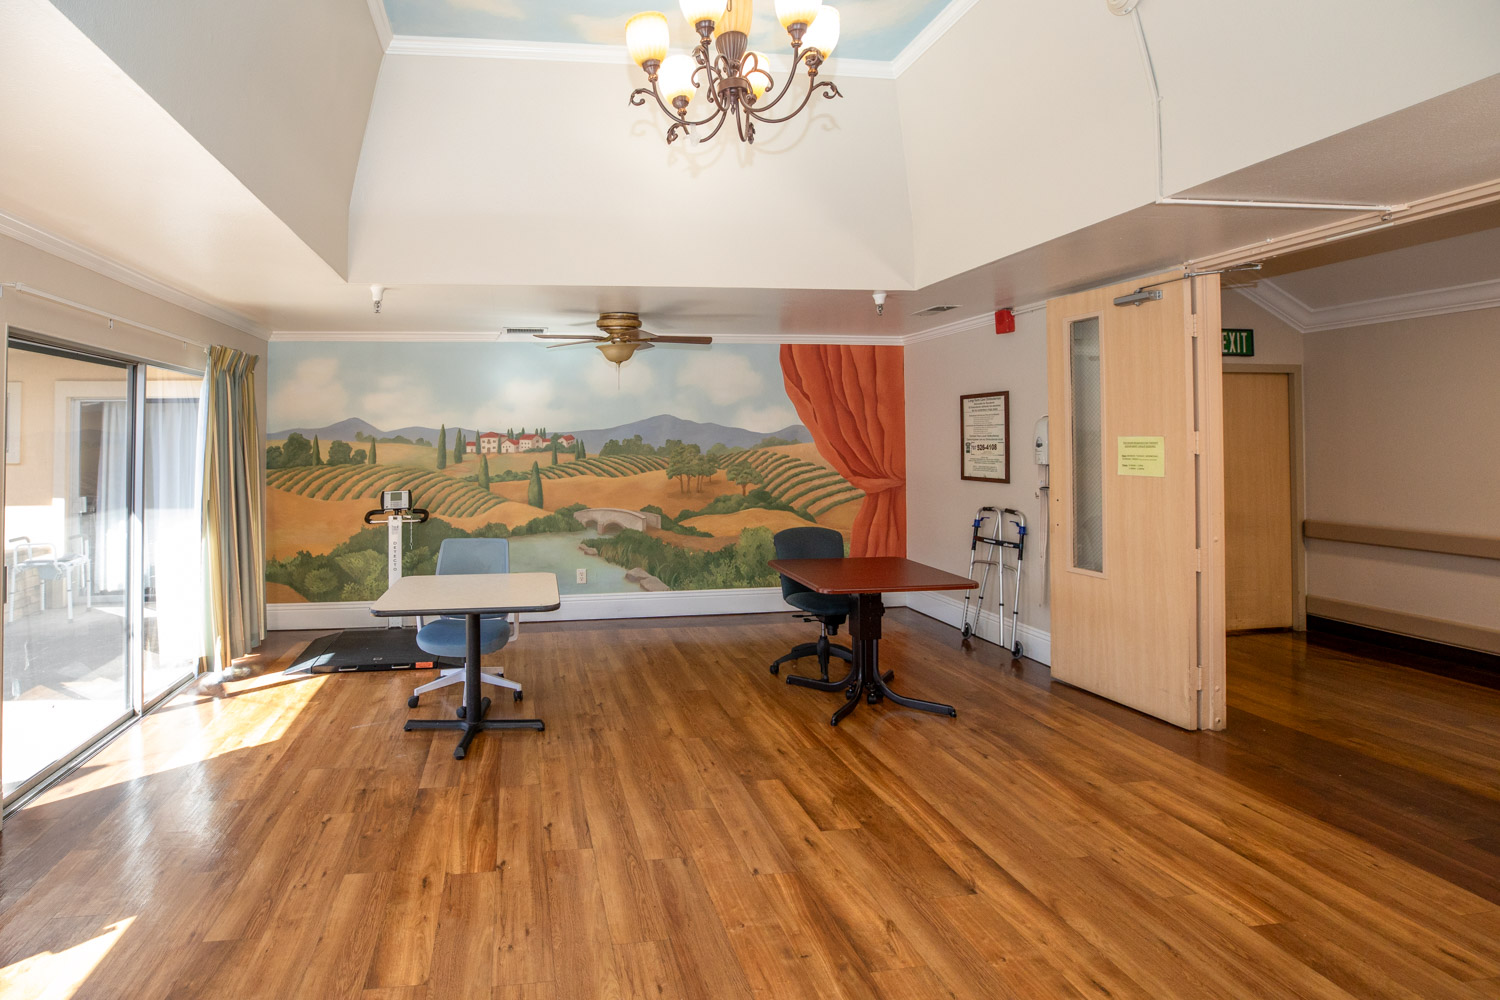
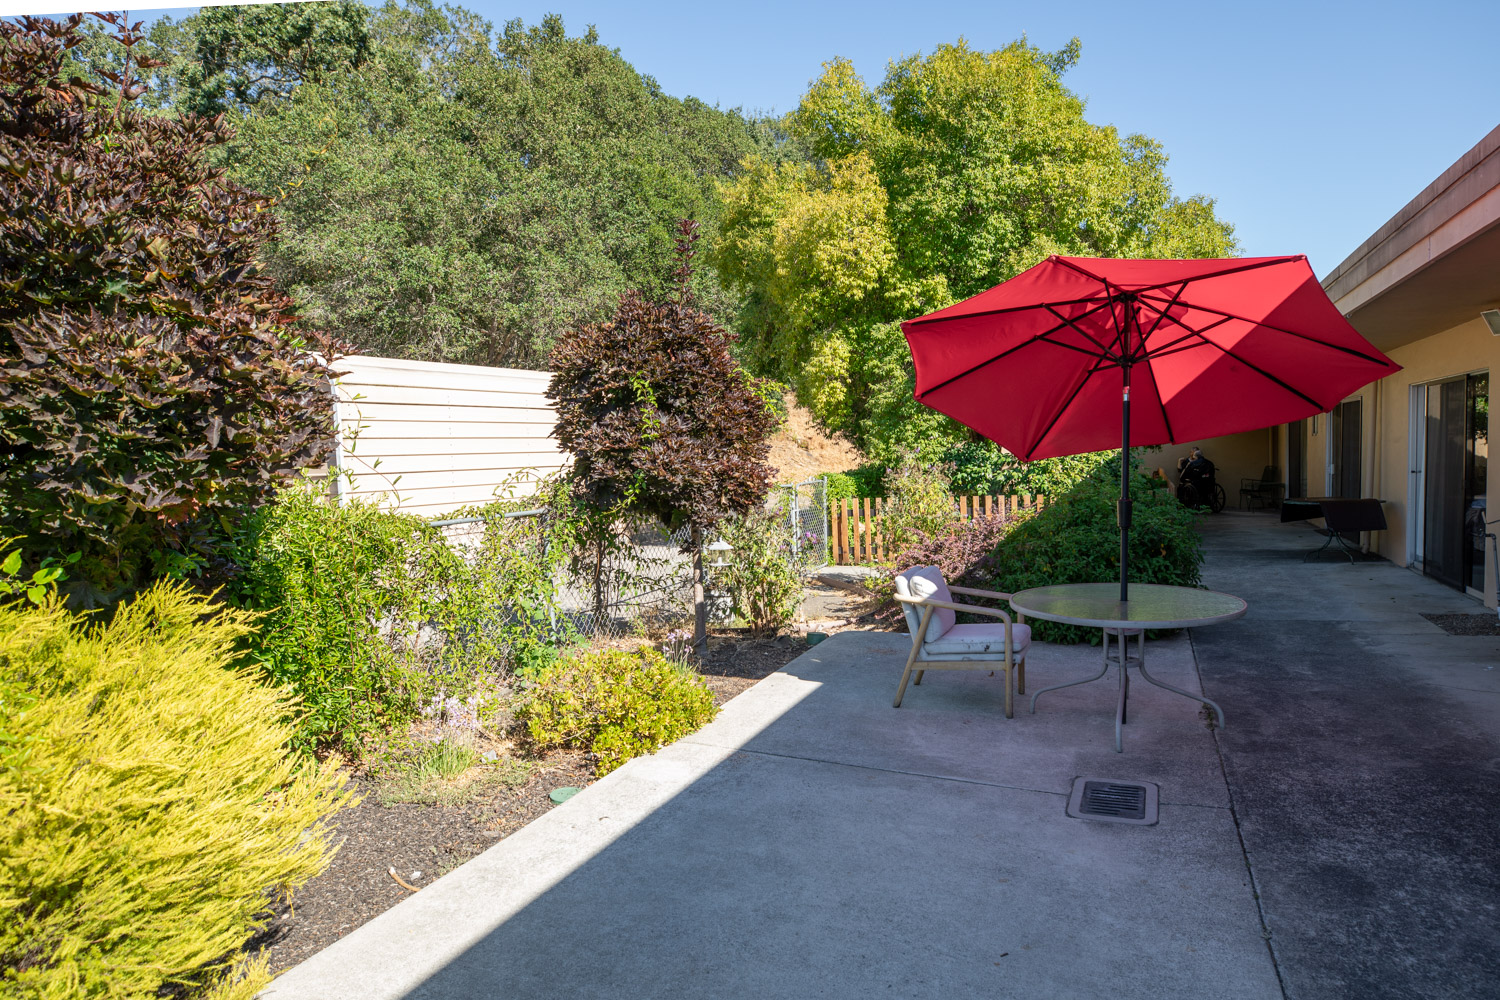
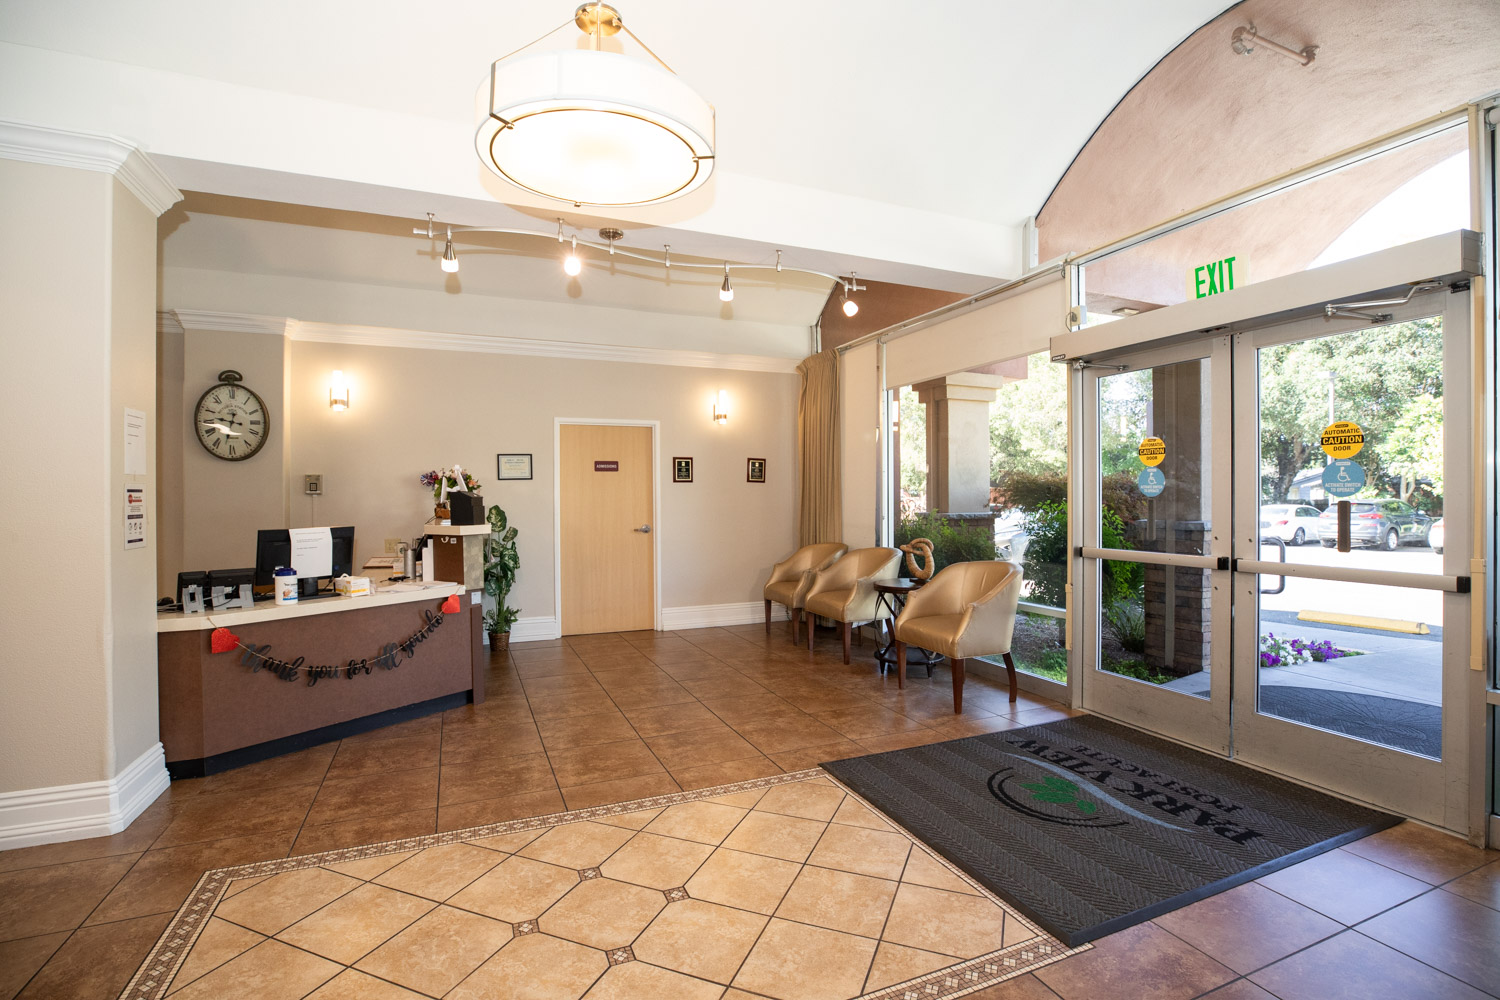
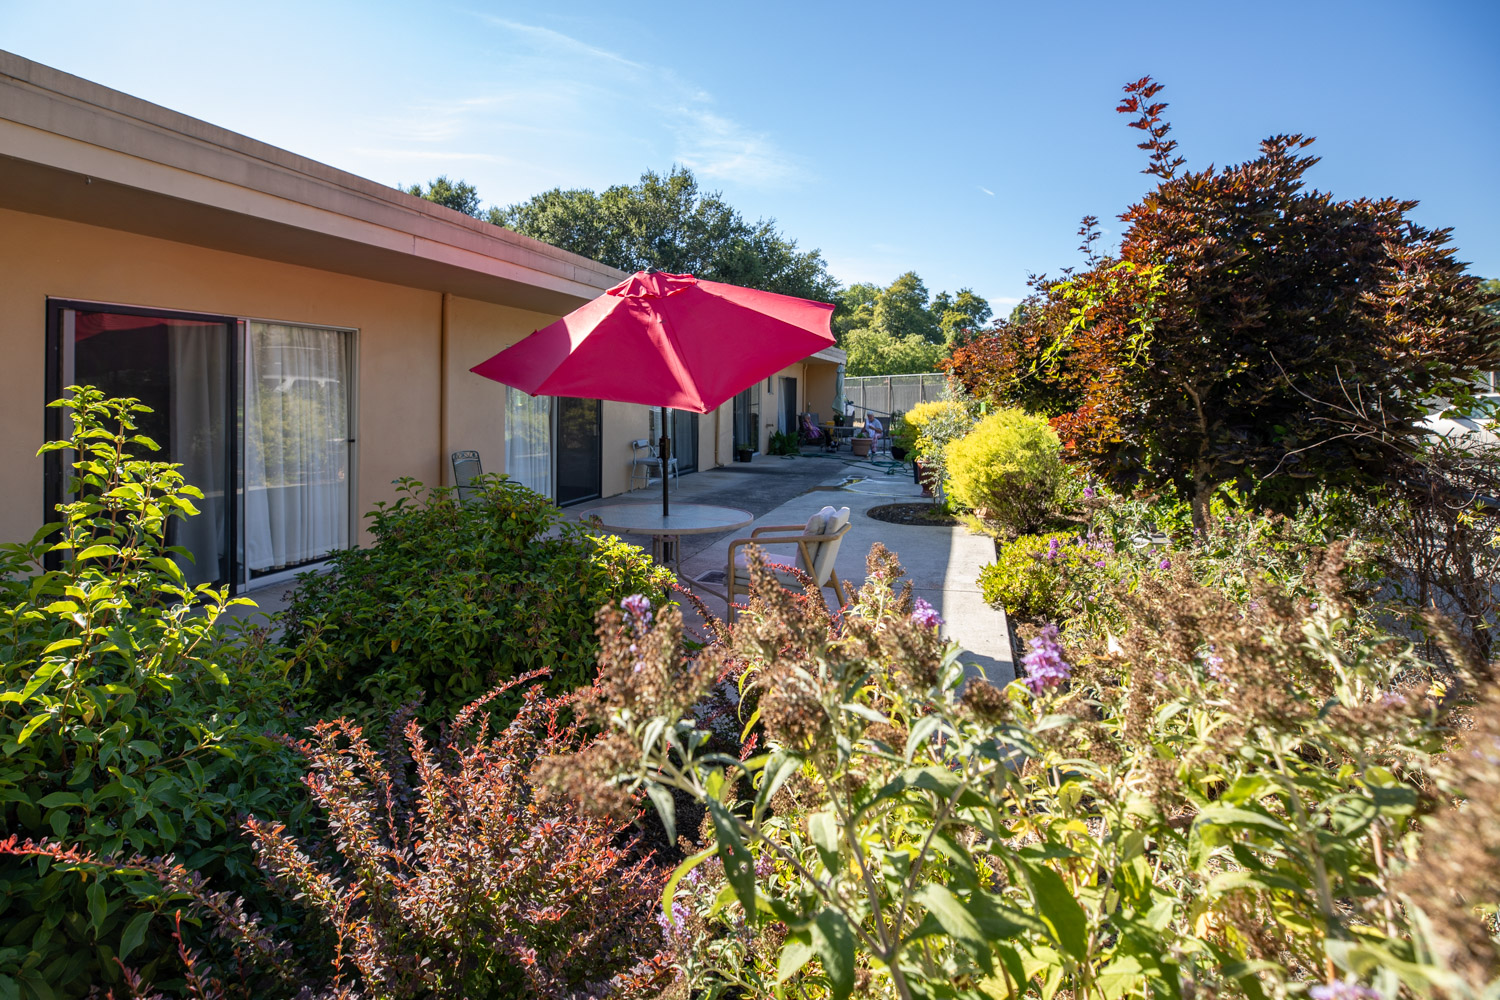
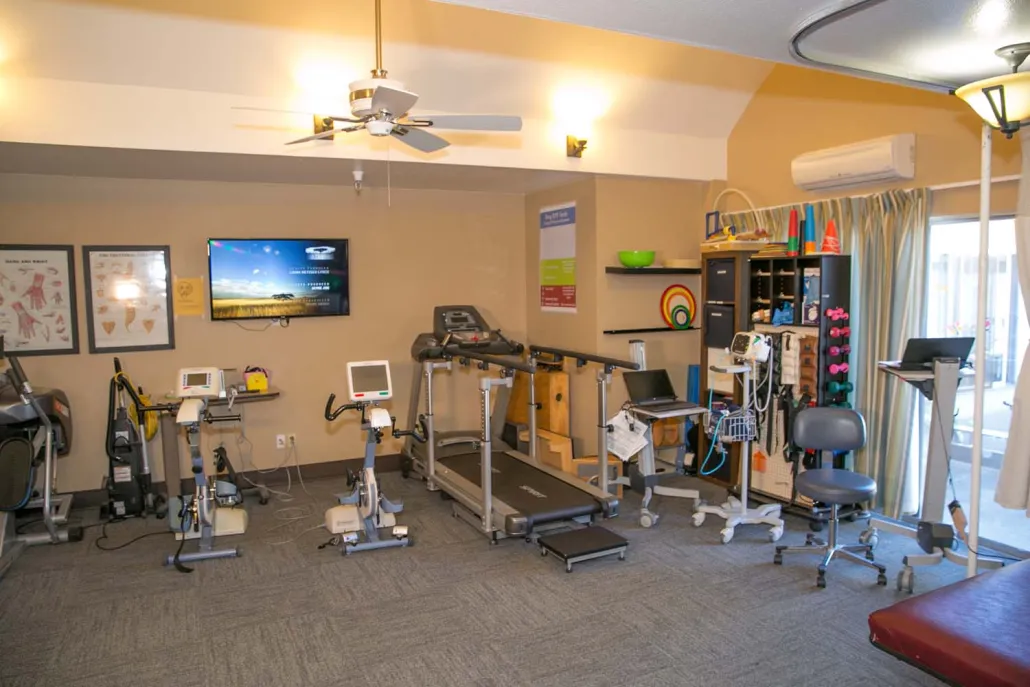
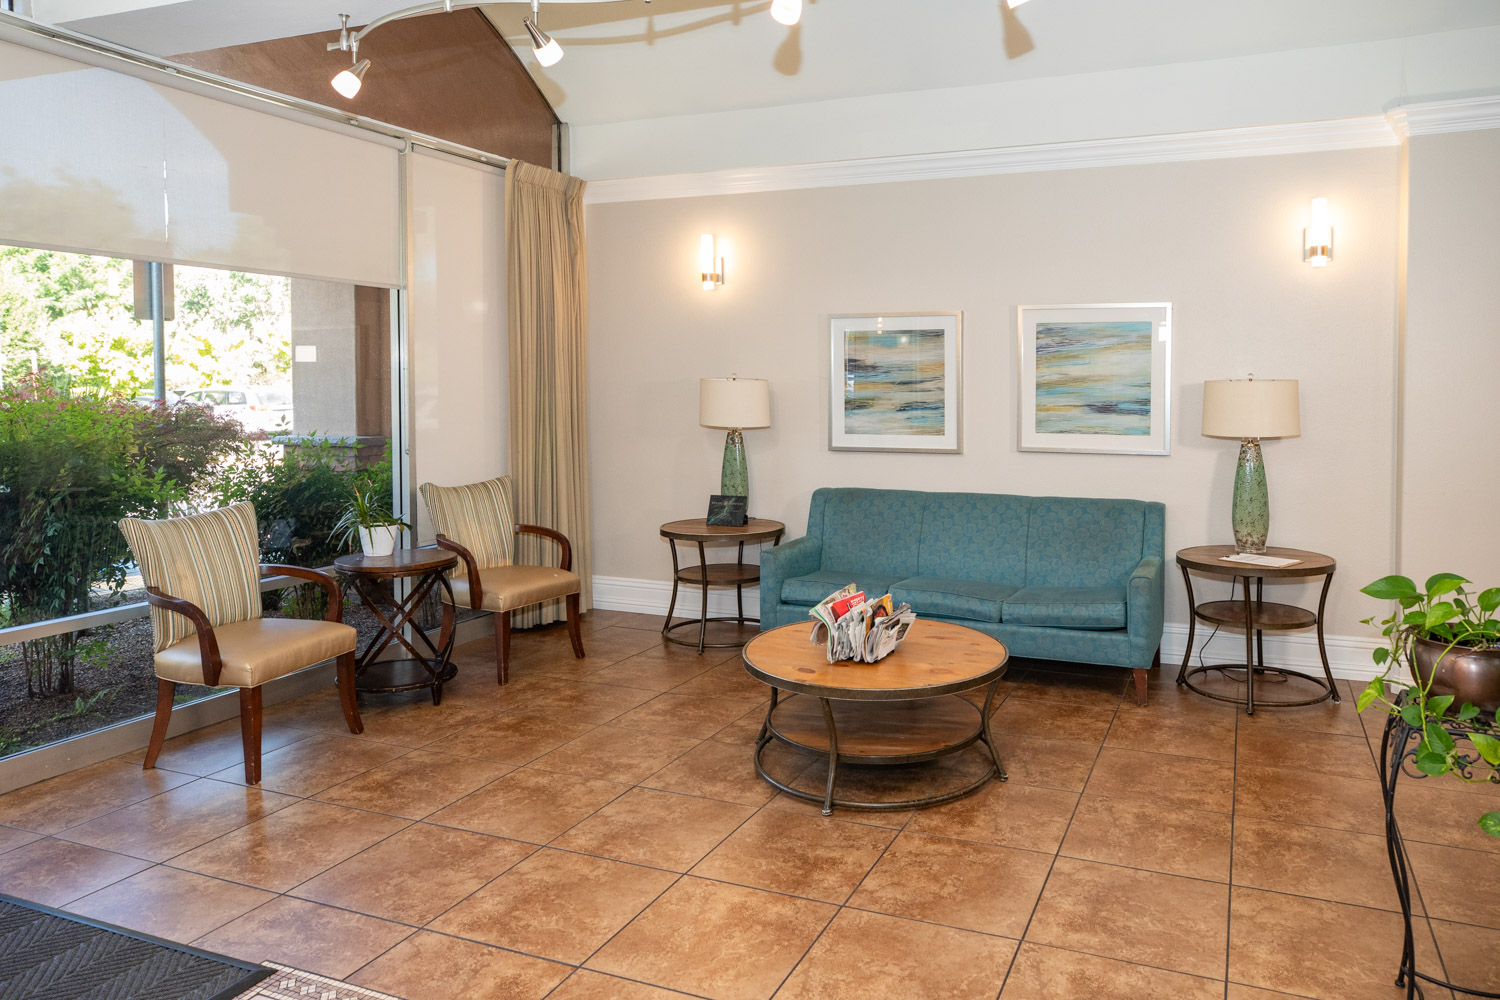
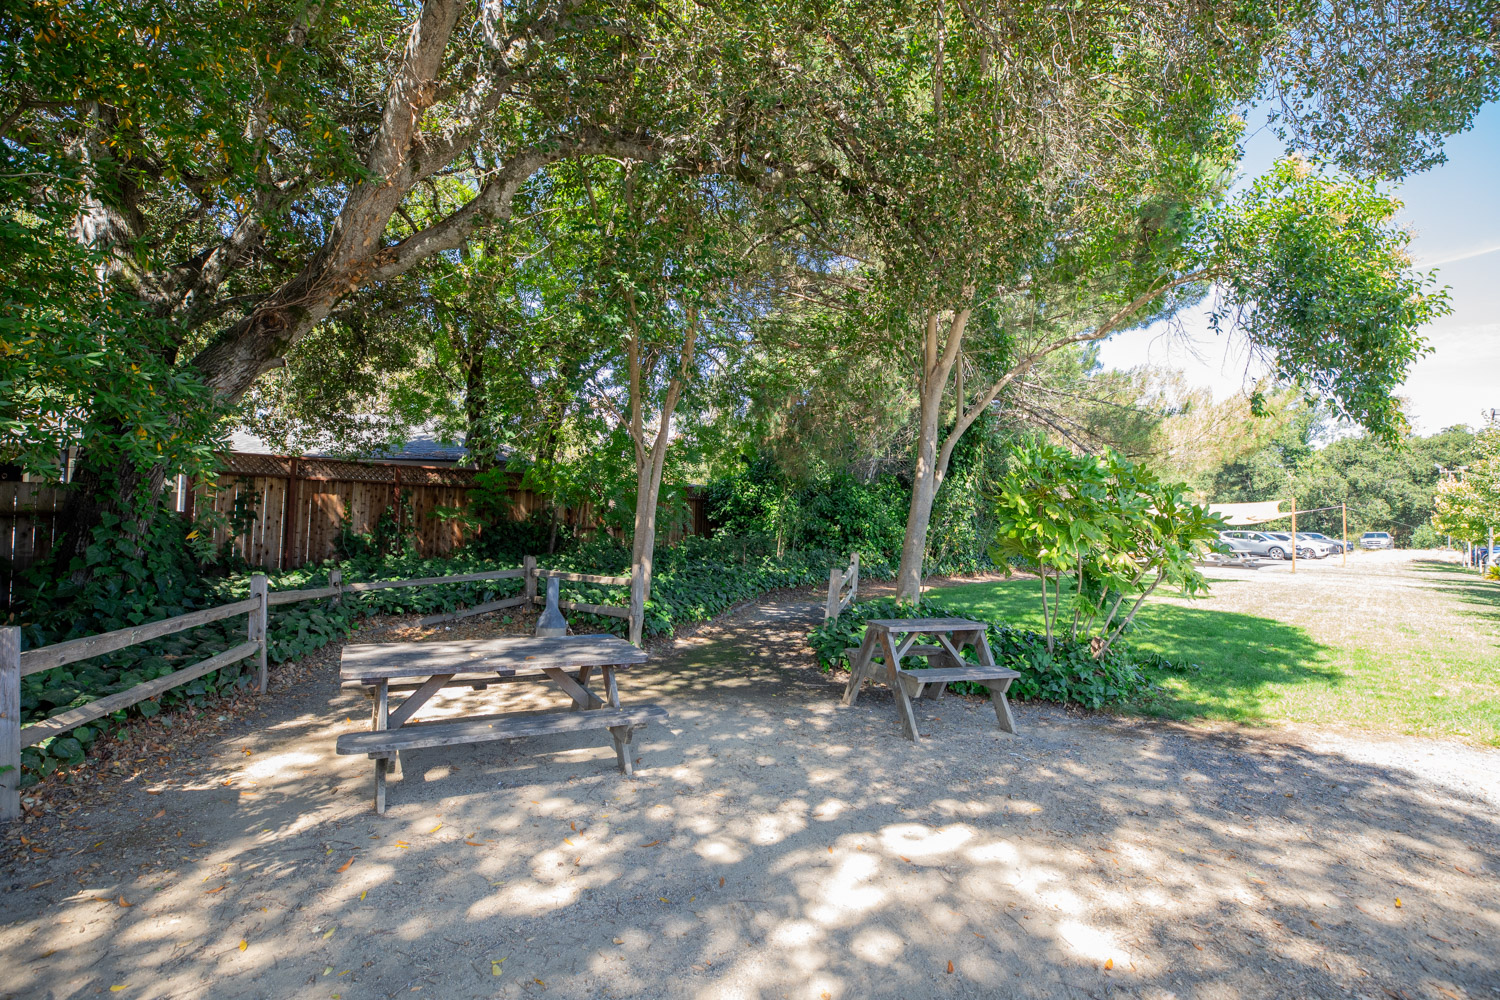
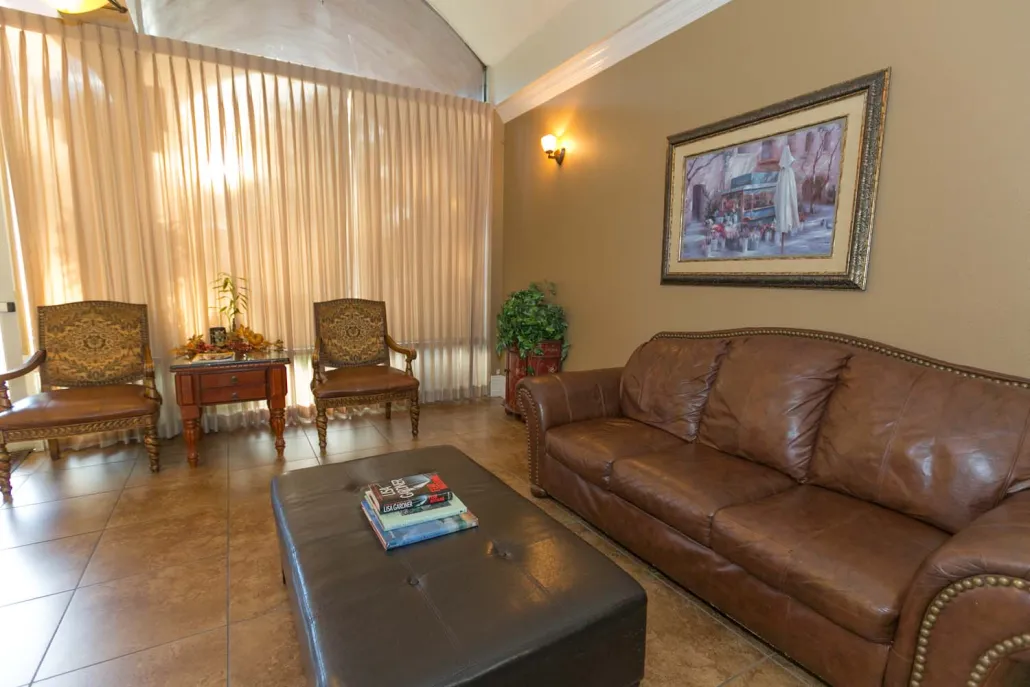
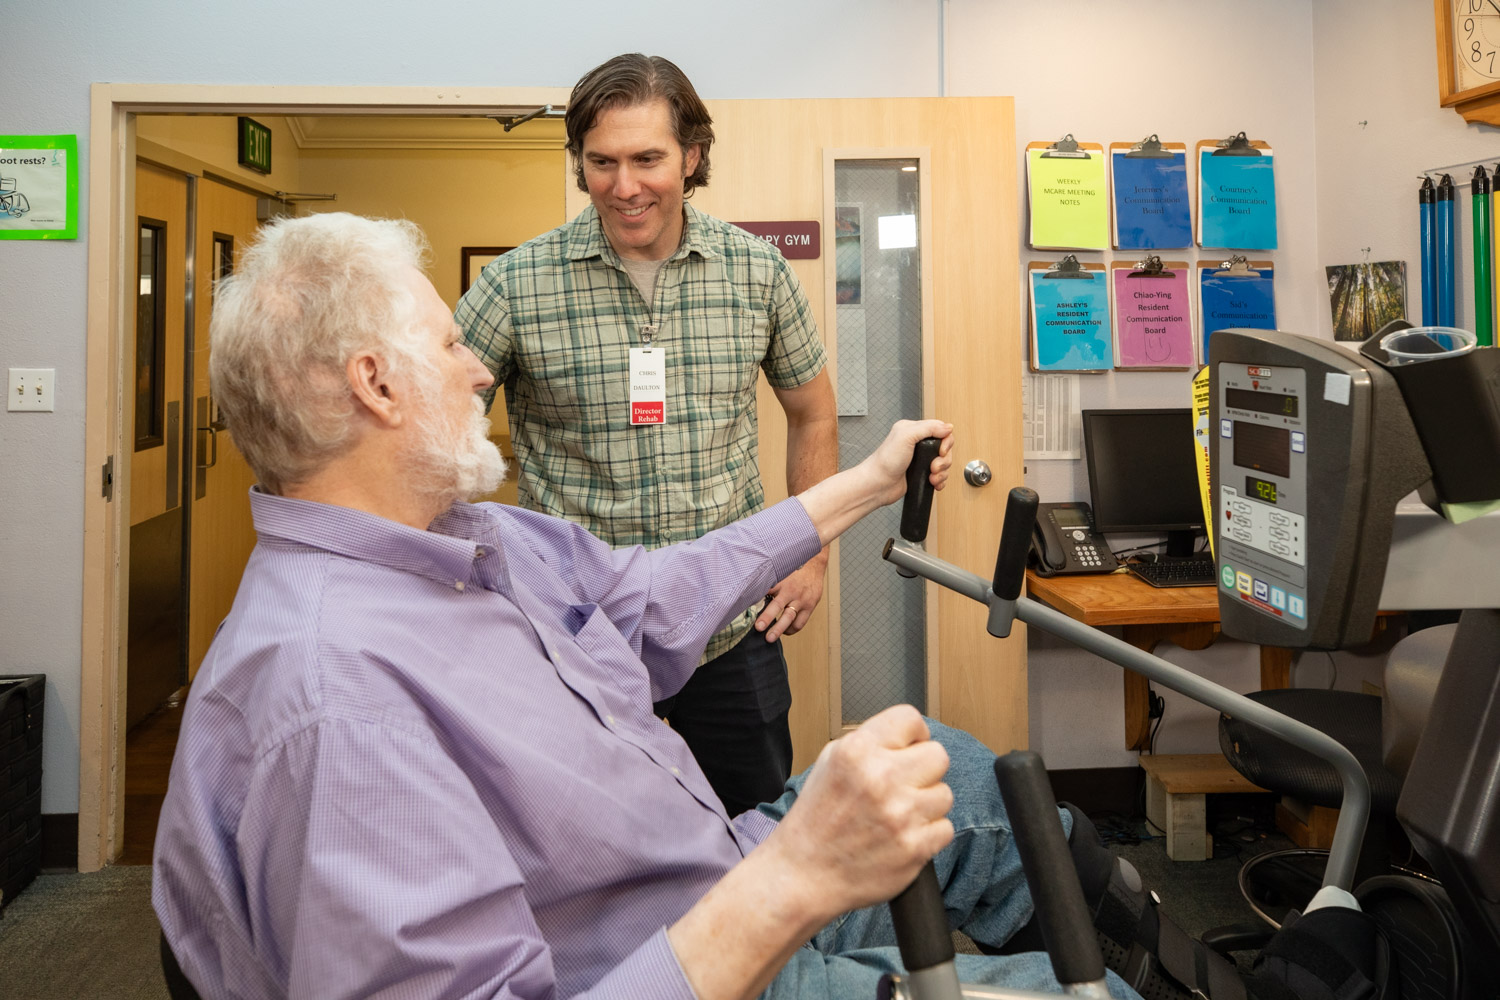
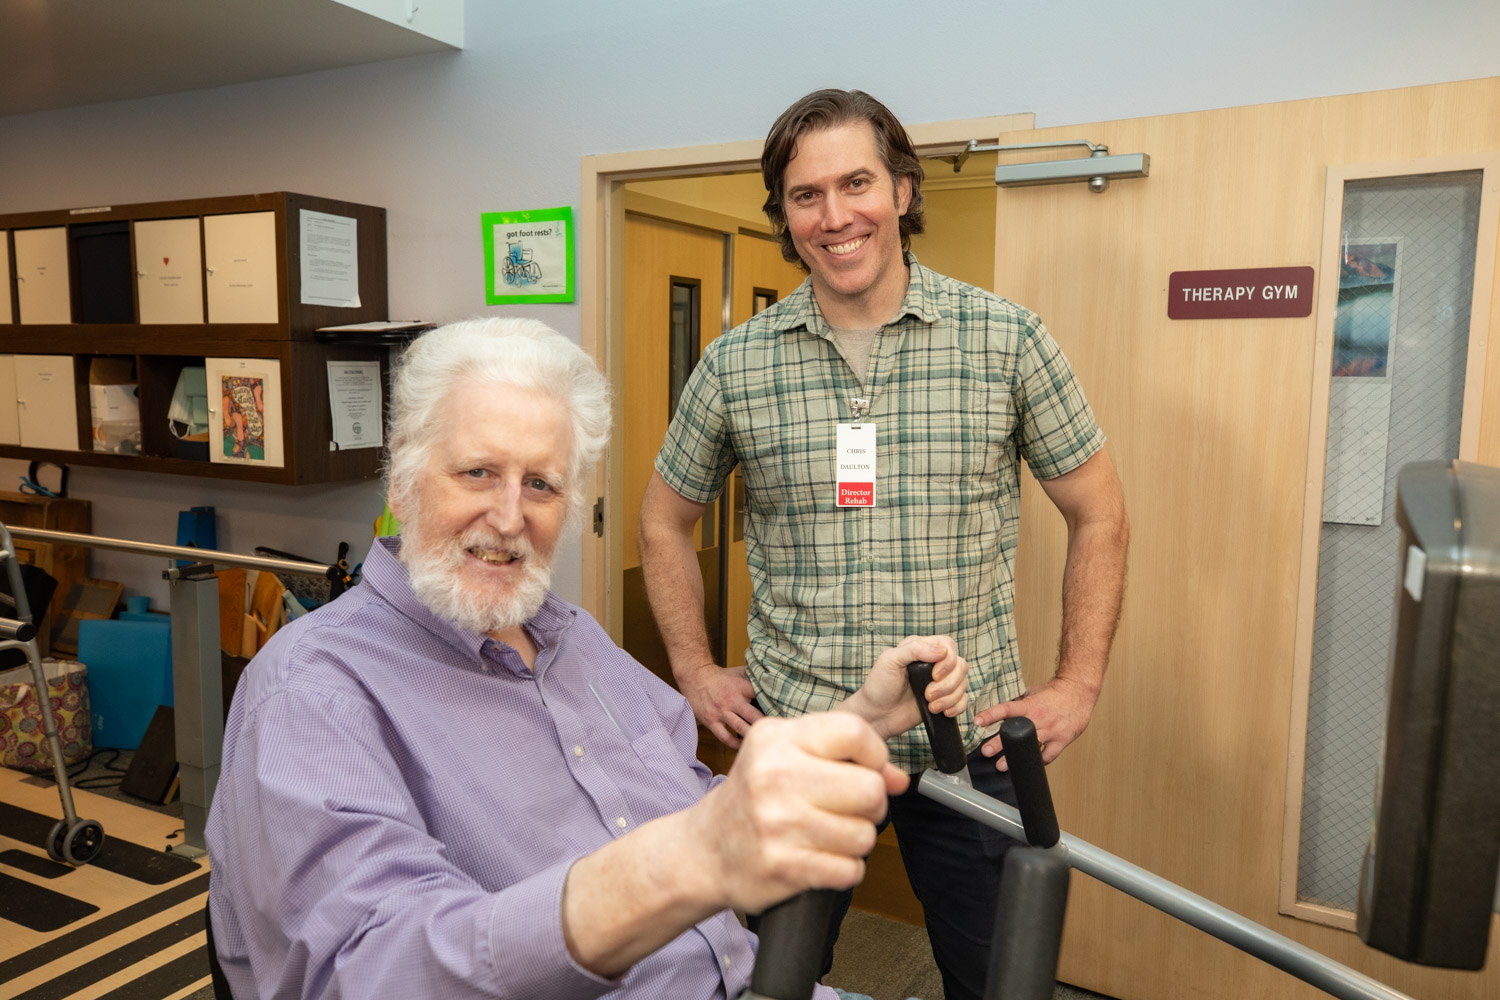
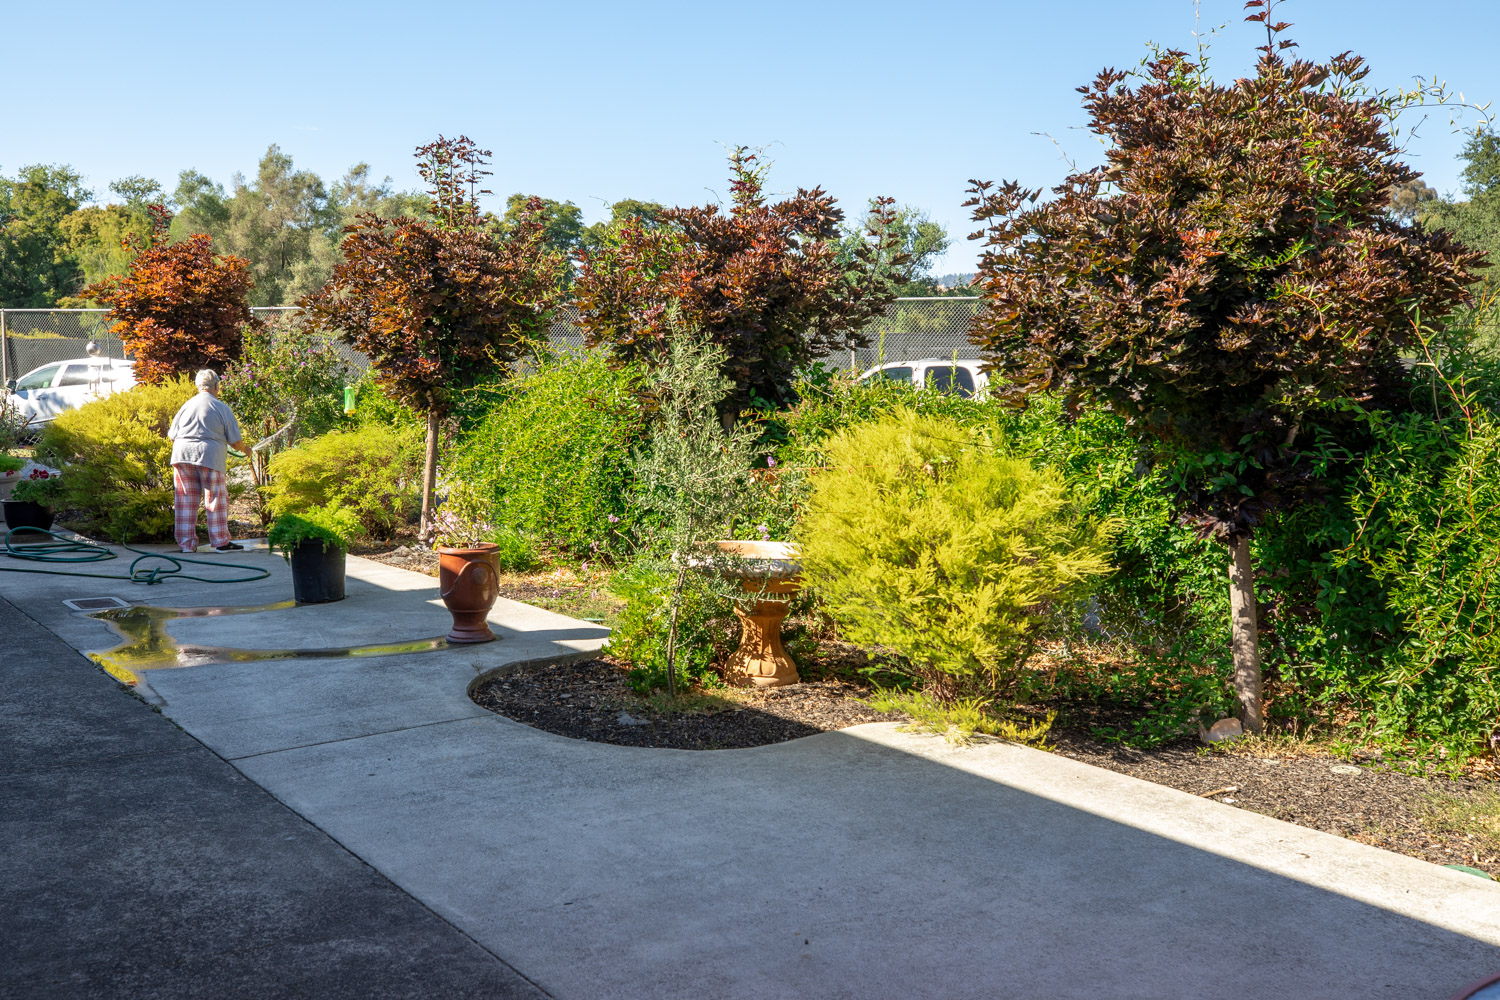
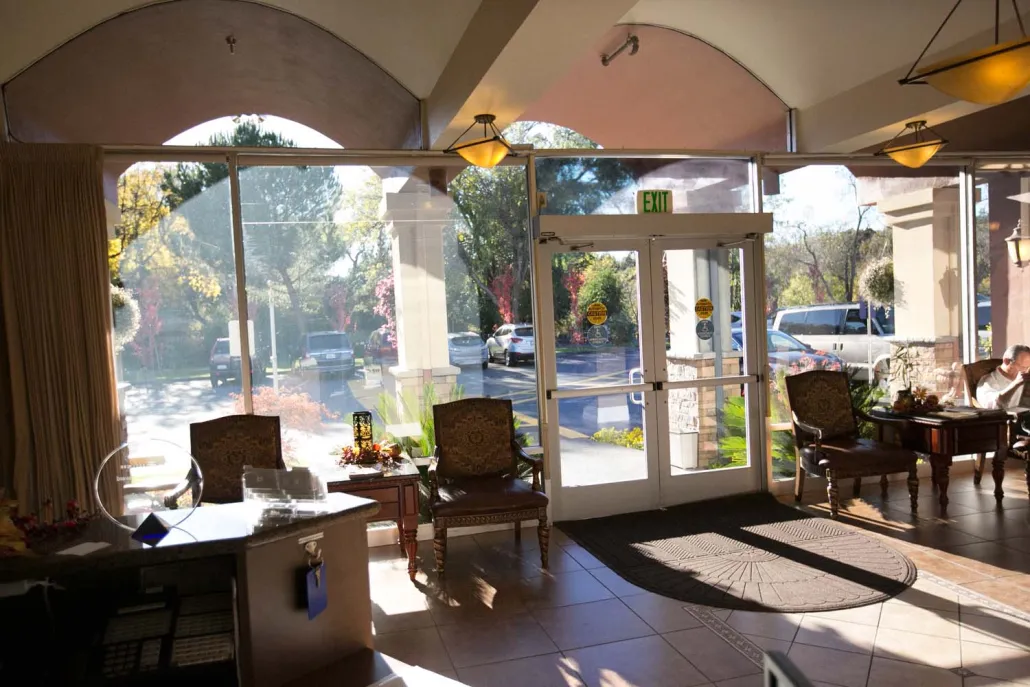
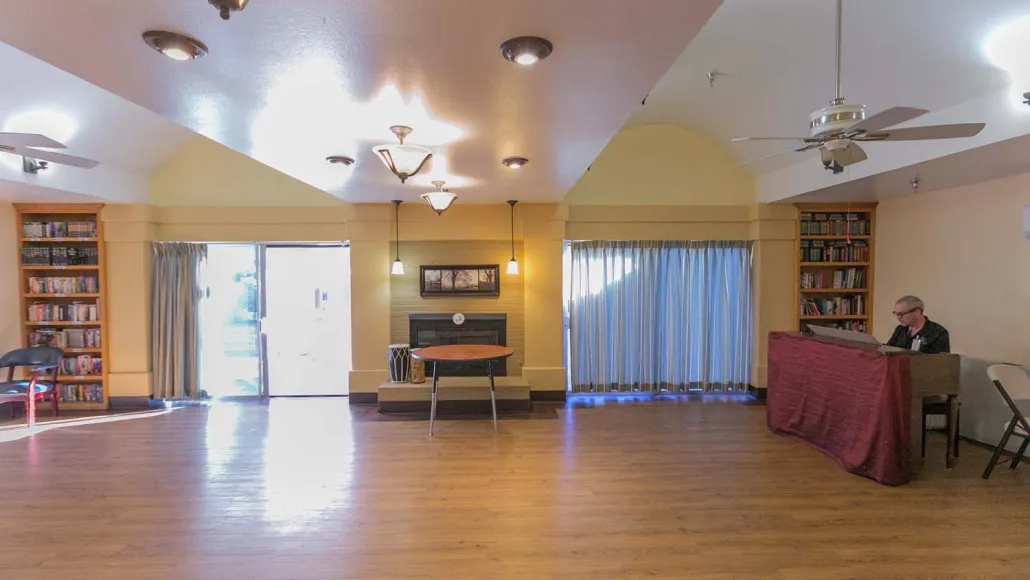
Tucked in Santa Rosa, California, Park View Post Acute is a cutting-edge community that goes beyond being a nursing home – it’s a state-of-the-art haven offering engaging activities and exciting excursions for seniors. Providing a comfortable, safe, and therapeutic environment, this facility boasts a prime location with a light-filled dining room, state-of-the-art therapy rooms, and carefully curated artworks enhancing the surroundings.

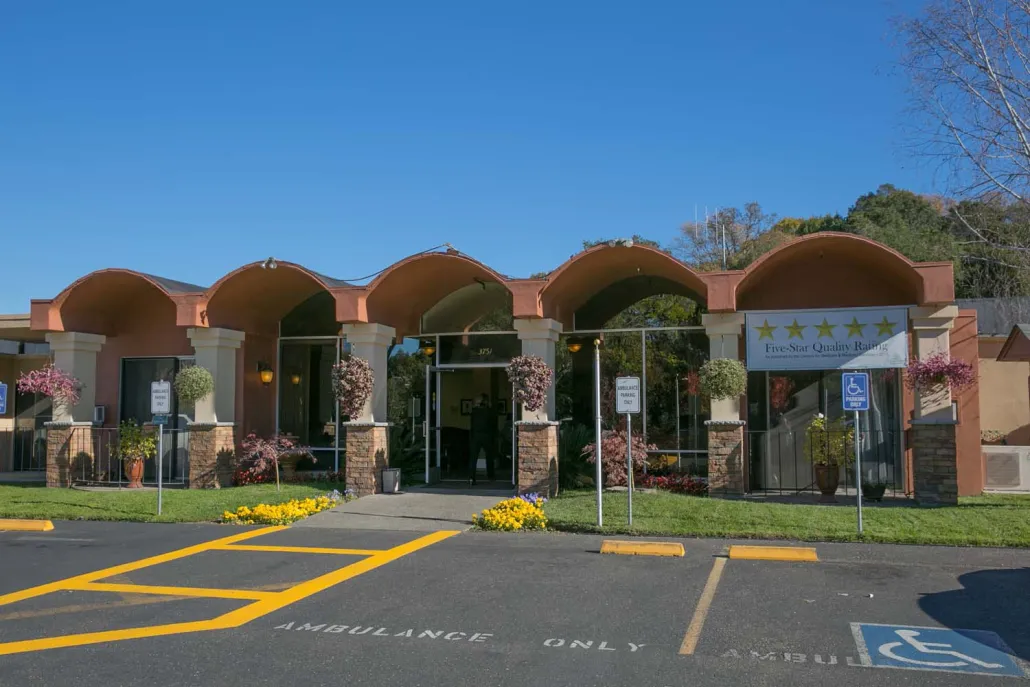
Park View Post Acute stands out with its clean, comfortable living spaces in a well-lit and classic home-like setting. Everything within this community is meticulously organized and well-kept, contributing to its well-deserved five-star quality ratings. Committed to the best care in nursing homes, Park View Post Acute aligns seamlessly with nursing home requirements, ensuring a senior living experience that prioritizes comfort, safety, and engagement.

Quality ratings

Measured by Centers for Medicare & Medicaid Services (CMS)

Overall rating Info The Overall CMS Rating combines results from health inspections, staffing levels and quality measures. Health inspections carry the most weight. Staffing and quality scores can increase or decrease the final rating based on performance compared to state and national standards.
▼ 4.7% Below CA avg. ▼ 4.7% Below CA avg.CA average: 3.1Click the badge to see the full State ranking.Click here to see the full State ranking.
Health Inspection Info Based on the results of the facility's three most recent standard inspections and any complaint investigations. CMS reviews the number, scope, and severity of deficiencies, with more recent findings weighted more heavily.
▼ 28.5% Below CA avg. ▼ 28.5% Below CA avg.CA average: 2.8Click the badge to see the full State ranking.Click here to see the full State ranking.
Staffing Info Measures average nursing staff hours per resident per day, including Registered Nurses (RNs) and total nursing staff. Ratings are adjusted based on the level of care residents require and are compared to state and national benchmarks.
▲ 27.5% Above CA avg. ▲ 27.5% Above CA avg.CA average: 3.1Click the badge to see the full State ranking.Click here to see the full State ranking.
Quality Measures Info Based on clinical and physical health indicators reported to CMS, such as hospital readmissions, falls, pressure ulcers, and improvements in mobility. These measures reflect how well residents' health needs are being managed.
▲ 22.4% Above CA avg. ▲ 22.4% Above CA avg.CA average: 4.1Click the badge to see the full State ranking.Click here to see the full State ranking.

Staffing hours breakdown

Info Daily nursing hours per resident by staff type, reported to CMS. Higher is generally better — compare this facility to state and national averages to see where staffing stands.

Hours per resident per day — compared to California state averages

Total nursing care / resident Info This home is ranked 160th out of 354 homes in California for nurse hours. Total adjusted nursing hours per resident per day, combining RN, LPN, and aide time. CMS adjusts this for case-mix so facilities can be fairly compared.
4h 4m per day
Rank #160 / 354Nurse hours — State benchmarkedThis home is ranked 160th out of 354 homes in California. Shows adjusted nurse hours per resident per day benchmarked to the California average, with a ranking across 354 California facilities. More hours mean more direct care. The national average is about 3.5 hrs; below 3.0 is a red flag.Rankings are based only on facilities in California that report data for that category. Facilities without available data are excluded from the ranking.Click the rank badge to see the full State ranking.Click here to see the full State ranking.
This facility California avg (4h 13m per day)
vs California avg
-3%

2 of 6 metrics below state avg

Standout metric Physical Therapist is +42% above state avg
Staff typeHours / Day / Residentvs state avg
Registered Nurse (RN) Info RNs hold the highest nursing license and can assess residents, interpret test results, and direct care plans. More RN hours per day often signals stronger clinical oversight and faster response to health changes. 30m per day ▼ 22% State avg: 39m per day · National avg: 41m per day
LPN / LVN Info Licensed Practical Nurses (LPNs) or Licensed Vocational Nurses (LVNs) deliver routine hands-on care — medication administration, wound dressing, and monitoring vital signs. They work under RN supervision and make up a large share of daily bedside care. 1h 22m per day ▲ 13% State avg: 1h 13m per day · National avg: 52m per day
Nurse Aide Info Certified Nurse Aides (CNAs) provide the most direct day-to-day assistance: bathing, dressing, feeding, and mobility. Nurse aide hours are typically the largest staffing category and directly affect residents' quality of life. 2h 38m per day ■ Avg State avg: 2h 39m per day · National avg: 2h 21m per day
Weekend Total Nursing Info Combined nursing hours (RN + LPN + Nurse Aide) per resident per day on weekends. Staffing often drops on weekends — this figure reveals whether the facility maintains adequate coverage outside of weekday hours. 4h 8m per day ■ Avg State avg: 4h 5m per day · National avg: 3h 26m per day
Physical Therapist Info Hours per resident per day provided by licensed Physical Therapists (PTs) or PT Assistants. PT services help residents recover mobility after injury or illness and are especially important for post-acute (short-stay) rehabilitation. 7m per day ▲ 42% State avg: 5m per day · National avg: 4m per day
Weekend RN Info Registered nurse hours specifically on weekends. Facilities sometimes reduce RN presence on Saturdays and Sundays — a low weekend RN figure compared to weekday hours can indicate reduced clinical oversight when most administrative staff are absent. 20m per day ▼ 35% State avg: 30m per day · National avg: 29m per day

Capacity and availability

This home usually has limited availability

Higher occupancy than the California average: 84.7%
Occupancy rate
94.8% Rank #202 / 1537Occupancy rate — State benchmarkedThis home is ranked 202nd out of 1537 homes in California. Shows this facility's occupancy rate versus the California average, with its Statewide rank out of 1537. Higher occupancy signals strong local demand and financial stability.Rankings are based only on facilities in California that report data for that category. Facilities without available data are excluded from the ranking.Click the rank badge to see the full State ranking.Click here to see the full State ranking.
Avg. Length of Stay
51 days
Bed community size
116-bed community Rank #608 / 1657Bed count — State benchmarkedThis home is ranked 608th out of 1657 homes in California. Shows this facility's certified or reported bed count compared to other California facilities. Larger communities may offer more amenities, programs, and on-site services for residents and families.Rankings are based only on facilities in California that report data for that category. Facilities without available data are excluded from the ranking.Click the rank badge to see the full State ranking.Click here to see the full State ranking.
A larger shared setting that may offer more common spaces and organized community services.
Walk Score
Walk Score: 32 / 100 Rank #1693 / 2092Walk Score — State benchmarkedThis home is ranked 1693rd out of 2092 homes in California. Shows how walkable this facility's neighborhood is compared to the average Walk Score across California facilities. Higher scores benefit residents, families, and staff.Rankings are based only on facilities in California that report data for that category. Facilities without available data are excluded from the ranking.Click the rank badge to see the full State ranking.Click here to see the full State ranking.
Somewhat walkable. A few nearby services may be reachable on foot, but most trips require transportation.
BBB Rating
BBB Rating: C (Not Accredited)
An independent rating from the Better Business Bureau based on factors such as complaint history, transparency, and business practices.
How BBB ratings work

Staffing

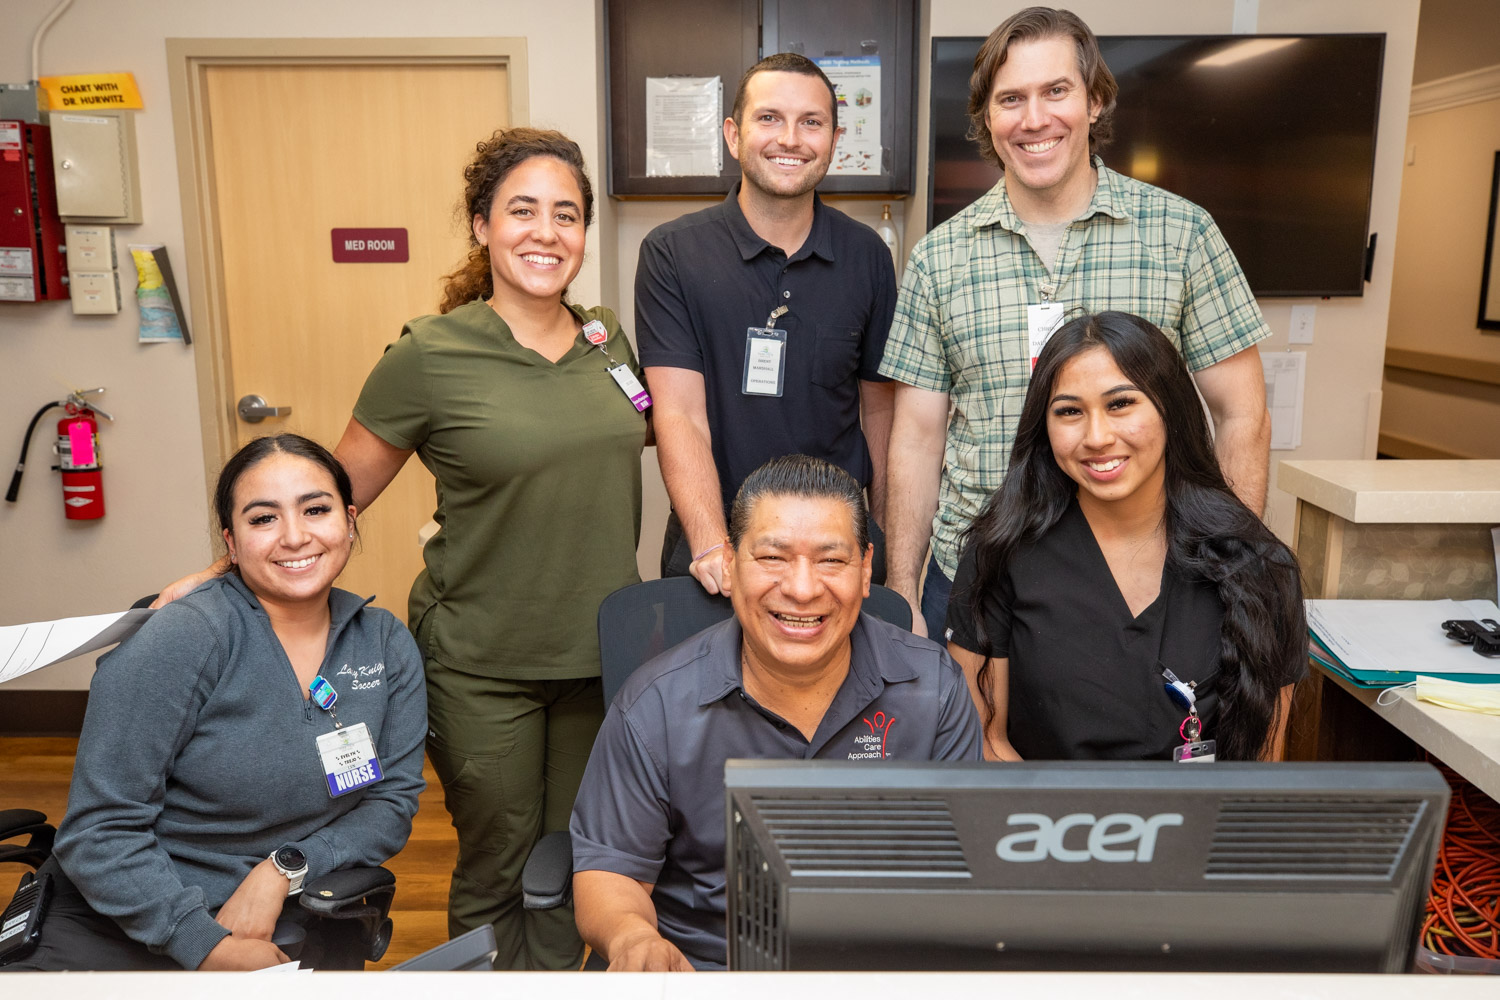
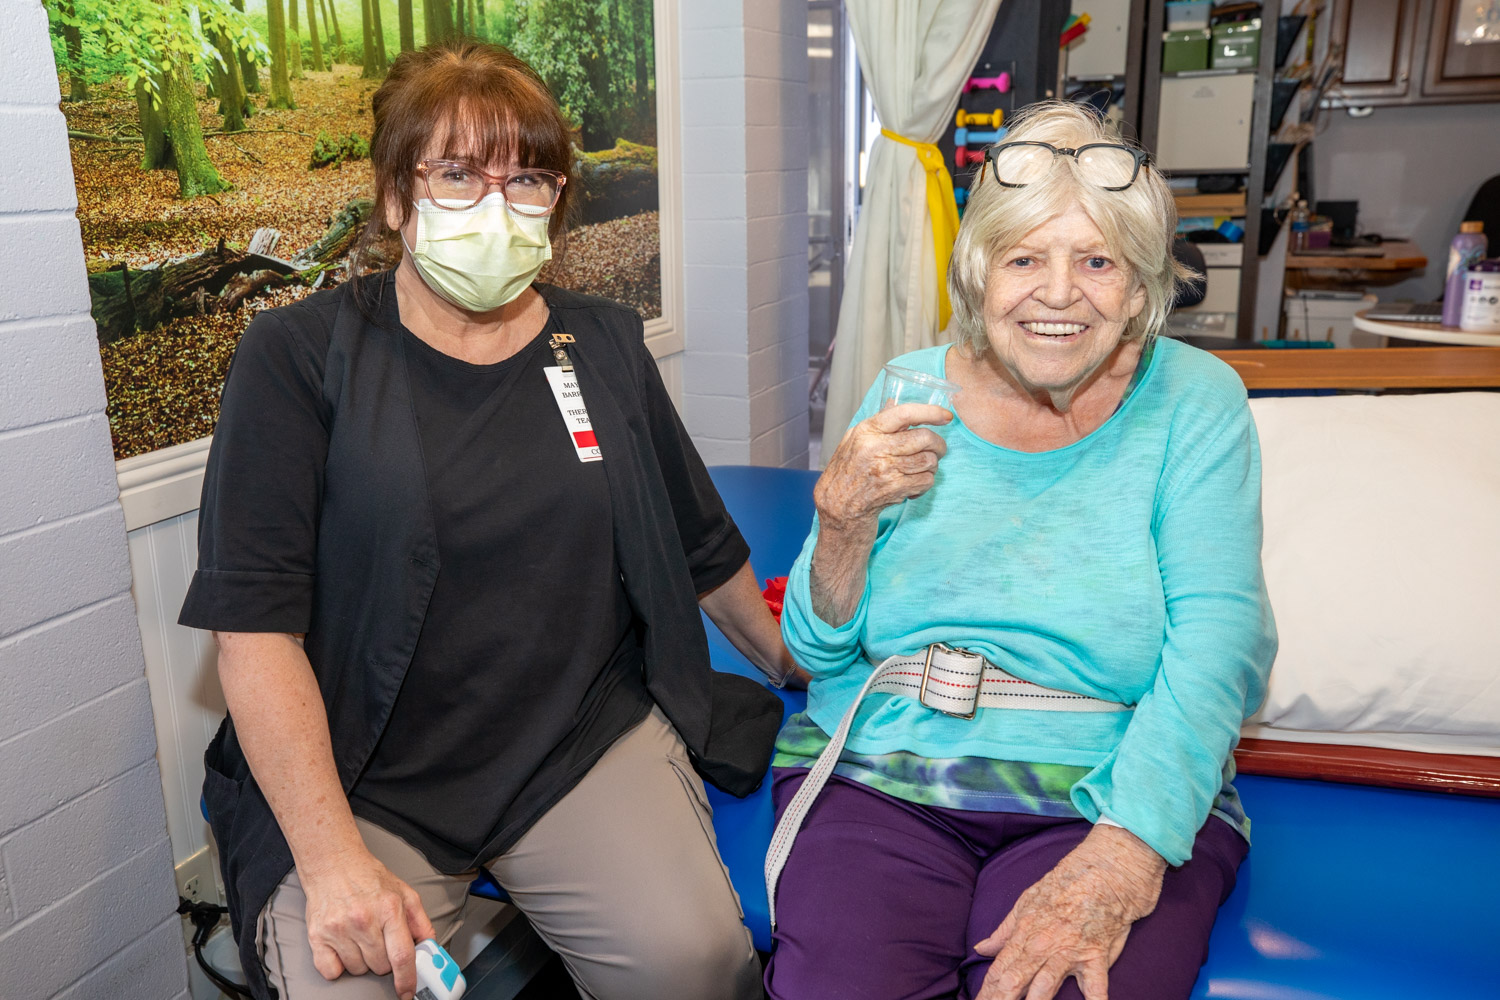
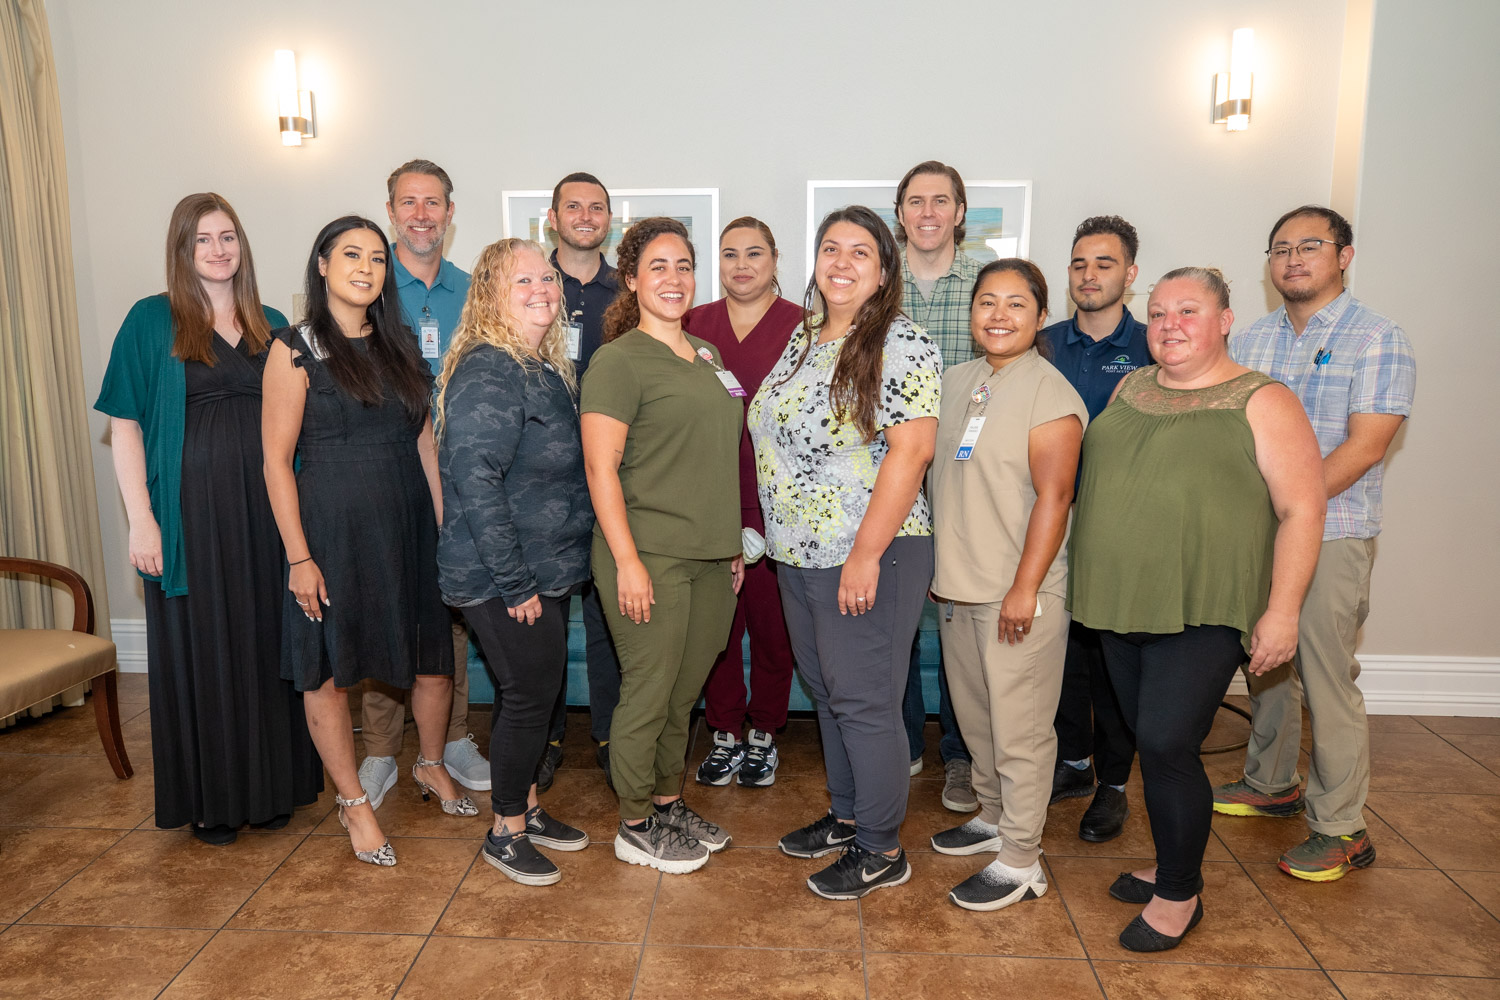
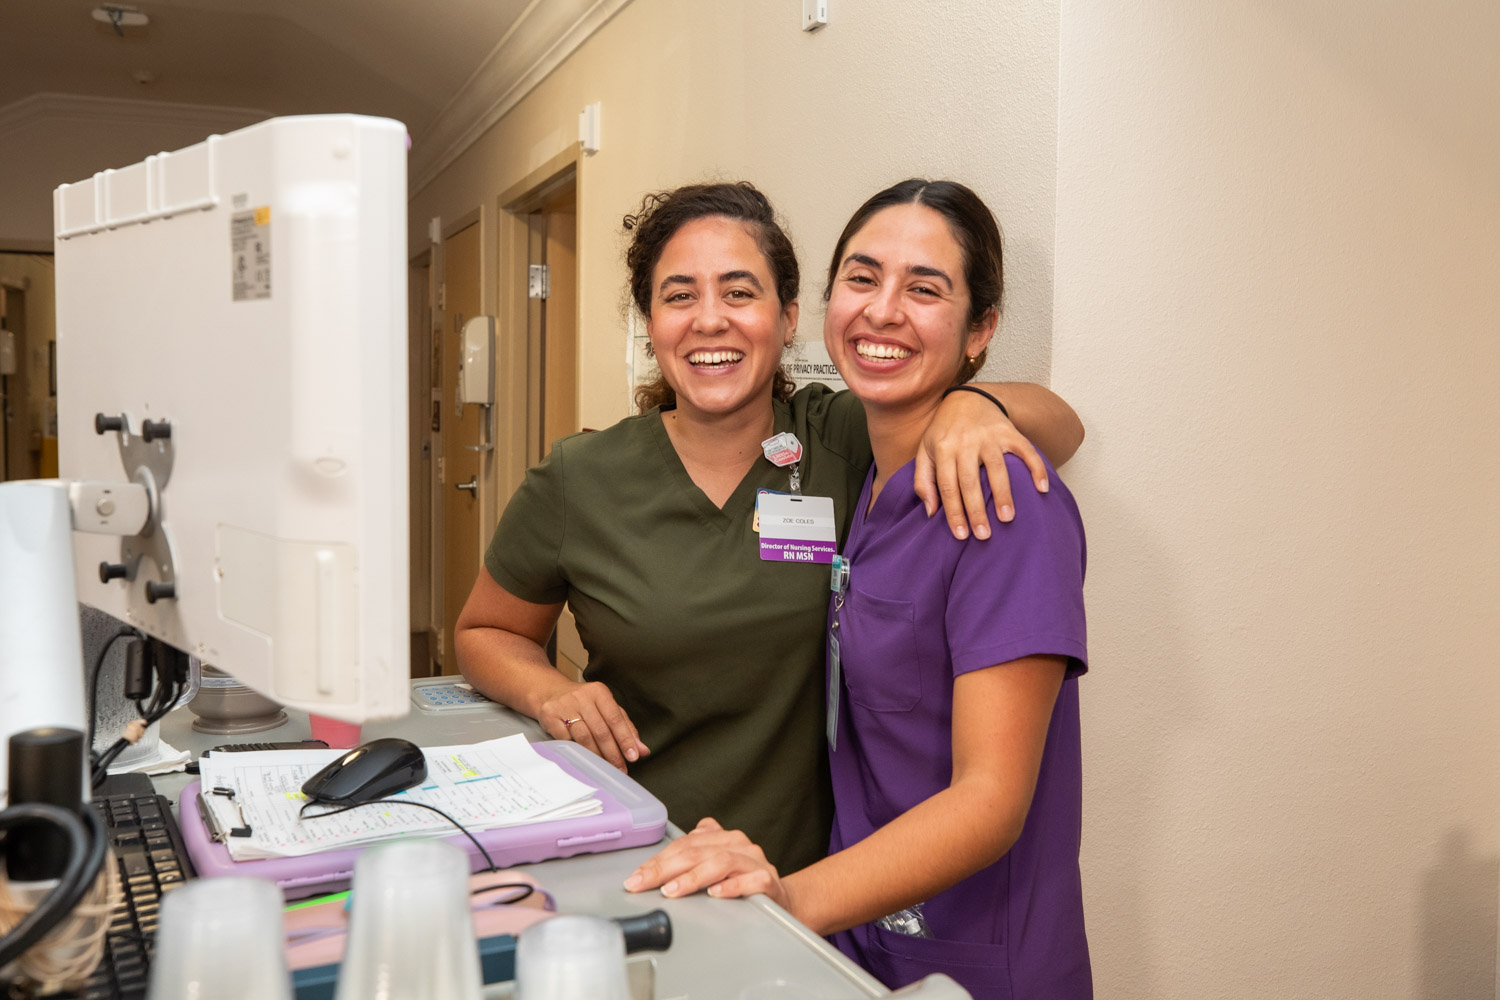
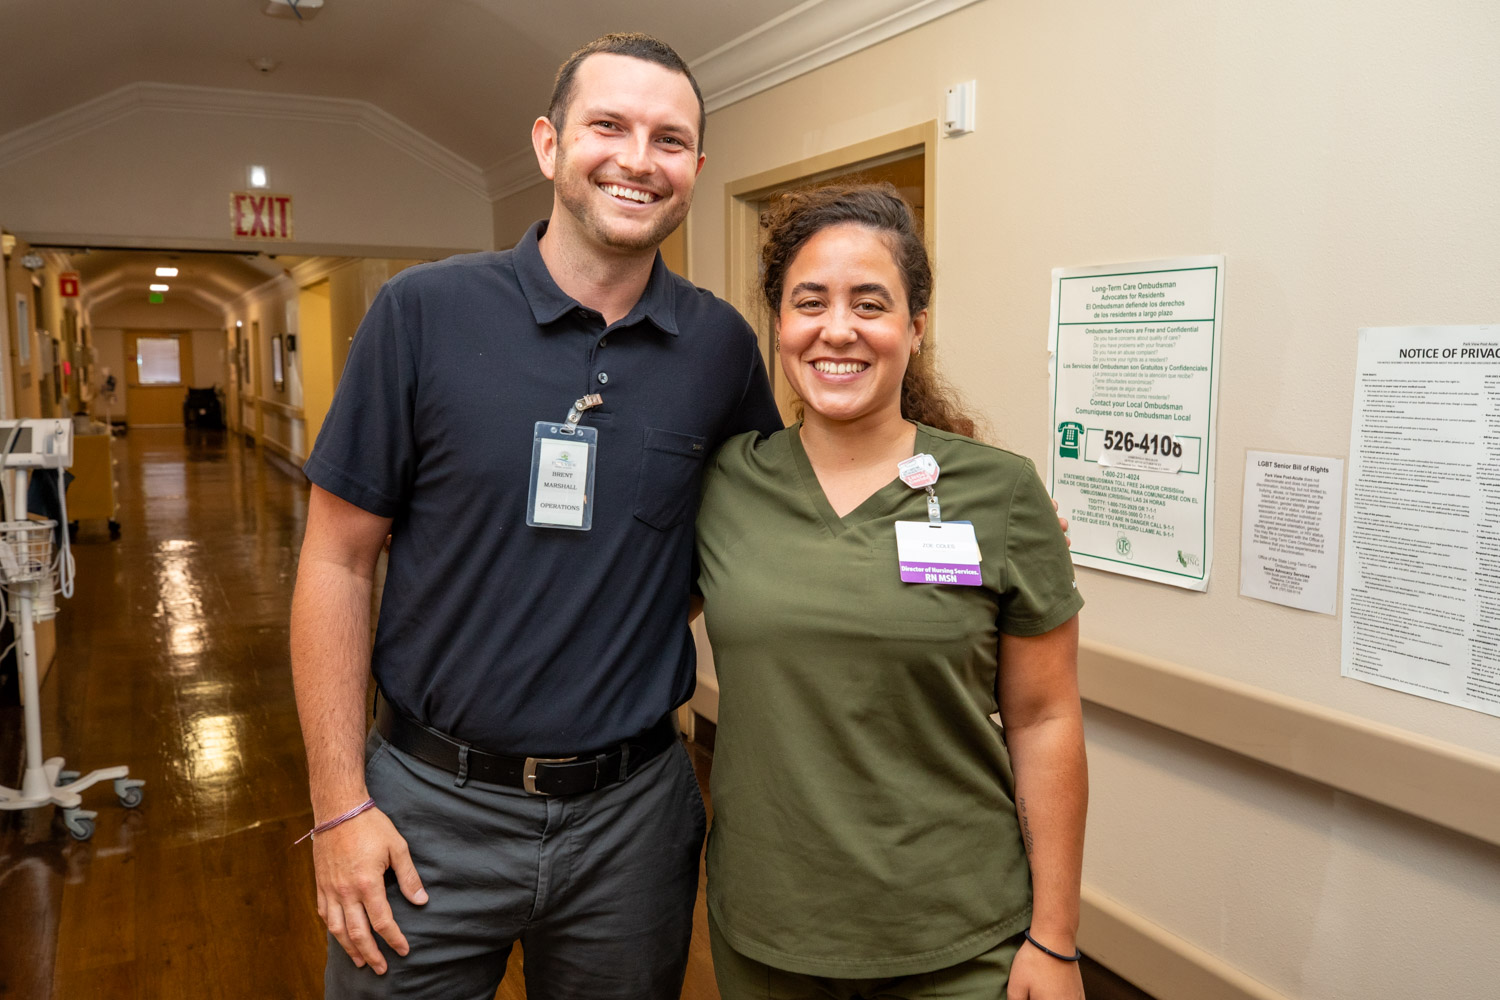
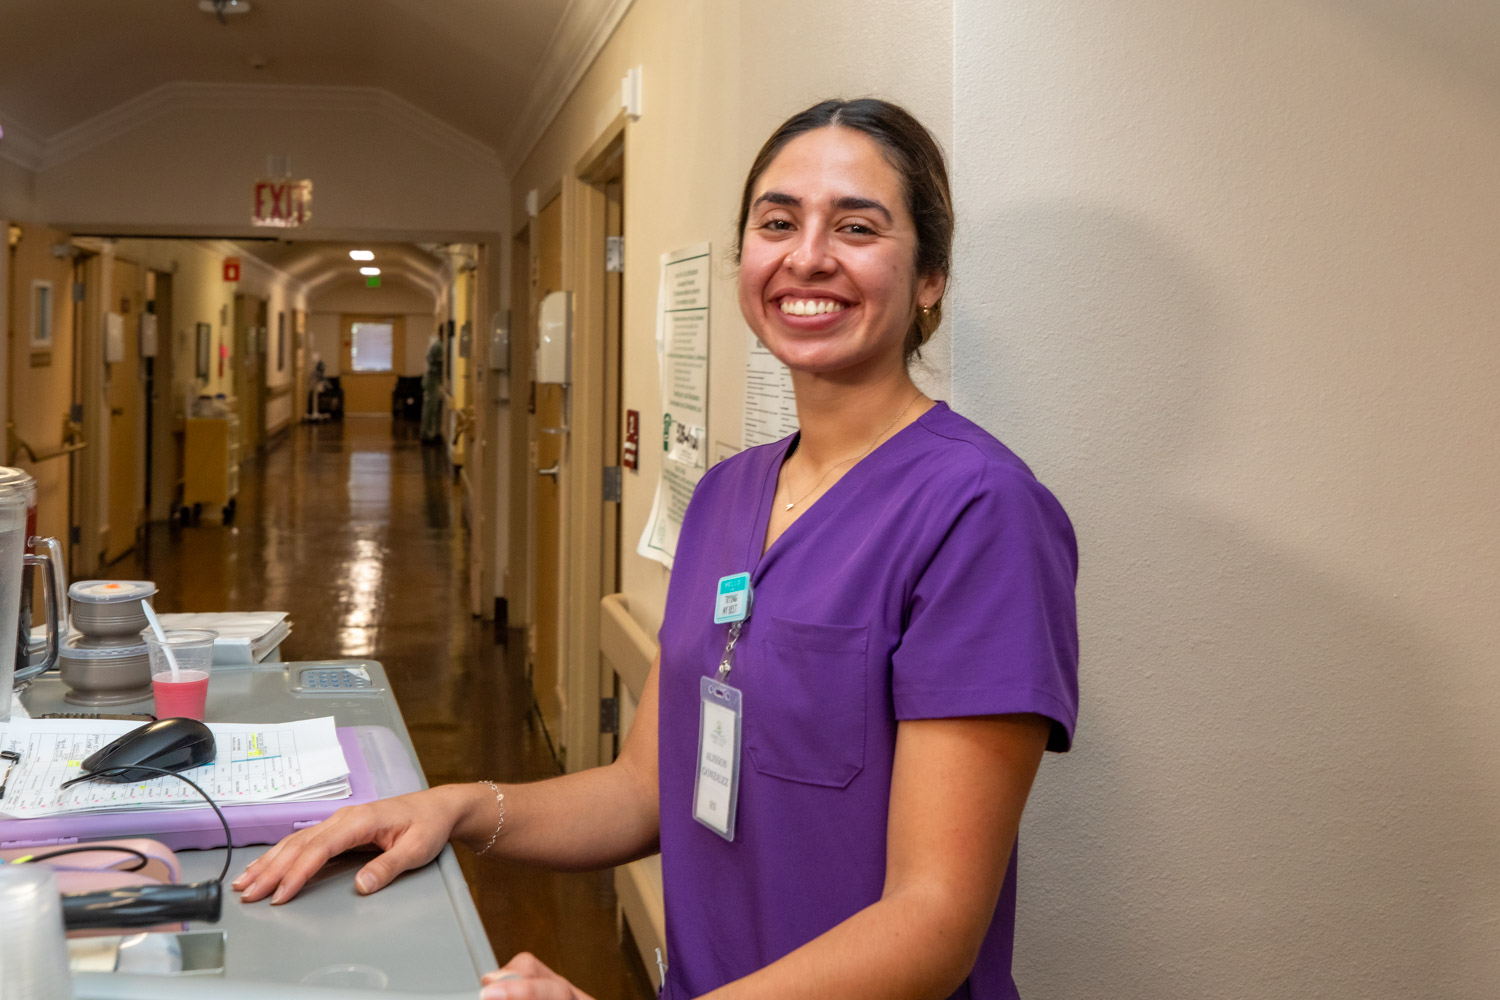
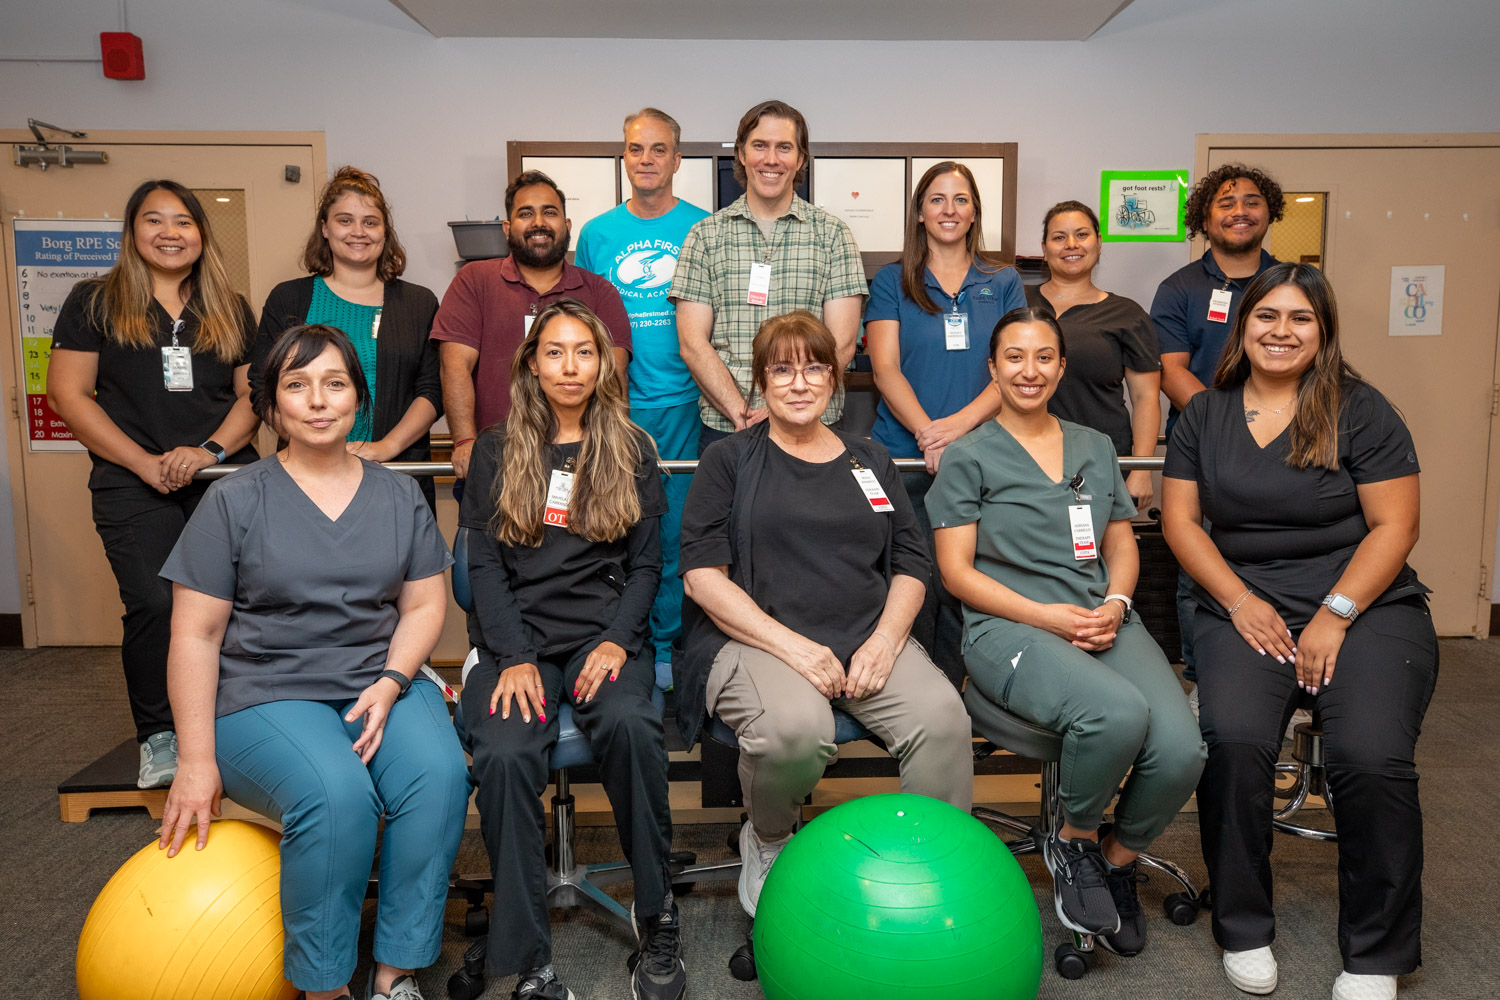
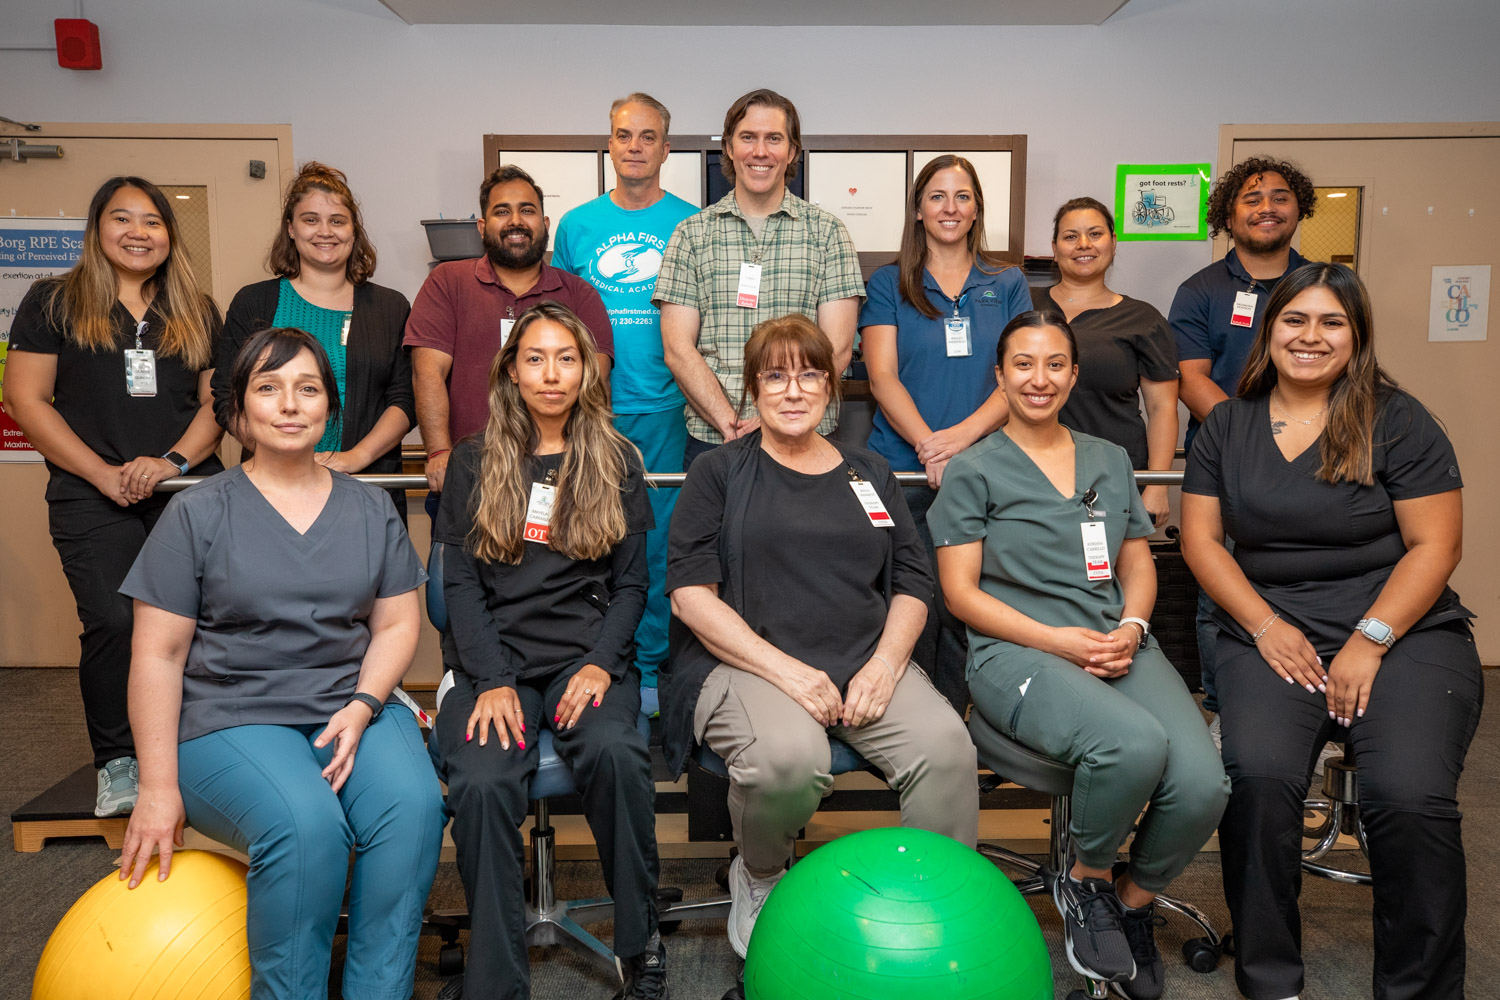
Key information about the people who lead and staff this community.

Leadership

ContactMx. Jonathan Ensign, Owner

Payment & Insurance

2 services
Accept Medicaid
Accept Medicare

Therapy & Rehabilitation

1 service
Rehabilitation Services

Staffing & Medical

2 services
Doctor on Staff
24-Hour Staffing

Amenities & Lifestyle

Specific ProgramsIn-House Therapy, Stay Active
Religious Services

Contact Park View Post Acute

Inspection History

In California, the Department of Social Services (for assisted living facilities) and the Department of Public Health (for nursing homes) conduct inspections to ensure resident safety and regulatory compliance.

Health Inspection History

Inspections since 2019
Total health inspections 11

California average 12.5


Last Health inspection on Sep 2025

Total health citations
54 Rank #248 / 361Health citations — State benchmarkedThis home is ranked 248th out of 361 homes in California. Shows this facility's total health deficiency citations benchmarked to the California State average, with a ranking across all 361 CA facilities. Lower citation counts earn a better rank.Rankings are based only on facilities in California that report data for that category. Facilities without available data are excluded from the ranking.Click the rank badge to see the full State ranking.Click here to see the full State ranking.

California average 50.2

Citations per inspection
4.91 Rank #240 / 361Citations per inspection — State benchmarkedThis home is ranked 240th out of 361 homes in California. Shows average deficiency citations per CMS inspection for this facility versus the California mean across 361 facilities with citation data. Lower is better.Rankings are based only on facilities in California that report data for that category. Facilities without available data are excluded from the ranking.Click the rank badge to see the full State ranking.Click here to see the full State ranking.

California average 4.65


Health citations are formal notices following inspections when they fail to comply with safety and care standards.

37 of 54 citations resulted from standard inspections; 13 of 54 resulted from complaint investigations; and 4 of 54 came from combined inspections (standard and complaint).

Breakdown of citation severity (last 7 years)
Critical health citations
0
100% better than California average

California average: 0.4


Serious health citations
1
In line with California average

California average: 1

0 critical citations California average: 0.4

1 serious citation California average: 1

53 moderate citations California average: 47.2

0 minor citations California average: 1.5
Citations history (last 7 years)
Pharmacy moderate citation Sep 03, 2025
Corrected

Care Planning moderate citation Jul 17, 2025
Corrected

Care Planning moderate citation Jun 02, 2025
Corrected

Care Planning moderate citation Jun 02, 2025
Corrected

Staffing Data

Reporting period: October 1 – December 31, 2025 (Q4 2025). Source: CMS Payroll-Based Journal report.

Total staff 184
Employees 183
Contractors 1
Staff to resident ratio 1.74 : 1
0% compared with California average
California average ratio: 1.81 : 1 California average ratio: 1.81 : 1See full California ranking
Avg staff/day 86
Average shift 7.4 hours
0% compared with California average
California average: 7.7 hours California average shift: 7.7 hoursSee full California ranking
Total staff hours (quarter) 58,623

Nursing staff breakdown

Q4 2025 · Oct 1 – Dec 31 More info This data comes from the CMS Payroll-Based Journal report covering October 1 – December 31, 2025.
Registered Nurse

Manages medical care and health needs.

RN Staff Info All 19 RN Staff are full-time employees. No contractors work on this role. 19
Average shift length Info Average shift length. Calculated as total hours divided by days worked and average staff per day. 7.8 hours
Licensed Practical Nurse

Assists with medical care and medications.

LPN Staff Info All 30 LPN Staff are full-time employees. No contractors work on this role. 30
Average shift length Info Average shift length. Calculated as total hours divided by days worked and average staff per day. 7.6 hours
Certified Nursing Assistant

Helps with daily care and mobility.

CNA Staff Info 80 total: 79 full-time employees and 1 contractor. 80
Average shift length Info Average shift length. Calculated as total hours divided by days worked and average staff per day. 7.2 hours

Contractor staffing

Q4 2025 · Oct 1 – Dec 31 More info This data comes from the CMS Payroll-Based Journal report covering October 1 – December 31, 2025.

Total hours from contractors

0.2%

106 contractor hours this quarter

Certified Nursing Assistant: 1

Staff by category

Q4 2025 · Oct 1 – Dec 31 More info This data comes from the CMS Payroll-Based Journal report covering October 1 – December 31, 2025.
Certified Nursing Assistant7918026,00692100%7.2
Licensed Practical Nurse3003011,51492100%7.6
Registered Nurse190194,34492100%7.8
Dental Services Staff9093,21692100%7.9
Physical Therapy Assistant9092,2349199%6.7
Speech Language Pathologist6062,0868997%7.2
RN Director of Nursing6062,0278693%7.6
Other Dietary Services Staff4041,31492100%7.3
Respiratory Therapy Technician8081,1698087%6
Physical Therapy Aide3039467582%7.7
Therapeutic Recreation Specialist2029187683%7.8
Qualified Social Worker2027076571%7.4
Nurse Practitioner1015946672%9
Administrator1015286672%8
Dietitian1015126470%8
Occupational Therapy Aide2024485560%8
Clinical Nurse Specialist101611112%5.6
80 Certified Nursing Assistant
% of Days 100%
30 Licensed Practical Nurse
% of Days 100%
19 Registered Nurse
% of Days 100%
9 Dental Services Staff
% of Days 100%
9 Physical Therapy Assistant
% of Days 99%
6 Speech Language Pathologist
% of Days 97%
6 RN Director of Nursing
% of Days 93%
4 Other Dietary Services Staff
% of Days 100%
8 Respiratory Therapy Technician
% of Days 87%
3 Physical Therapy Aide
% of Days 82%
2 Therapeutic Recreation Specialist
% of Days 83%
2 Qualified Social Worker
% of Days 71%
1 Nurse Practitioner
% of Days 72%
1 Administrator
% of Days 72%
1 Dietitian
% of Days 70%
2 Occupational Therapy Aide
% of Days 60%
1 Clinical Nurse Specialist
% of Days 12%

Penalties and fines

Federal penalties imposed by CMS for regulatory violations, including civil money penalties (fines) and denials of payment for new Medicare/Medicaid admissions.

Source: CMS Penalties Database

No penalties in the past 3 years

No civil money penalties or payment denials were reported in the last 3 years.

Quality of care over time

These measures show how residents usually do over time at this home, based on health outcomes and preventive care.

High-risk clinical events score Info A composite score based on pressure ulcers, falls with injury, weight loss, walking ability decline, and activities of daily living decline. 4.9
26% better than California average

California average: 6.6

Functional decline score Info A composite score based on activities of daily living decline, walking ability decline, and incontinence. 11.5
In line with California average

California average: 11.3

Long-stay resident measures
Significantly above average California avg: 4.2 Info CMS star rating based on long-stay quality measure performance. 5 stars = significantly above average, 1 star = significantly below average.
Need for Help with Daily Activities Increased Info Percent of long-stay residents whose need for help with daily activities has increased 6.2%
44% better than California average

California average: 11.1%

Walking Ability Worsened Info Percent of long-stay residents whose ability to move independently worsened 10.2%
15% better than California average

California average: 12.0%

Low Risk Residents with Bowel/Bladder Incontinence Info Percent of low risk long-stay residents who lose control of their bowels or bladder 18.1%
61% worse than California average

California average: 11.3%

Falls with Major Injury Info Percent of long-stay residents experiencing one or more falls with major injury 4.2%
150% worse than California average

California average: 1.7%

High Risk Residents with Pressure Ulcers Info Percent of long-stay high risk residents with pressure ulcers 2.8%
43% better than California average

California average: 5.0%

Urinary Tract Infection Info Percent of long-stay residents with a urinary tract infection 1.0%
23% better than California average

California average: 1.2%

Lost Too Much Weight Info Percent of long-stay residents who lose too much weight 1.1%
74% better than California average

California average: 4.2%

Depressive Symptoms Info Percent of long-stay residents who have depressive symptoms 9.0%
34% worse than California average

California average: 6.7%

Antipsychotic Use Info Percent of long-stay residents who received an antipsychotic medication 7.8%
23% better than California average

California average: 10.1%

Pneumococcal Vaccine Info Percent of long-stay residents assessed and appropriately given the pneumococcal vaccine 100.0%
In line with California average

California average: 98.5%

Influenza Vaccine Info Percent of long-stay residents assessed and appropriately given the seasonal influenza vaccine 98.3%
In line with California average

California average: 98.2%

Hospitalizations per 1,000 days Info Number of hospitalizations per 1,000 long-stay resident days. 2.12
6% better than California average

California average: 2.25

ED visits per 1,000 days Info Number of outpatient emergency department visits per 1,000 long-stay resident days. 0.93
42% better than California average

California average: 1.59

Short-stay resident measures
Above average California avg: 3.5 Info CMS star rating based on short-stay quality measure performance. 5 stars = much above average, 1 star = much below average.
Pneumococcal Vaccine Info Percent of short-stay residents assessed and appropriately given the pneumococcal vaccine 99.6%
6% better than California average

California average: 94.0%

Antipsychotic medication increase Info Percent of short-stay residents who newly received an antipsychotic medication 1.0%
31% better than California average

California average: 1.5%

Influenza Vaccine Info Percent of short-stay residents assessed and appropriately given the seasonal influenza vaccine 99.0%
6% better than California average

California average: 93.2%

Re-hospitalized after SNF stay Info Percentage of short-stay residents who were re-hospitalized after their nursing home admission. 26.1%
13% worse than California average

California average: 23.2%

Emergency department visits Info Percentage of short-stay residents who had an outpatient emergency department visit. 10.6%
5% better than California average

California average: 11.2%

Falls with major injury Info Percentage of SNF residents who experience falls with major injury during their stay. 0.7%
In line with California average

California average: 0.8%

Ability to care for self at discharge Info Percentage of residents at or above expected ability to care for themselves at discharge. 52.1%
In line with California average

California average: 53.7%

Successful return to home or community Info Rate of successful return to home or community from a skilled nursing facility. 56.3%
11% better than California average

California average: 50.6%

Breakdown by payment type

Medicare

46% of new residents, usually for short-term rehab.

Typical stay 25 days

Private pay

51% of new residents, often for short stays.

Typical stay 21 days

Medicaid

2% of new residents, often for long-term daily care.

Typical stay 4 years

Facility Characteristics

Source: CMS Long-Term Care Facility Characteristics (Data as of Jan 2026)

Total residents 106
Medicare
27
25.5% of residents
Medicaid
52
49.1% of residents
Private pay or other
27
25.5% of residents
Programs & Services
Residents Group

Residents meet regularly to discuss policies, care quality, and activities

Active Resident Council

Organized group of residents that meets regularly to discuss facility policies, quality of life, and activities.

Finances and operations

Based on CMS SNF Cost Report for fiscal year ending in 12/2023.

For-profit
Operated by a single business entity.
Net patient revenue Info Net patient revenue — what the home actually collects for resident care, after contractual allowances, bad debt and discounts are subtracted from its gross charges (CMS cost report, Worksheet G-3). It covers resident care only; money the home earns from other sources is shown separately as "Other income."
$23.4M
Net patient income Info Net patient income: net patient revenue minus the home's total operating expenses. A positive figure means it earns more from resident care than it spends to deliver it; a negative figure means the opposite. It excludes non-operating "other income."
$2.2M
For-profit Operated by a single business entity.
Net patient revenue Info Net patient revenue — what the home actually collects for resident care, after contractual allowances, bad debt and discounts are subtracted from its gross charges (CMS cost report, Worksheet G-3). It covers resident care only; money the home earns from other sources is shown separately as "Other income."
$23.4M Rank #137 / 355Revenue — State benchmarkedThis home is ranked 137th out of 355 homes in California. Shows this facility's annual revenue compared to the California average. Higher revenue generally means more resources for staffing and capital — read alongside Payroll %.Rankings are based only on facilities in California that report data for that category. Facilities without available data are excluded from the ranking.Click the rank badge to see the full State ranking.Click here to see the full State ranking.
Net patient income Info Net patient income: net patient revenue minus the home's total operating expenses. A positive figure means it earns more from resident care than it spends to deliver it; a negative figure means the opposite. It excludes non-operating "other income."
$2.2M
Other income Info Money the home earns outside of resident care — such as investments, grants, rentals and other non-operating sources (CMS cost report, Worksheet G-3). It is tracked separately from net patient revenue: it is not part of that figure, and it is not included in net patient income.
$10.5K
Payroll costs Info Staff salaries plus wage-related costs — benefits such as payroll taxes, health insurance and retirement — from the home's own accounting records (CMS cost report, Worksheet A). Contract or agency labor is counted separately, under other operating costs. Rank #41 / 355Payroll — State benchmarkedThis home is ranked 41st out of 355 homes in California. Shows total annual staff payroll benchmarked to the California average. Higher payroll investment relative to peers often signals better staffing and less reliance on cheaper contract labor.Rankings are based only on facilities in California that report data for that category. Facilities without available data are excluded from the ranking.Click the rank badge to see the full State ranking.Click here to see the full State ranking.
$13.4M 57.4% of net patient revenue Info Payroll as a share of revenue: staff salaries and wage-related benefits divided by net patient revenue. A higher figure means more of each revenue dollar goes to staff pay. Rank #32 / 355Payroll % — State benchmarkedThis home is ranked 32nd out of 355 homes in California. Shows payroll as a percentage of revenue versus the California average. Well-run California facilities typically land around 55–67% — the top third Statewide. Below 25% may signal understaffing or heavy agency use — read with Staffing ratings.Rankings are based only on facilities in California that report data for that category. Facilities without available data are excluded from the ranking.Click the rank badge to see the full State ranking.Click here to see the full State ranking.
Other operating costs Info Everything it costs to run the home apart from payroll — food, utilities, supplies, maintenance, contract labor and administration. Calculated as total operating expense minus payroll (staff salaries and wage-related benefits).
$7.8M
Total costs Info The home's total operating expense for the year — all the costs of running it, salaries included (CMS cost report, Worksheet G-3).
$21.2M

Who this home usually serves

TYPE OF STAY

Mix of rehab and long-term care

This home supports both short-term rehab and long-term care, with residents staying for a wide range of durations.

Most new residents arrive under private pay (51% of admissions), and a typical private pay stay runs around 21 days.

Admissions
788 total

Coverage residents most often arrive under.

Medicare 46%
Private pay 51%
Medicaid 2%
Discharges
783 total

Coverage residents most often leave under.
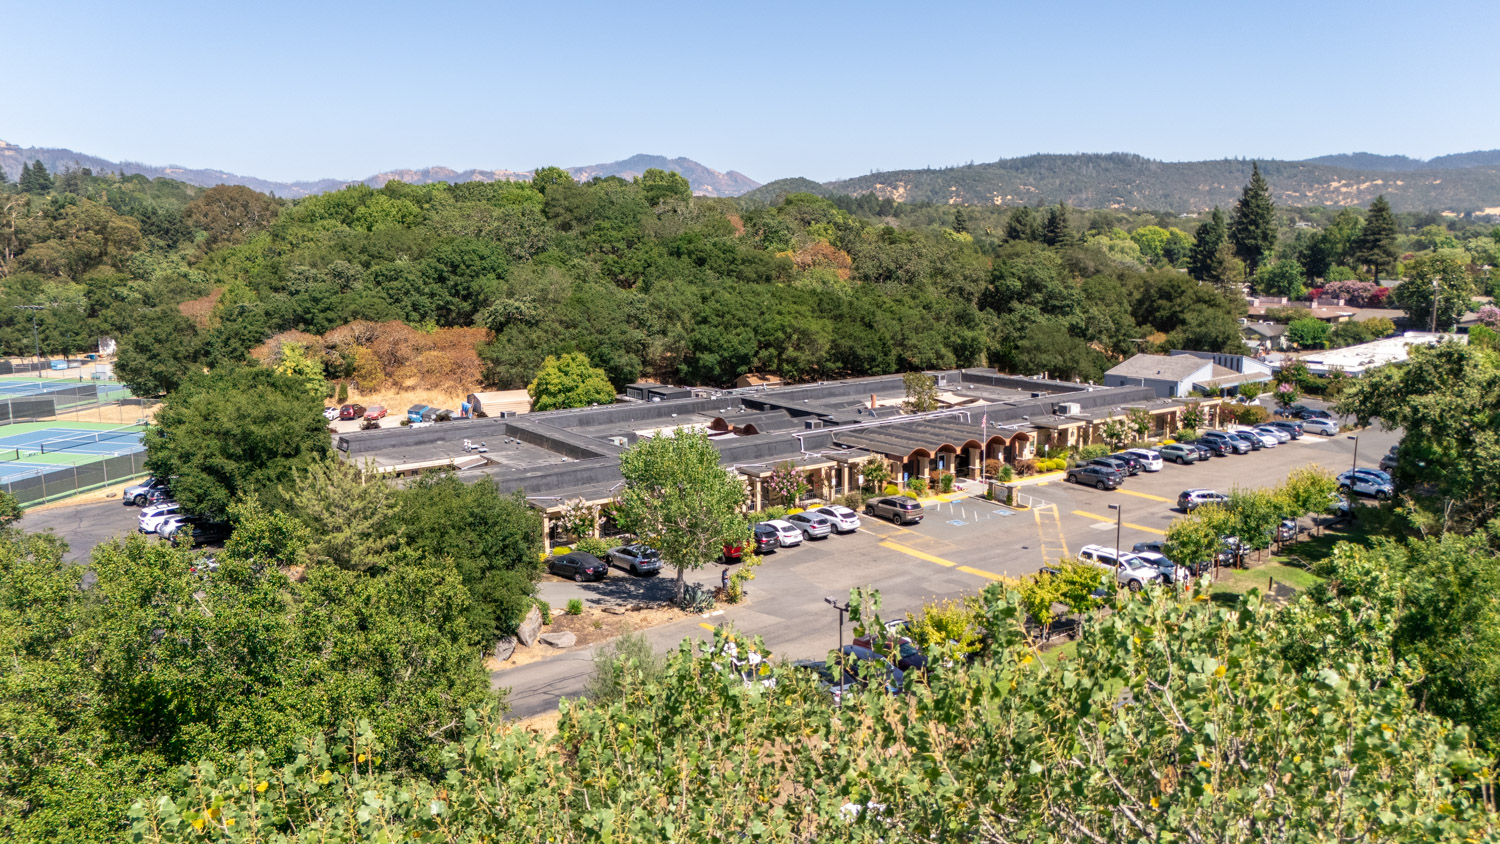
Medicare 42%
Private pay 54%
Medicaid 4%

Places of interest near Park View Post Acute

Address 2.4 miles from city center Info Estimated distance in miles from Santa Rosa's city center to Park View Post Acute's address, calculated via Google Maps.

Calculate Travel Distance to Park View Post Acute

Add your location

Address

Compare Nursing Homes around Santa Rosa

The information below is reported by the California Department of Social Services and Department of Public Health.

4 facilities compared · CMS & CA Dept. of Health data

Summerfield Healthcare Center
NH
Santa Rosa
70
Facility 70
CA AVG 103
Rank #1001 / 1657
86.6%
Facility 86.6%
CA AVG 84.7%
Rank #421 / 1537
+2%
3.98
Facility 3.98
CA AVG 4.22
Rank #184 / 354
+29%-6%
$3.1k
Facility $3.1k
CA AVG $56.5k
Rank #210 / 362
-
21
Facility 21
CA AVG 50.2
Rank #47 / 361
3.0
Facility 3.0
CA AVG 4.6
Rank #65 / 361
-53A
49
Facility 49
CA AVG 57
Rank #1370 / 2092
Cason Bush
$14.4M
Facility $14.4M
CA AVG $17.0M
Rank #287 / 355
$7.4M
Facility $7.4M
CA AVG $7.0M
Rank #210 / 355
51.2%
Facility 51.2%
CA AVG 45.2%
Rank #10 / 355
56364
Arbol Residences in Santa Rosa
NH
MC
Santa Rosa
110
Facility 110
CA AVG 103
Rank #642 / 1657
90.0%
Facility 90.0%
CA AVG 84.7%
Rank #321 / 1537
+6%
5.99
Facility 5.99
CA AVG 4.22
Rank #13 / 354
+77%+42%
$0
Facility $0
CA AVG $56.5k
Rank #1 / 362
90
Facility 90
CA AVG 81
Rank #398 / 1401
37
Facility 37
CA AVG 50.2
Rank #155 / 361
4.1
Facility 4.1
CA AVG 4.6
Rank #180 / 361
-99A
38
Facility 38
CA AVG 57
Rank #1584 / 2092
2019 Sjb Family Trust
$15.6M
Facility $15.6M
CA AVG $17.0M
Rank #169 / 355
$8.5M
Facility $8.5M
CA AVG $7.0M
Rank #143 / 355
54.4%
Facility 54.4%
CA AVG 45.2%
Rank #124 / 355
555836
Park View Post Acute
NH
Santa Rosa
116
Facility 116
CA AVG 103
Rank #608 / 1657
94.8%
Facility 94.8%
CA AVG 84.7%
Rank #202 / 1537
+12%
4.07
Facility 4.07
CA AVG 4.22
Rank #160 / 354
+16%-3%
$14.4k
Facility $14.4k
CA AVG $56.5k
Rank #259 / 362
-
54
Facility 54
CA AVG 50.2
Rank #248 / 361
4.9
Facility 4.9
CA AVG 4.6
Rank #240 / 361
1107C
32
Facility 32
CA AVG 57
Rank #1693 / 2092
-
$23.4M
Facility $23.4M
CA AVG $17.0M
Rank #137 / 355
$13.4M
Facility $13.4M
CA AVG $7.0M
Rank #41 / 355
57.4%
Facility 57.4%
CA AVG 45.2%
Rank #32 / 355
56411
Santa Rosa Post-Acute
NH
HC
RC
Santa Rosa
99
Facility 99
CA AVG 103
Rank #725 / 1657
95.0%
Facility 95.0%
CA AVG 84.7%
Rank #193 / 1537
+12%
4.15
Facility 4.15
CA AVG 4.22
Rank #138 / 354
+92%-2%
$10.2k
Facility $10.2k
CA AVG $56.5k
Rank #243 / 362
-
67
Facility 67
CA AVG 50.2
Rank #293 / 361
2.0
Facility 2.0
CA AVG 4.6
Rank #8 / 361
395-
45
Facility 45
CA AVG 57
Rank #1474 / 2092
Kevan Bills
$18.1M
Facility $18.1M
CA AVG $17.0M
Rank #45 / 355
$9.0M
Facility $9.0M
CA AVG $7.0M
Rank #149 / 355
49.7%
Facility 49.7%
CA AVG 45.2%
Rank #346 / 355
55854

Financial Assistance for
Nursing Home in California

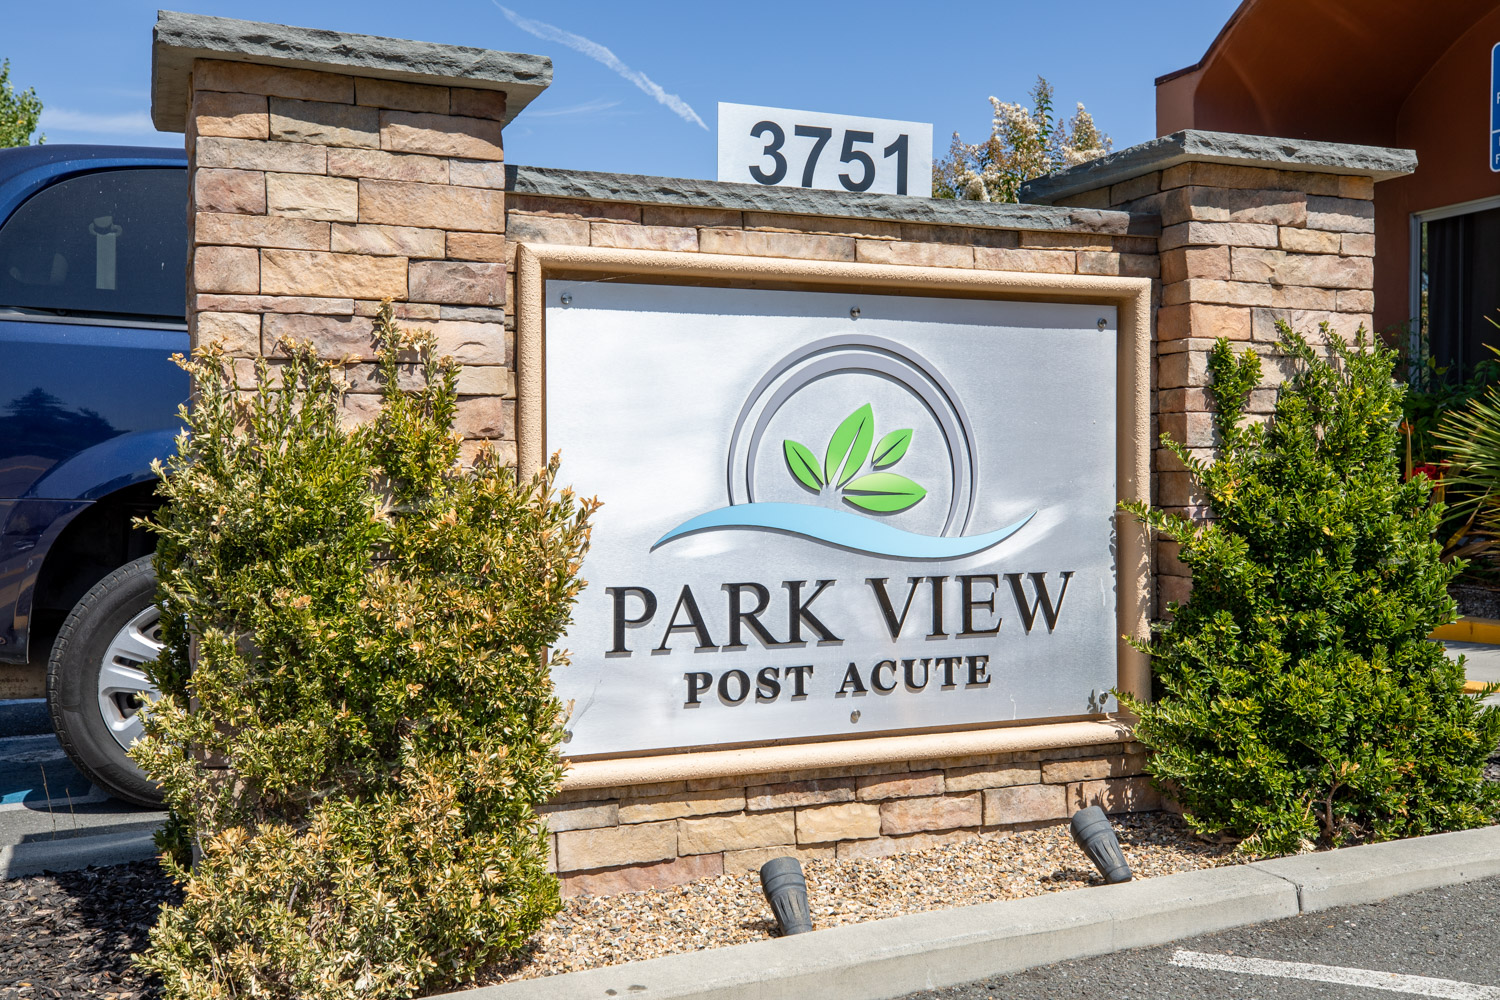
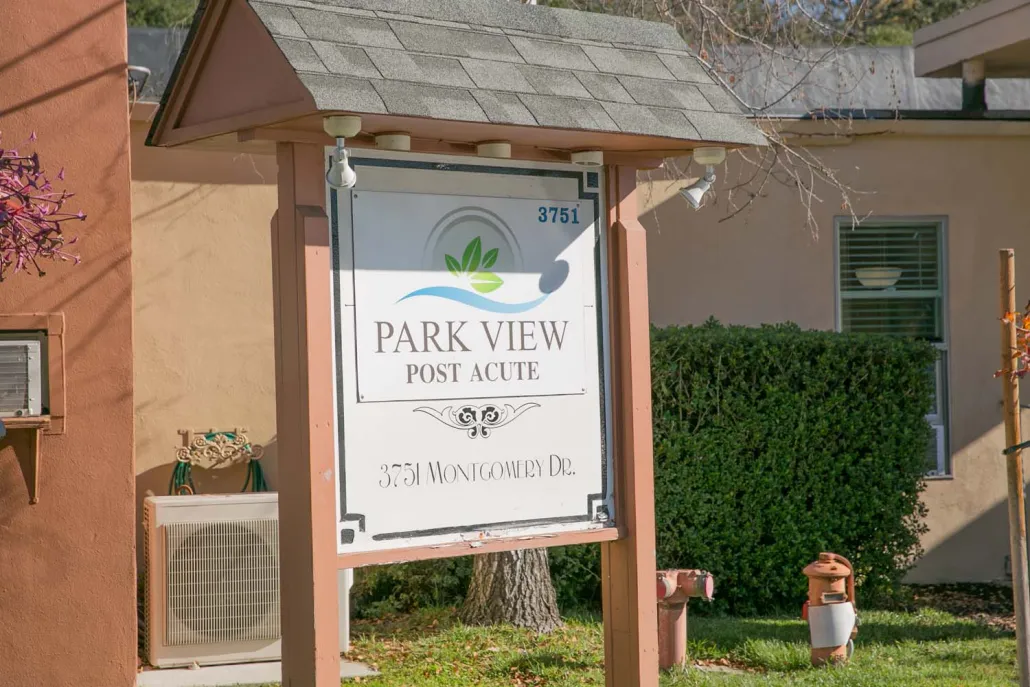
Park View Post Acute is located in Santa Rosa, California.
Here are the financial assistance programs available to residents in California.

Get Financial aid guidance

Multipurpose Senior Services Program

MSSP (Medi-Cal Waiver)

Age 65+
General California resident, Medi-Cal eligible, nursing home risk.
Income Limits (2025) ~$2,829/month 300% FBR, individual
Asset Limits $2,000 (individual), $3,000 (couple).
CA

County-managed; waitlists possible.

Benefits
In-home support (4-6 hours/day) Respite care (14 days/year) Meals (~$6/meal) Transportation (8 trips/month) Care management

In-Home Supportive Services (IHSS)

California IHSS

Age 65+
General California resident, Medicaid-eligible or low-income.
Income Limits ~$1,732/month individual, Medi-Cal threshold
Asset Limits $2,000 individual
CA

Can hire family as caregivers.

Benefits
Personal care (up to 283 hours/month) Homemaker services Respite (varies)

Multipurpose Senior Services Program (MSSP)

CA MSSP

Age 65+
General California resident, Medi-Cal-eligible, nursing home-eligible but community-capable.
Income Limits ~$2,829/month 300% FBR, individual
Asset Limits $2,000 individual
CA

Available in 38 counties; waitlists common.

Benefits
Case management Respite care (up to 10 days/year) Minor home mods (avg. $500) Adult day care (~$50/day)

Property Tax Postponement Program (PTP)

CA PTP

Age 62+
General California resident, own and live in home, 40% equity.
Income Limits (2025) ~$51,500/year household, adjusted annually
Asset Limits Equity-based; no strict asset cap.
CA

Deferred taxes accrue interest (5% as of 2024); repaid upon sale/death.

Benefits
Property tax deferral (avg. $1,000-$3,000/year, varies by county)

Assisted Living Waiver (ALW)

CA ALW

Age 65+ or disabled
General California resident, Medi-Cal-eligible, nursing home-eligible.
Income Limits ~$2,829/month 300% FBR, individual
Asset Limits $2,000 individual
CA

Available in 15 counties (e.g., LA, Sacramento); waitlists common.

Benefits
Personal care in ALFs (5-7 hours/day) Medication management Social services

California CARES Program

CA CARES

Age
General Caregivers of California residents 60+ needing help with 3+ daily activities; no caregiver age limit.
Income Limits No strict limit; cost-sharing above ~$2,500/month threshold.
Asset Limits Not applicable; need-based.
CA

High demand in urban areas; complements IHSS respite.

Benefits
Respite care (up to 10 days/year) Counseling (4-6 sessions/year) Training (2-3 workshops/year) Supplies (~$200/year)

Frequently Asked Questions about Park View Post Acute

Is Park View Post Acute in a walkable area?

Park View Post Acute has a walk score of 32. Somewhat walkable. A few nearby services may be reachable on foot, but most trips require transportation.

What is the occupancy rate at Park View Post Acute?

Park View Post Acute's occupancy is 94.8%.

Does Park View Post Acute operate as a for-profit or non-profit?

Park View Post Acute is registered as a for-profit in CA.

Are there photos of Park View Post Acute?

Yes — there are 31 photos of Park View Post Acute in the photo gallery on this page.

What is the address of Park View Post Acute?

Park View Post Acute is located at 3751 Montgomery Dr, Santa Rosa, CA 95405.

What is the phone number of Park View Post Acute?

(707) 525-1250 will put you in contact with the team at Park View Post Acute.

Is Park View Post Acute Medicare or Medicaid certified?

Yes — Park View Post Acute is a CMS-certified provider of Medicare and Medicaid.

Guides for Better Senior Living

Care Cost Calculator: See Prices in Your Area

Nursing Home Data Explorer

Don’t Wait Too Long: 7 Red Flag Signs Your Parent Needs Assisted Living Now

The True Cost of Assisted Living in 2025 – And How Families Are Paying For It

Understanding Senior Living Costs: Pricing Models, Discounts & Financial Assistance