Summerfield Healthcare Center
Nursing Home & Skilled Nursing · Santa Rosa, CA
CMS overall rating Info The Overall CMS Rating is scored from 1 to 5 stars and combines results from health inspections, staffing levels, and quality measures. Health inspections carry the most weight. Staffing and quality scores can increase or decrease the final rating based on performance compared to state and national standards.

Summerfield Healthcare Center

Nursing Home & Skilled Nursing · Santa Rosa, CA
CMS overall rating Info The Overall CMS Rating is scored from 1 to 5 stars and combines results from health inspections, staffing levels, and quality measures. Health inspections carry the most weight. Staffing and quality scores can increase or decrease the final rating based on performance compared to state and national standards.
Calculator: See prices in your area
Summerfield Healthcare Center accepts Medicare and private pay.

Overview of Summerfield Healthcare Center

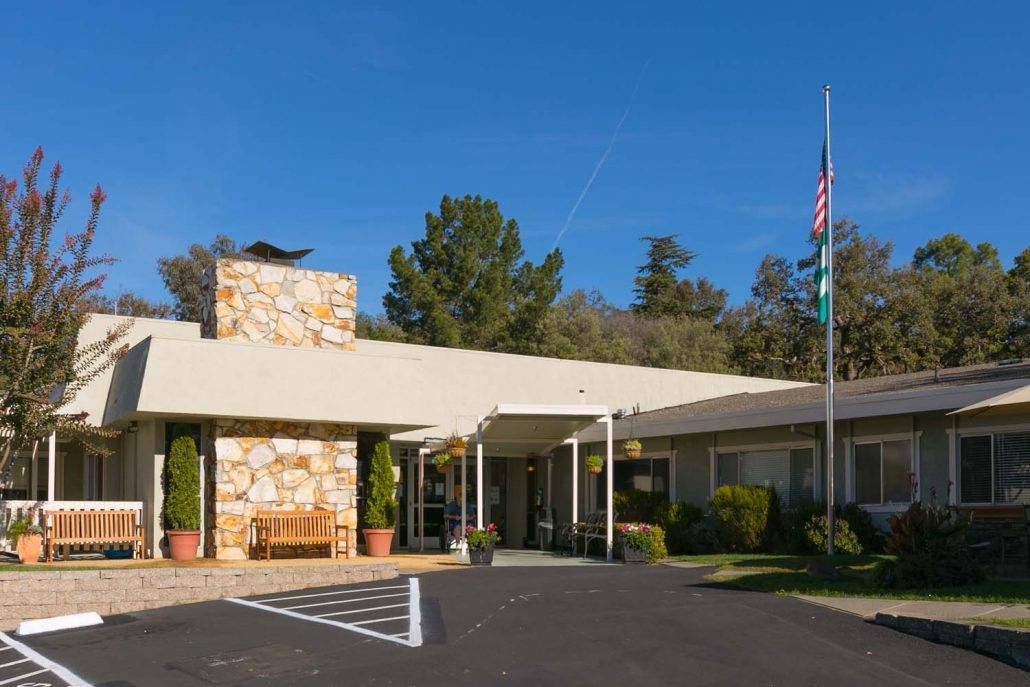
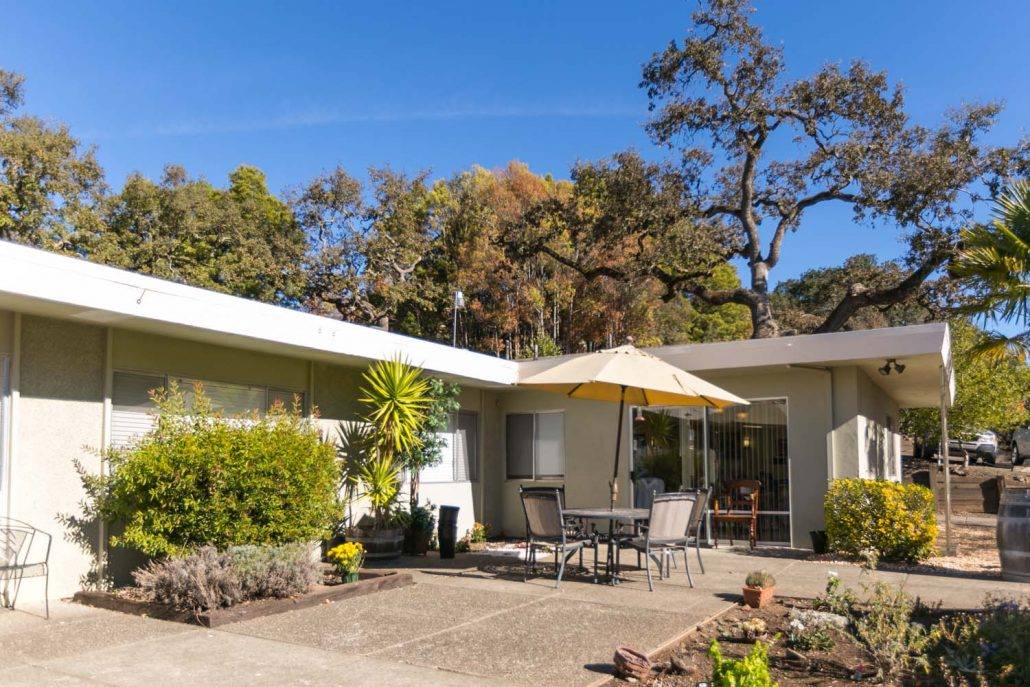
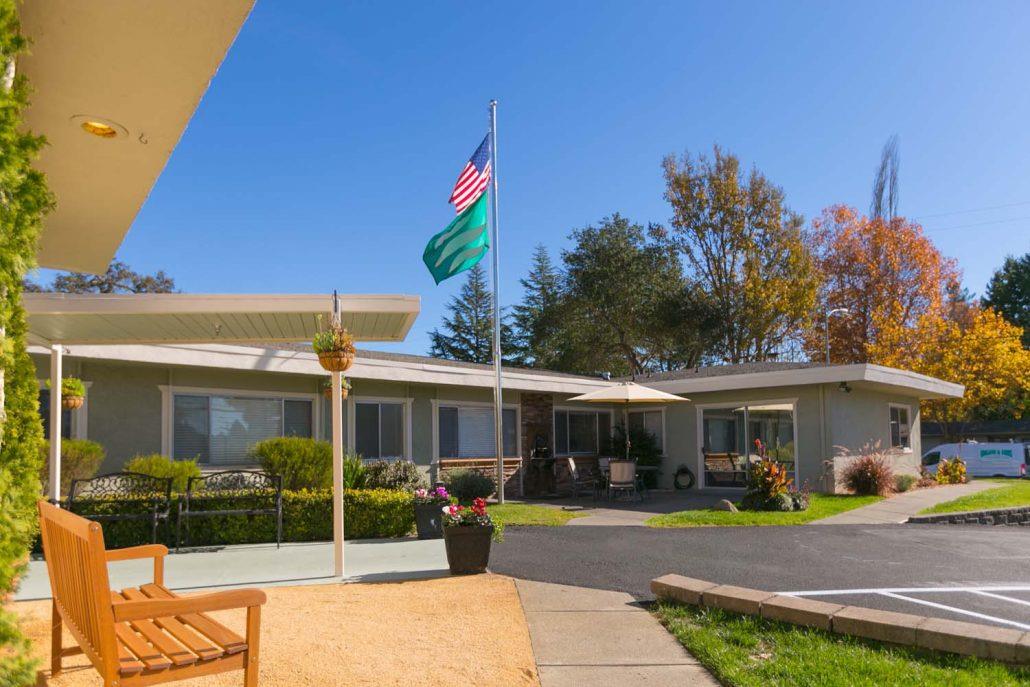
Situated in Santa Rosa, California, Summerfield Healthcare Center stands out as a cutting-edge nursing home with top-tier ratings, thanks to its state-of-the-art facilities featuring high-tech, innovative technology, and hands-on therapeutic approaches. The services provided go beyond enhancing the physical well-being of residents, extending to creating a welcoming home environment. The facility boasts meticulously designed outdoor spaces and comfortable rooms adorned with beautiful artworks, adding a distinct personality to the surroundings.

Residents benefit from a high caliber of service delivered by an interdisciplinary care team. This vibrant and colorful community not only encourages an active lifestyle but also exudes a classic charm, providing seniors an ideal place to recuperate and enjoy fulfilling golden years. With a focus on nursing home care and qualifications, Summerfield Healthcare Center is dedicated to creating a supportive and enriching senior living experience that aligns seamlessly with the diverse needs of its residents.

(707) 539-1515

Quality ratings

Measured by Centers for Medicare & Medicaid Services (CMS)

Overall rating Info The Overall CMS Rating combines results from health inspections, staffing levels and quality measures. Health inspections carry the most weight. Staffing and quality scores can increase or decrease the final rating based on performance compared to state and national standards.
▲ 38.9% Above CA avg. ▲ 38.9% Above CA avg.Click the badge to see the full State ranking.Click here to see the full State ranking.
Health Inspection Info Based on the results of the facility's three most recent standard inspections and any complaint investigations. CMS reviews the number, scope, and severity of deficiencies, with more recent findings weighted more heavily.
▲ 27.0% Above CA avg. ▲ 27.0% Above CA avg.Click the badge to see the full State ranking.Click here to see the full State ranking.
Staffing Info Measures average nursing staff hours per resident per day, including Registered Nurses (RNs) and total nursing staff. Ratings are adjusted based on the level of care residents require and are compared to state and national benchmarks.
▲ 15.9% Above CA avg. ▲ 15.9% Above CA avg.Click the badge to see the full State ranking.Click here to see the full State ranking.
Quality Measures Info Based on clinical and physical health indicators reported to CMS, such as hospital readmissions, falls, pressure ulcers, and improvements in mobility. These measures reflect how well residents' health needs are being managed.
▲ 17.4% Above CA avg. ▲ 17.4% Above CA avg.Click the badge to see the full State ranking.Click here to see the full State ranking.

Staffing hours breakdown

Info Daily nursing hours per resident by staff type, reported to CMS. Higher is generally better — compare this facility to state and national averages to see where staffing stands.

Hours per resident per day — compared to California state averages

Total nursing care / resident Info This home is ranked 181st out of 346 homes in California. Total adjusted nursing hours per resident per day, combining RN, LPN, and aide time. CMS adjusts this for case-mix so facilities can be fairly compared.
3h 59m per day
Rank #181 / 346Nurse hours — State benchmarkedThis home is ranked 181st out of 346 homes in California. Shows adjusted nurse hours per resident per day benchmarked to the California average, with a ranking across 346 California SNFs. More hours mean more direct care. The national average is about 3.5 hrs; below 3.0 is a red flag.Click the rank badge to see the full State ranking.Click here to see the full State ranking.
This facility California avg (4h 23m per day)
vs California avg
-9%

2 of 6 metrics below state avg

Standout metric Physical Therapist is +360% above state avg
Staff type Hours / Day / Resident vs state avg
Registered Nurse (RN) Info RNs hold the highest nursing license and can assess residents, interpret test results, and direct care plans. More RN hours per day often signals stronger clinical oversight and faster response to health changes. 1h 5m per day ▲ 67% State avg: 39m per day · National avg: 41m per day
LPN / LVN Info Licensed Practical Nurses (LPNs) or Licensed Vocational Nurses (LVNs) deliver routine hands-on care — medication administration, wound dressing, and monitoring vital signs. They work under RN supervision and make up a large share of daily bedside care. 50m per day ▼ 32% State avg: 1h 13m per day · National avg: 52m per day
Nurse Aide Info Certified Nurse Aides (CNAs) provide the most direct day-to-day assistance: bathing, dressing, feeding, and mobility. Nurse aide hours are typically the largest staffing category and directly affect residents' quality of life. 2h 41m per day ■ Avg State avg: 2h 39m per day · National avg: 2h 21m per day
Weekend Total Nursing Info Combined nursing hours (RN + LPN + Nurse Aide) per resident per day on weekends. Staffing often drops on weekends — this figure reveals whether the facility maintains adequate coverage outside of weekday hours. 3h 50m per day ▼ 6% State avg: 4h 5m per day · National avg: 3h 26m per day
Physical Therapist Info Hours per resident per day provided by licensed Physical Therapists (PTs) or PT Assistants. PT services help residents recover mobility after injury or illness and are especially important for post-acute (short-stay) rehabilitation. 23m per day ▲ 360% State avg: 5m per day · National avg: 4m per day
Weekend RN Info Registered nurse hours specifically on weekends. Facilities sometimes reduce RN presence on Saturdays and Sundays — a low weekend RN figure compared to weekday hours can indicate reduced clinical oversight when most administrative staff are absent. 45m per day ▲ 50% State avg: 30m per day · National avg: 29m per day

Types of Care at Summerfield Healthcare Center

Skilled Nursing

Capacity and availability

This home usually has limited availability

Occupancy between 85% and 95% suggests balanced demand.

Higher occupancy than the California average: 84.7%
Occupancy rate 86.6% Rank #409 / 1407Occupancy rate — State benchmarkedThis home is ranked 409th out of 1407 homes in California. Shows this facility's occupancy rate versus the California average, with its Statewide rank out of 1407. Higher occupancy signals strong local demand and financial stability.Click the rank badge to see the full State ranking.Click here to see the full State ranking.
Avg. Length of Stay 34 days
Occupancy rate
86.6% Rank #409 / 1407Occupancy rate — State benchmarkedThis home is ranked 409th out of 1407 homes in California. Shows this facility's occupancy rate versus the California average, with its Statewide rank out of 1407. Higher occupancy signals strong local demand and financial stability.Click the rank badge to see the full State ranking.Click here to see the full State ranking.
Avg. Length of Stay
34 days
Walk Score
Walk Score: 49 / 100 Rank #1371 / 2096Walk Score — State benchmarkedThis home is ranked 1371st out of 2096 homes in California. Shows how walkable this facility's neighborhood is compared to the average Walk Score across California SNFs. Higher scores benefit residents, families, and staff.Click the rank badge to see the full State ranking.Click here to see the full State ranking.
Somewhat walkable. A few nearby services may be reachable on foot, but most trips require transportation.
BBB Rating
BBB Rating: A (Not Accredited)
An independent rating from the Better Business Bureau based on factors such as complaint history, transparency, and business practices.
How BBB ratings work

Contact Summerfield Healthcare Center

Inspection History

In California, the Department of Social Services (for assisted living facilities) and the Department of Public Health (for nursing homes) conduct inspections to ensure resident safety and regulatory compliance.

Since 2022 · 4 years of data 20 citations 0 complaint visits

Inspection Scorecard Info This scorecard compares key inspection, citation, and complaint metrics at this facility against the California state average. Metrics rated ≥15% worse than average are highlighted in red; those ≥15% better are highlighted in green.

Since 2022 vs. California state average
Overall vs. CA average 2 Worse Metrics worse than California average:
• Total citations (100% above)
• Citations per year (100% above)
3 Better Metrics better than California average:
• Total visits (100% below)
• Complaint visits (100% below)
• Other visits (100% below)
Latest Inspection September 5, 2025 Routine

Citations Info Citations are formal regulatory issues recorded during state inspections.

This Facility CA Average vs. CA Avg
Total citations Info Formal regulatory issues recorded by inspectors across all inspection types. 20 10 This facility has 100% more total citations than a typical California nursing home (20 vs. CA avg 10).↑ 100% worse
Citations per year Info Average citations per year since 2022. 5 2.5 This facility has 100% more citations per year than a typical California nursing home (5 vs. CA avg 2.5).↑ 100% worse

Inspections & Visits Info State inspections evaluate whether the facility meets health and safety standards.

This Facility CA Average vs. CA Avg
Total visits Info Combined count of complaint visits, other regulatory visits, and official scheduled inspections. 0 16 This facility has 100% fewer total visits than a typical California nursing home (0 vs. CA avg 16).↓ 100% better
Complaint visits Info On-site visits triggered by formal complaints filed by residents, families, or staff. 0 13 This facility has 100% fewer complaint visits than a typical California nursing home (0 vs. CA avg 13).↓ 100% better
Other visits Info Regulatory visits that are neither routine inspections nor complaint investigations — administrative check-ins, follow-up reviews, licensing-related visits. 0 7 This facility has 100% fewer other visits than a typical California nursing home (0 vs. CA avg 7).↓ 100% better

Inspection Reports Summary Info An editor-reviewed summary of the themes and findings across this facility's recent inspection reports.

This facility’s inspection record is mixed, showing repeated issues with medication management, infection control, and resident care documentation. On September 5, 2025, inspectors cited one PPE violation during COVID-19 care, and on March 3, 2025, a complaint investigation substantiated failure to follow physician orders for a wrist brace. Earlier inspections flagged multiple medication errors, improper transfers without consent, and food safety lapses, indicating ongoing challenges despite some corrective efforts.

Read the full inspection reports for this facility, including detailed findings and corrective actions.

Show Inspection Reports

Health Inspection History

Inspections since 2022
Total health inspections 7

California average 12.5


Last Health inspection on Sep 2025

Total health citations
21 Rank #46 / 354Health citations — State benchmarkedThis home is ranked 46th out of 354 homes in California. Shows this facility's total health deficiency citations benchmarked to the California State average, with a ranking across all 354 CA SNFs. Lower citation counts earn a better rank.Click the rank badge to see the full State ranking.Click here to see the full State ranking.

California average 50.2

Citations per inspection
3 Rank #60 / 354Citations per inspection — State benchmarkedThis home is ranked 60th out of 354 homes in California. Shows average deficiency citations per CMS inspection for this facility versus the California mean across 354 SNFs with citation data. Lower is better.Click the rank badge to see the full State ranking.Click here to see the full State ranking.

California average 4.65


Health citations are formal notices following inspections when they fail to comply with safety and care standards.

16 of 21 citations resulted from standard inspections; and 5 of 21 resulted from complaint investigations.

Breakdown of citation severity (last 4 years)
Critical Health citations
0
100% better than California average

California average: 0.4


Serious Health citations
0
100% better than California average

California average: 1

0 critical citations California average: 0.4

0 serious citations California average: 1

21 moderate citations California average: 47.2

0 minor citations California average: 1.5
Citations history (last 4 years)
Infection Control moderate citation Sep 05, 2025
Corrected

Quality of Care moderate citation Mar 03, 2025
Corrected

Resident Rights moderate citation Sep 05, 2024
Corrected

Nutrition moderate citation Mar 15, 2024
Corrected

Staffing Data

Reporting period: October 1 – December 31, 2025 (Q4 2025). Source: CMS Payroll-Based Journal report.

Total staff 104
Employees 103
Contractors 1
Staff to resident ratio 2.00:1
10% better than California average
California average ratio: 1.81:1 California average ratio: 1.81:1See full California ranking
Avg staff/day 45
Average shift 7.5 hours
0% compared with California average
California average: 7.7 hours California average shift: 7.7 hoursSee full California ranking
Total staff hours (quarter) 30,856

Nursing staff breakdown

Q4 2025 · Oct 1 – Dec 31 More info This data comes from the CMS Payroll-Based Journal report covering October 1 – December 31, 2025.
Registered Nurse

Manages medical care and health needs.

RN Staff 12
Average shift length Info Average shift length. Calculated as total hours divided by days worked and average staff per day. 8.2 hours

No contractors work on this role.

Licensed Practical Nurse

Assists with medical care and medications.

LPN Staff 11
Average shift length Info Average shift length. Calculated as total hours divided by days worked and average staff per day. 7.2 hours

No contractors work on this role.

Certified Nursing Assistant

Helps with daily care and mobility.

CNA Staff 38
Average shift length Info Average shift length. Calculated as total hours divided by days worked and average staff per day. 7.3 hours

No contractors work on this role.

Contractor staffing

Q4 2025 · Oct 1 – Dec 31 More info This data comes from the CMS Payroll-Based Journal report covering October 1 – December 31, 2025.

Total hours from contractors

0%

8 contractor hours this quarter

Occupational Therapy Assistant: 1

Staff by category

Q4 2025 · Oct 1 – Dec 31 More info This data comes from the CMS Payroll-Based Journal report covering October 1 – December 31, 2025.
Certified Nursing Assistant 38 0 38 12,783 92 100% 7.3
Registered Nurse 12 0 12 4,835 92 100% 8.2
Licensed Practical Nurse 11 0 11 3,008 92 100% 7.2
Dental Services Staff 5 0 5 2,369 92 100% 7.8
Physical Therapy Assistant 8 0 8 1,884 88 96% 6.8
Respiratory Therapy Technician 7 0 7 1,733 81 88% 6.3
Other Dietary Services Staff 5 0 5 1,169 89 97% 7.5
RN Director of Nursing 2 0 2 756 64 70% 9
Nurse Practitioner 1 0 1 594 66 72% 9
Administrator 1 0 1 528 66 72% 8
Qualified Social Worker 3 0 3 398 56 61% 6.5
Speech Language Pathologist 7 0 7 297 38 41% 6.3
Therapeutic Recreation Specialist 1 0 1 296 42 46% 7.1
Occupational Therapy Aide 2 0 2 198 36 39% 5.5
Occupational Therapy Assistant 0 1 1 8 1 1% 8
38 Certified Nursing Assistant
% of Days 100%
12 Registered Nurse
% of Days 100%
11 Licensed Practical Nurse
% of Days 100%
5 Dental Services Staff
% of Days 100%
8 Physical Therapy Assistant
% of Days 96%
7 Respiratory Therapy Technician
% of Days 88%
5 Other Dietary Services Staff
% of Days 97%
2 RN Director of Nursing
% of Days 70%
1 Nurse Practitioner
% of Days 72%
1 Administrator
% of Days 72%
3 Qualified Social Worker
% of Days 61%
7 Speech Language Pathologist
% of Days 41%
1 Therapeutic Recreation Specialist
% of Days 46%
2 Occupational Therapy Aide
% of Days 39%
1 Occupational Therapy Assistant
% of Days 1%

Penalties and fines

Includes penalties issued in 2023

Federal penalties imposed by CMS for regulatory violations, including civil money penalties (fines) and denials of payment for new Medicare/Medicaid admissions.

Source: CMS Penalties Database (Data as of Jan 2026)

Total fines amount $3K Rank #186 / 354Federal fines — State benchmarkedThis home is ranked 186th out of 354 homes in California. Shows this facility's cumulative CMS federal fine dollars versus the California average among facilities with fines, and where it ranks among 354 skilled nursing facilities in the pool. Lower total dollars mean a better rank.Click the rank badge to see the full State ranking.Click here to see the full State ranking.
94% lower than California average

California average: $55K

Number of fines 1
58% fewer fines than California average

California average: 2.4

Payment Denials Info Serious action where Medicare and/or Medicaid temporarily stops payments for new residents until issues are fixed. 0
100% fewer payment denials than California average

California average: 0.5

Fines amount comparison
This facility $3K
California average $55K
Penalty History

Penalties are imposed by CMS for violations of federal nursing home regulations.

1 penalty in the past 3 years

Aug 7, 2023 · $3K

Civil Money Penalty Info Fines imposed for noncompliance, which can be assessed per day or per instance of violation. Aug 7, 2023
$3K

Last updated: Jan 2026

Quality of care over time

These measures show how residents usually do over time at this home, based on health outcomes and preventive care.

High-risk clinical events score Info A composite score based on pressure ulcers, falls with injury, weight loss, walking ability decline, and activities of daily living decline. 2.8
58% better than California average

California average: 6.6

Functional decline score Info A composite score based on activities of daily living decline, walking ability decline, and incontinence. 13.3
17% worse than California average

California average: 11.3

Long-stay resident measures
Significantly above average California avg: 4.2 Info CMS star rating based on long-stay quality measure performance. 5 stars = significantly above average, 1 star = significantly below average.
Need for Help with Daily Activities Increased Info Percent of long-stay residents whose need for help with daily activities has increased 9.1%
18% better than California average

California average: 11.1%

Low Risk Residents with Bowel/Bladder Incontinence Info Percent of low risk long-stay residents who lose control of their bowels or bladder 17.4%
54% worse than California average

California average: 11.3%

Falls with Major Injury Info Percent of long-stay residents experiencing one or more falls with major injury 2.0%
23% worse than California average

California average: 1.7%

High Risk Residents with Pressure Ulcers Info Percent of long-stay high risk residents with pressure ulcers 0.0%
100% better than California average

California average: 5.0%

Urinary Tract Infection Info Percent of long-stay residents with a urinary tract infection 0.0%
100% better than California average

California average: 1.2%

Lost Too Much Weight Info Percent of long-stay residents who lose too much weight 0.0%
100% better than California average

California average: 4.2%

Depressive Symptoms Info Percent of long-stay residents who have depressive symptoms 2.1%
68% better than California average

California average: 6.7%

Antipsychotic Use Info Percent of long-stay residents who received an antipsychotic medication 17.8%
76% worse than California average

California average: 10.1%

Pneumococcal Vaccine Info Percent of long-stay residents assessed and appropriately given the pneumococcal vaccine 98.0%
In line with California average

California average: 98.5%

Short-stay resident measures
Significantly above average California avg: 3.5 Info CMS star rating based on short-stay quality measure performance. 5 stars = much above average, 1 star = much below average.
Pneumococcal Vaccine Info Percent of short-stay residents assessed and appropriately given the pneumococcal vaccine 97.6%
In line with California average

California average: 94.0%

Antipsychotic medication increase Info Percent of short-stay residents who newly received an antipsychotic medication 1.6%
12% worse than California average

California average: 1.5%

Influenza Vaccine Info Percent of short-stay residents assessed and appropriately given the seasonal influenza vaccine 95.4%
In line with California average

California average: 93.2%

Re-hospitalized after SNF stay Info Percentage of short-stay residents who were re-hospitalized after their nursing home admission. 20.8%
10% better than California average

California average: 23.2%

Emergency department visits Info Percentage of short-stay residents who had an outpatient emergency department visit. 13.2%
18% worse than California average

California average: 11.2%

Falls with major injury Info Percentage of SNF residents who experience falls with major injury during their stay. 0.2%
73% better than California average

California average: 0.8%

Ability to care for self at discharge Info Percentage of residents at or above expected ability to care for themselves at discharge. 65.2%
21% better than California average

California average: 53.7%

Successful return to home or community Info Rate of successful return to home or community from a skilled nursing facility. 67.7%
34% better than California average

California average: 50.6%

Breakdown by payment type

Medicare

80% of new residents, usually for short-term rehab.

Typical stay 21 days

Private pay

20% of new residents, often for short stays.

Typical stay 23 days

Facility Characteristics

Source: CMS Long-Term Care Facility Characteristics (Data as of Jan 2026)

Total residents 52
Medicare
36
69.2% of residents
Medicaid
14
26.9% of residents
Private pay or other
2
3.8% of residents
Programs & Services
Residents Group

Residents meet regularly to discuss policies, care quality, and activities

Active Resident Council

Organized group of residents that meets regularly to discuss facility policies, quality of life, and activities.

Finances and operations

Privately-owned community
Operated by a business corporation.
Home revenue
$9.9M
Profit
$3.4M
Privately-owned community Operated by a business corporation.
Home revenue
$9.9M Rank #283 / 347Revenue — State benchmarkedThis home is ranked 283rd out of 347 homes in California. Shows this facility's annual revenue compared to the California SNF average. Higher revenue generally means more resources for staffing and capital — read alongside Payroll %.Click the rank badge to see the full State ranking.Click here to see the full State ranking.
Profit
$3.4M
Payroll costs Info The portion of the home's budget spent on staff, including nurses, caregivers, and other employees who support care and operations. Rank #208 / 347Payroll — State benchmarkedThis home is ranked 208th out of 347 homes in California. Shows total annual staff payroll benchmarked to the California average. Higher payroll investment relative to peers often signals better staffing and less reliance on cheaper contract labor.Click the rank badge to see the full State ranking.Click here to see the full State ranking.
$7.6M
77% of revenue Rank #10 / 347Payroll % — State benchmarkedThis home is ranked 10th out of 347 homes in California. Shows payroll as a percentage of revenue versus the California average. Well-run California SNFs typically land around 56–67% — the top third Statewide. Below 25% may signal understaffing or heavy agency use — read with Staffing ratings.Click the rank badge to see the full State ranking.Click here to see the full State ranking.
Other operating costs Info All remaining costs needed to run the home, such as food, utilities, building maintenance, supplies and administrative expenses.
-$1.1M
Total costs $6.6M

Who this home usually serves

TYPE OF STAY

Mostly short-term rehab stays

Most residents typically stay for a few weeks or months before returning home or moving on.

Places of interest near Summerfield Healthcare Center

Address 3.2 miles from city center Info Estimated distance in miles from Santa Rosa's city center to Summerfield Healthcare Center's address, calculated via Google Maps. — 0.21 miles to nearest hospital (Rheumatology: Sutter Pacific Medical Foundation: 4725A Hoen Ave)

Calculate Travel Distance to Summerfield Healthcare Center

Add your location

Address

Financial Assistance for
Nursing Home in California

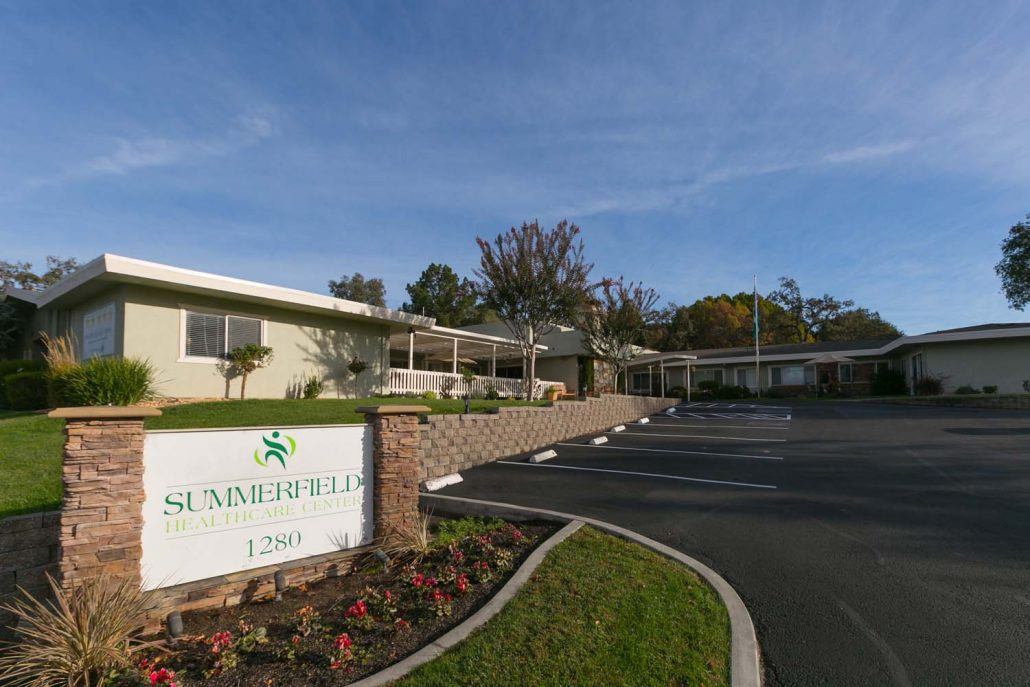
Summerfield Healthcare Center is located in Santa Rosa, California.
Here are the financial assistance programs available to residents in California.

Get Financial aid guidance

Multipurpose Senior Services Program

MSSP (Medi-Cal Waiver)

Age 65+
General California resident, Medi-Cal eligible, nursing home risk.
Income Limits (2025) ~$2,829/month 300% FBR, individual
Asset Limits $2,000 (individual), $3,000 (couple).
CA

County-managed; waitlists possible.

Benefits
In-home support (4-6 hours/day) Respite care (14 days/year) Meals (~$6/meal) Transportation (8 trips/month) Care management

In-Home Supportive Services (IHSS)

California IHSS

Age 65+
General California resident, Medicaid-eligible or low-income.
Income Limits ~$1,732/month individual, Medi-Cal threshold
Asset Limits $2,000 individual
CA

Can hire family as caregivers.

Benefits
Personal care (up to 283 hours/month) Homemaker services Respite (varies)

Multipurpose Senior Services Program (MSSP)

CA MSSP

Age 65+
General California resident, Medi-Cal-eligible, nursing home-eligible but community-capable.
Income Limits ~$2,829/month 300% FBR, individual
Asset Limits $2,000 individual
CA

Available in 38 counties; waitlists common.

Benefits
Case management Respite care (up to 10 days/year) Minor home mods (avg. $500) Adult day care (~$50/day)

Property Tax Postponement Program (PTP)

CA PTP

Age 62+
General California resident, own and live in home, 40% equity.
Income Limits (2025) ~$51,500/year household, adjusted annually
Asset Limits Equity-based; no strict asset cap.
CA

Deferred taxes accrue interest (5% as of 2024); repaid upon sale/death.

Benefits
Property tax deferral (avg. $1,000-$3,000/year, varies by county)

Assisted Living Waiver (ALW)

CA ALW

Age 65+ or disabled
General California resident, Medi-Cal-eligible, nursing home-eligible.
Income Limits ~$2,829/month 300% FBR, individual
Asset Limits $2,000 individual
CA

Available in 15 counties (e.g., LA, Sacramento); waitlists common.

Benefits
Personal care in ALFs (5-7 hours/day) Medication management Social services

California CARES Program

CA CARES

Age
General Caregivers of California residents 60+ needing help with 3+ daily activities; no caregiver age limit.
Income Limits No strict limit; cost-sharing above ~$2,500/month threshold.
Asset Limits Not applicable; need-based.
CA

High demand in urban areas; complements IHSS respite.

Benefits
Respite care (up to 10 days/year) Counseling (4-6 sessions/year) Training (2-3 workshops/year) Supplies (~$200/year)

Compare Nursing Home around Santa Rosa

The information below is reported by the California Department of Social Services and Department of Public Health.

4 facilities compared · CMS & CA Dept. of Health data

Filter by care type
Summerfield Healthcare Center
NH

Nursing Home Licensed facility providing 24/7 skilled nursing care for residents with complex, ongoing medical needs. Staffed by RNs, LPNs, and CNAs. Inspected and star-rated annually by CMS. Accepts Medicare (short-term rehab) and Medicaid (long-term care).

Santa Rosa 56 86.6% +2% 3.98 +29% -6% $3.1k 21 3.0 - 50 A 49 Cason Bush $9.9M $7.6M 77% 56364
Santa Rosa Post-Acute
NH

Nursing Home Licensed facility providing 24/7 skilled nursing care for residents with complex, ongoing medical needs. Staffed by RNs, LPNs, and CNAs. Inspected and star-rated annually by CMS. Accepts Medicare (short-term rehab) and Medicaid (long-term care).

HC

Home Care Professional care delivered in the person's own home — from companionship and errands to skilled nursing and therapy. Allows seniors to age in place. Medicare covers skilled home health when medically necessary.

RC

Respite Care Short-term temporary care — days to weeks — to give family caregivers a break. Full care provided during the stay. Often used after hospitalization or to trial a facility before a permanent placement decision.

Santa Rosa 99 95.0% +12% 4.15 +92% -2% $10.2k 67 2.0 3 96 - 45 Kevan Bills $32.5M $9.2M 28.4% 55854
Park View Post Acute
NH

Nursing Home Licensed facility providing 24/7 skilled nursing care for residents with complex, ongoing medical needs. Staffed by RNs, LPNs, and CNAs. Inspected and star-rated annually by CMS. Accepts Medicare (short-term rehab) and Medicaid (long-term care).

Santa Rosa 116 94.8% +12% 4.07 +16% -3% $0 54 4.9 1 109 C 32 - $20.3M $13.8M 68.1% 56411
Arbol Residences in Santa Rosa
NH

Nursing Home Licensed facility providing 24/7 skilled nursing care for residents with complex, ongoing medical needs. Staffed by RNs, LPNs, and CNAs. Inspected and star-rated annually by CMS. Accepts Medicare (short-term rehab) and Medicaid (long-term care).

AL

Assisted Living A licensed, long-term care setting for seniors or individuals with disabilities who need help with daily activities — like bathing, dressing, and medication management — but not 24-hour skilled nursing. Offers housing, meals, and around-the-clock support while aiming to maximize resident independence.

MC

Memory Care Secured, specialized care for people living with Alzheimer's or dementia. Staff trained in cognitive impairment, with higher staff-to-resident ratios and an environment designed to reduce confusion and wandering risk.

Santa Rosa 110 90.0% +6% 5.99 +77% +42% $0 37 4.1 - 25 A 38 2019 Sjb Family Trust $17.1M $9.3M 54.5% 555836

Frequently Asked Questions about Summerfield Healthcare Center

Is Summerfield Healthcare Center in a walkable area?

Summerfield Healthcare Center has a walk score of 49. Somewhat walkable. A few nearby services may be reachable on foot, but most trips require transportation.

What is the phone number of Summerfield Healthcare Center?

(707) 539-1515 will put you in contact with the team at Summerfield Healthcare Center.

Is Summerfield Healthcare Center Medicare or Medicaid certified?

Yes — Summerfield Healthcare Center is a CMS-certified provider of Medicare and Medicaid.

Guides for Better Senior Living

Care Cost Calculator: See Prices in Your Area

Nursing Home Data Explorer

Don’t Wait Too Long: 7 Red Flag Signs Your Parent Needs Assisted Living Now

The True Cost of Assisted Living in 2025 – And How Families Are Paying For It

Understanding Senior Living Costs: Pricing Models, Discounts & Financial Assistance

Explore Open Rooms
1 Contact details
2 What type of senior care service are you looking for?
3 What budget do you have in mind for senior care?
4 How soon do you need to find care?
5 Additional details

Thank you for your interest!

Our team will be in touch shortly to help with next steps.