Park View Villas
Nursing Home & Independent Living · Stone Mountain, GA
CMS overall rating Info CMS (the Centers for Medicare & Medicaid Services) is the federal agency that rates nursing home quality. Its Overall Rating runs from 1 to 5 stars, combining health inspections, staffing, and quality measures, with inspections weighted most heavily.

Park View Villas

Nursing Home & Independent Living · Stone Mountain, GA
CMS overall rating Info CMS (the Centers for Medicare & Medicaid Services) is the federal agency that rates nursing home quality. Its Overall Rating runs from 1 to 5 stars, combining health inspections, staffing, and quality measures, with inspections weighted most heavily.
Calculator: See prices in your area
Park View Villas accepts Medicare and private pay.

Overview of Park View Villas

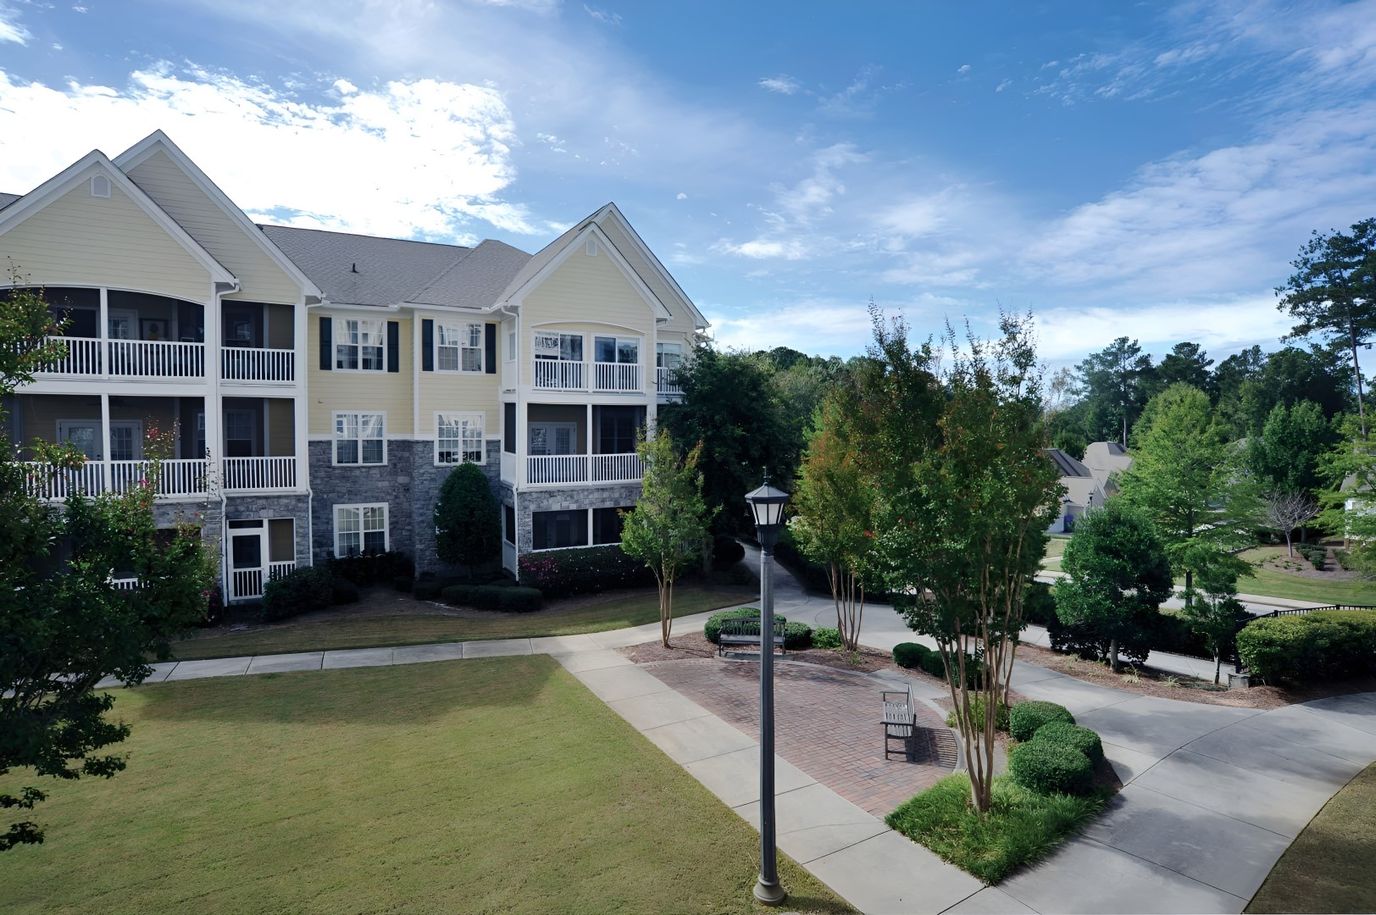
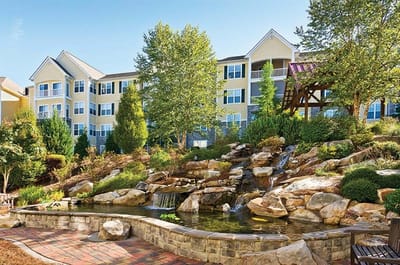
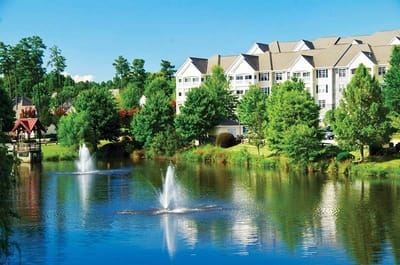
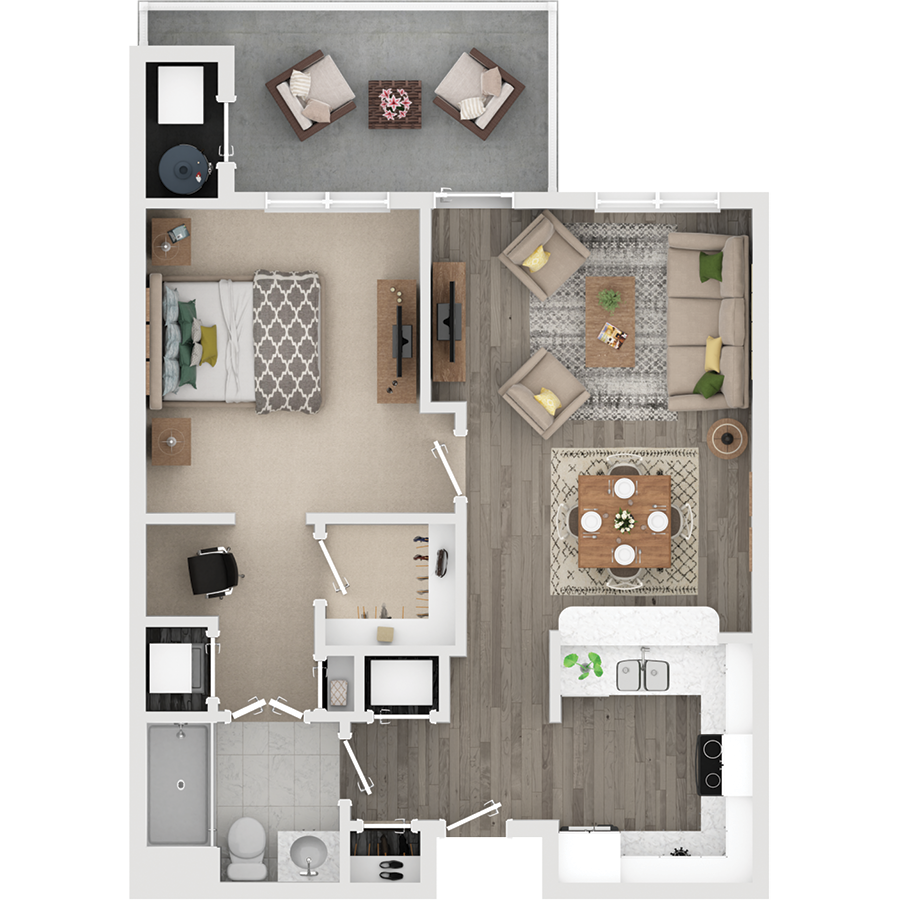
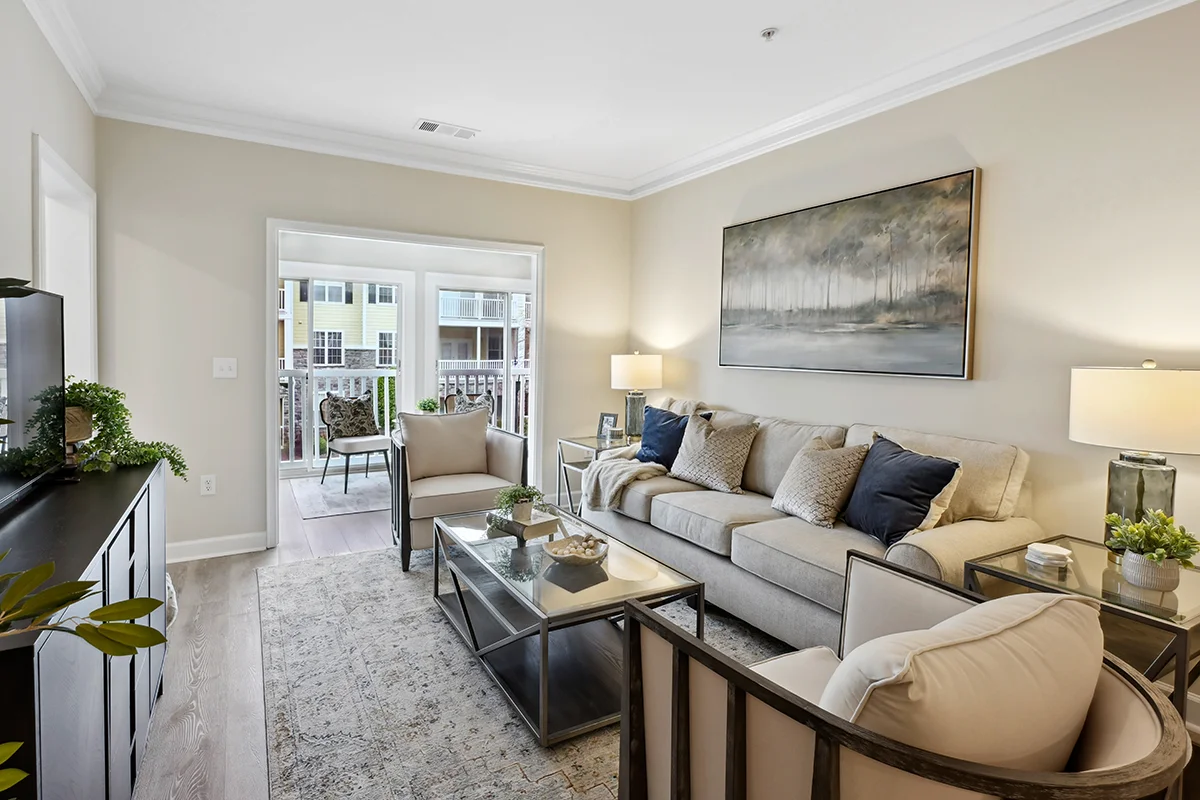
Peacefully nestled near serene green spaces in Stone Mountain, GA, Park View Villas is a distinct community that offers independent living. The community has cozy and purposely built one- and two-bedroom floor plans, ensuring residents are comfortable and safe. Residents have a hassle-free living with maintenance services and convenient apartment features.

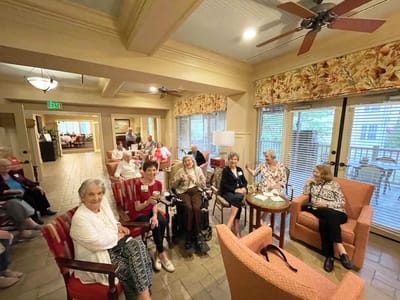
Residents can spend their days as they please with a variety of local amenities and leisure sites nearby. The community also encourages residents to join monthly lunches to promote social interactions over delightful meals. Residents can live actively in retirement amidst the community’s vibrant and friendly setting.

Quality ratings

Measured by Centers for Medicare & Medicaid Services (CMS)

Overall rating Info The Overall CMS Rating combines results from health inspections, staffing levels and quality measures. Health inspections carry the most weight. Staffing and quality scores can increase or decrease the final rating based on performance compared to state and national standards.
▲ 15.4% Above GA avg. ▲ 15.4% Above GA avg.GA average: 2.6Click the badge to see the full State ranking.Click here to see the full State ranking.
Health Inspection Info Based on the results of the facility's three most recent standard inspections and any complaint investigations. CMS reviews the number, scope, and severity of deficiencies, with more recent findings weighted more heavily.
▲ 7.4% Above GA avg. ▲ 7.4% Above GA avg.GA average: 2.8Click the badge to see the full State ranking.Click here to see the full State ranking.
Staffing Info Measures average nursing staff hours per resident per day, including Registered Nurses (RNs) and total nursing staff. Ratings are adjusted based on the level of care residents require and are compared to state and national benchmarks.
▲ 77.3% Above GA avg. ▲ 77.3% Above GA avg.GA average: 2.3Click the badge to see the full State ranking.Click here to see the full State ranking.
Quality Measures Info Based on clinical and physical health indicators reported to CMS, such as hospital readmissions, falls, pressure ulcers, and improvements in mobility. These measures reflect how well residents' health needs are being managed.
▲ 40.9% Above GA avg. ▲ 40.9% Above GA avg.GA average: 2.8Click the badge to see the full State ranking.Click here to see the full State ranking.

Staffing hours breakdown

Info Daily nursing hours per resident by staff type, reported to CMS. Higher is generally better — compare this facility to state and national averages to see where staffing stands.

Hours per resident per day — compared to Georgia state averages

Total nursing care / resident Info This home is ranked 14th out of 202 homes in Georgia for nurse hours. Total adjusted nursing hours per resident per day, combining RN, LPN, and aide time. CMS adjusts this for case-mix so facilities can be fairly compared.
5h 25m per day
Rank #14 / 202Nurse hours — State benchmarkedThis home is ranked 14th out of 202 homes in Georgia. Shows adjusted nurse hours per resident per day benchmarked to the Georgia average, with a ranking across 202 Georgia facilities. More hours mean more direct care. The national average is about 3.5 hrs; below 3.0 is a red flag.Rankings are based only on facilities in Georgia that report data for that category. Facilities without available data are excluded from the ranking.Click the rank badge to see the full State ranking.Click here to see the full State ranking.
This facility Georgia avg (3h 33m per day)
vs Georgia avg
+52%

2 of 6 metrics below state avg

Standout metric Weekend RN is +138% above state avg
Staff typeHours / Day / Residentvs state avg
Registered Nurse (RN) Info RNs hold the highest nursing license and can assess residents, interpret test results, and direct care plans. More RN hours per day often signals stronger clinical oversight and faster response to health changes. 52m per day ▲ 78% State avg: 29m per day · National avg: 41m per day
LPN / LVN Info Licensed Practical Nurses (LPNs) or Licensed Vocational Nurses (LVNs) deliver routine hands-on care — medication administration, wound dressing, and monitoring vital signs. They work under RN supervision and make up a large share of daily bedside care. 52m per day ▼ 7% State avg: 55m per day · National avg: 52m per day
Nurse Aide Info Certified Nurse Aides (CNAs) provide the most direct day-to-day assistance: bathing, dressing, feeding, and mobility. Nurse aide hours are typically the largest staffing category and directly affect residents' quality of life. 3h 59m per day ▲ 85% State avg: 2h 9m per day · National avg: 2h 20m per day
Weekend Total Nursing Info Combined nursing hours (RN + LPN + Nurse Aide) per resident per day on weekends. Staffing often drops on weekends — this figure reveals whether the facility maintains adequate coverage outside of weekday hours. 5h 29m per day ▲ 75% State avg: 3h 9m per day · National avg: 3h 27m per day
Physical Therapist Info Hours per resident per day provided by licensed Physical Therapists (PTs) or PT Assistants. PT services help residents recover mobility after injury or illness and are especially important for post-acute (short-stay) rehabilitation. 3m per day ▼ 14% State avg: 3m per day · National avg: 4m per day
Weekend RN Info Registered nurse hours specifically on weekends. Facilities sometimes reduce RN presence on Saturdays and Sundays — a low weekend RN figure compared to weekday hours can indicate reduced clinical oversight when most administrative staff are absent. 48m per day ▲ 138% State avg: 20m per day · National avg: 29m per day

Capacity and availability

This home usually has availability

Lower occupancy than the Georgia average: 78.1%
Occupancy rate
58% Rank #222 / 325Occupancy rate — State benchmarkedThis home is ranked 222nd out of 325 homes in Georgia. Shows this facility's occupancy rate versus the Georgia average, with its Statewide rank out of 325. Higher occupancy signals strong local demand and financial stability.Rankings are based only on facilities in Georgia that report data for that category. Facilities without available data are excluded from the ranking.Click the rank badge to see the full State ranking.Click here to see the full State ranking.
Avg. Length of Stay Info Average number of days residents stay at this facility, based on CMS cost report data. Shorter stays often reflect post-acute or rehab care; longer stays reflect long-term care.
106 days
Bed community size
60-bed community Rank #454 / 672Bed count — State benchmarkedThis home is ranked 454th out of 672 homes in Georgia. Shows this facility's certified or reported bed count compared to other Georgia facilities. Larger communities may offer more amenities, programs, and on-site services for residents and families.Rankings are based only on facilities in Georgia that report data for that category. Facilities without available data are excluded from the ranking.Click the rank badge to see the full State ranking.Click here to see the full State ranking.
A moderately sized community that may balance personal attention with shared amenities and social activities.
Walk Score
Walk Score: 20 / 100 Rank #635 / 873Walk Score — State benchmarkedThis home is ranked 635th out of 873 homes in Georgia. Shows how walkable this facility's neighborhood is compared to the average Walk Score across Georgia facilities. Higher scores benefit residents, families, and staff.Rankings are based only on facilities in Georgia that report data for that category. Facilities without available data are excluded from the ranking.Click the rank badge to see the full State ranking.Click here to see the full State ranking.
Car-dependent. Most errands require a car, with limited nearby walkable options.

Therapy & Rehabilitation

1 service
Respite Care

Amenities & Lifestyle

Fitness Center
Scenic Walking Paths
Fantastic Dining Options
Social Clubs
Onsite Healthcare
Art Room
Library
Community Hall
Theatre
Game Rooms
Club Rooms
Beauty/Barber Shop
Convenience Shopping
Specific ProgramsClubs & Groups, Fitness Programs, Wellness Clinic, Health Services, Member Activities

Contact Park View Villas

Staffing Data

Reporting period: October 1 – December 31, 2025 (Q4 2025). Source: CMS Payroll-Based Journal report.

Total staff 74
Employees 54
Contractors 20
Staff to resident ratio 2.18 : 1
53% more staff per resident than Georgia average
Georgia average ratio: 1.42 : 1 Georgia average ratio: 1.42 : 1See full Georgia ranking
Avg staff/day 29
Average shift 8.2 hours
0% compared with Georgia average
Georgia average: 8.3 hours Georgia average shift: 8.3 hoursSee full Georgia ranking
Total staff hours (quarter) 21,899

Nursing staff breakdown

Q4 2025 · Oct 1 – Dec 31 More info This data comes from the CMS Payroll-Based Journal report covering October 1 – December 31, 2025.
Registered Nurse

Manages medical care and health needs.

RN Staff Info All 6 RN Staff are full-time employees. No contractors work on this role. 6
Average shift length Info Average shift length. Calculated as total hours divided by days worked and average staff per day. 8.9 hours
Licensed Practical Nurse

Assists with medical care and medications.

LPN Staff Info 9 total: 8 full-time employees and 1 contractor. 9
Average shift length Info Average shift length. Calculated as total hours divided by days worked and average staff per day. 10.1 hours
Certified Nursing Assistant

Helps with daily care and mobility.

CNA Staff Info All 31 CNA Staff are full-time employees. No contractors work on this role. 31
Average shift length Info Average shift length. Calculated as total hours divided by days worked and average staff per day. 9.4 hours

Contractor staffing

Q4 2025 · Oct 1 – Dec 31 More info This data comes from the CMS Payroll-Based Journal report covering October 1 – December 31, 2025.

Total hours from contractors

2.7%

588 contractor hours this quarter

Respiratory Therapy Technician: 5 Physical Therapy Assistant: 5 Physical Therapy Aide: 4 Qualified Social Worker: 3 Speech Language Pathologist: 2 Licensed Practical Nurse: 1

Staff by category

Q4 2025 · Oct 1 – Dec 31 More info This data comes from the CMS Payroll-Based Journal report covering October 1 – December 31, 2025.
Certified Nursing Assistant3103113,01992100%9.4
Licensed Practical Nurse8192,80892100%10.1
Registered Nurse6061,84692100%8.9
Other Dietary Services Staff3038626874%7.8
Nurse Practitioner1014966267%8
Occupational Therapy Aide1014966267%8
Clinical Nurse Specialist1014926267%7.9
Administrator1014725964%8
Mental Health Service Worker1014325459%8
Dietitian1014245358%8
Respiratory Therapy Technician0551466470%1.8
Physical Therapy Aide0441396368%2.2
Qualified Social Worker0331335155%2.2
Speech Language Pathologist022775257%1.3
Physical Therapy Assistant055573437%1.6
31 Certified Nursing Assistant
% of Days 100%
9 Licensed Practical Nurse
% of Days 100%
6 Registered Nurse
% of Days 100%
3 Other Dietary Services Staff
% of Days 74%
1 Nurse Practitioner
% of Days 67%
1 Occupational Therapy Aide
% of Days 67%
1 Clinical Nurse Specialist
% of Days 67%
1 Administrator
% of Days 64%
1 Mental Health Service Worker
% of Days 59%
1 Dietitian
% of Days 58%
5 Respiratory Therapy Technician
% of Days 70%
4 Physical Therapy Aide
% of Days 68%
3 Qualified Social Worker
% of Days 55%
2 Speech Language Pathologist
% of Days 57%
5 Physical Therapy Assistant
% of Days 37%

Penalties and fines

Includes penalties issued in 2023

Federal penalties imposed by CMS for regulatory violations, including civil money penalties (fines) and denials of payment for new Medicare/Medicaid admissions.

Source: CMS Penalties Database (Data as of Jan 2026)

Total fines amount $19K Rank #170 / 204Federal fines — State benchmarkedThis home is ranked 170th out of 204 homes in Georgia. Shows this facility's cumulative CMS federal fine dollars versus the Georgia average among facilities with fines, and where it ranks among 204 facilities in the pool. Lower total dollars mean a better rank.Rankings are based only on facilities in Georgia that report data for that category. Facilities without available data are excluded from the ranking.Click the rank badge to see the full State ranking.Click here to see the full State ranking.
52% lower than Georgia average

Georgia average: $40K

Number of fines 3
46% more fines than Georgia average

Georgia average: 2.1

Payment Denials Info Serious action where Medicare and/or Medicaid temporarily stops payments for new residents until issues are fixed. 0
100% fewer payment denials than Georgia average

Georgia average: 0.3

Fines amount comparison
This facility $19K
Georgia average $40K
Penalty History

Penalties are imposed by CMS for violations of federal nursing home regulations.

3 penalties in the past 3 years

Multiple penalties were reported in the last 3 years.

Civil Money Penalty Info Fines imposed for noncompliance, which can be assessed per day or per instance of violation. Aug 14, 2023
$5K
Civil Money Penalty Info Fines imposed for noncompliance, which can be assessed per day or per instance of violation. Aug 7, 2023
$4K
Civil Money Penalty Info Fines imposed for noncompliance, which can be assessed per day or per instance of violation. Jul 17, 2023
$11K

Last updated: Jan 2026

Quality of care over time

These measures show how residents usually do over time at this home, based on health outcomes and preventive care.

High-risk clinical events score Info A composite score based on pressure ulcers, falls with injury, weight loss, walking ability decline, and activities of daily living decline. 12.2
19% worse than Georgia average

Georgia average: 10.3

Functional decline score Info A composite score based on activities of daily living decline, walking ability decline, and incontinence. 36.9
112% worse than Georgia average

Georgia average: 17.4

Long-stay resident measures
Need for Help with Daily Activities Increased Info Percent of long-stay residents whose need for help with daily activities has increased 36.2%
115% worse than Georgia average

Georgia average: 16.8%

Low Risk Residents with Bowel/Bladder Incontinence Info Percent of low risk long-stay residents who lose control of their bowels or bladder 37.6%
134% worse than Georgia average

Georgia average: 16.1%

Falls with Major Injury Info Percent of long-stay residents experiencing one or more falls with major injury 1.0%
69% better than Georgia average

Georgia average: 3.2%

High Risk Residents with Pressure Ulcers Info Percent of long-stay high risk residents with pressure ulcers 4.3%
33% better than Georgia average

Georgia average: 6.3%

Urinary Tract Infection Info Percent of long-stay residents with a urinary tract infection 3.1%
24% worse than Georgia average

Georgia average: 2.5%

Lost Too Much Weight Info Percent of long-stay residents who lose too much weight 7.3%
21% worse than Georgia average

Georgia average: 6.0%

Depressive Symptoms Info Percent of long-stay residents who have depressive symptoms 0.0%
100% better than Georgia average

Georgia average: 8.7%

Antipsychotic Use Info Percent of long-stay residents who received an antipsychotic medication 18.2%
5% better than Georgia average

Georgia average: 19.1%

Pneumococcal Vaccine Info Percent of long-stay residents assessed and appropriately given the pneumococcal vaccine 95.0%
In line with Georgia average

Georgia average: 91.5%

Influenza Vaccine Info Percent of long-stay residents assessed and appropriately given the seasonal influenza vaccine 93.3%
In line with Georgia average

Georgia average: 95.0%

Short-stay resident measures
Pneumococcal Vaccine Info Percent of short-stay residents assessed and appropriately given the pneumococcal vaccine 89.6%
11% better than Georgia average

Georgia average: 80.6%

Antipsychotic medication increase Info Percent of short-stay residents who newly received an antipsychotic medication 0.9%
58% better than Georgia average

Georgia average: 2.2%

Influenza Vaccine Info Percent of short-stay residents assessed and appropriately given the seasonal influenza vaccine 85.3%
9% better than Georgia average

Georgia average: 78.2%

Breakdown by payment type

Medicare

51% of new residents, usually for short-term rehab.

Typical stay 1 - 2 months

Private pay

49% of new residents, often for short stays.

Typical stay 2 - 3 years

Facility Characteristics

Source: CMS Long-Term Care Facility Characteristics (Data as of Jan 2026)

Total residents 34
Medicare
5
14.7% of residents
Private pay or other
29
85.3% of residents
Programs & Services
Residents Group

Residents meet regularly to discuss policies, care quality, and activities

CCRC

Part of a Continuing Care Retirement Community offering multiple care levels

Active Resident Council

Organized group of residents that meets regularly to discuss facility policies, quality of life, and activities.

Finances and operations

Based on CMS SNF Cost Report for fiscal year ending in 12/2023.

For-profit
Operated by a single business entity.
Net patient revenue Info Net patient revenue — what the home actually collects for resident care, after contractual allowances, bad debt and discounts are subtracted from its gross charges (CMS cost report, Worksheet G-3). It covers resident care only; money the home earns from other sources is shown separately as "Other income."
$10.5M
Net patient income Info Net patient income: net patient revenue minus the home's total operating expenses. A positive figure means it earns more from resident care than it spends to deliver it; a negative figure means the opposite. It excludes non-operating "other income."
-$29.4M
For-profit Operated by a single business entity.
Net patient revenue Info Net patient revenue — what the home actually collects for resident care, after contractual allowances, bad debt and discounts are subtracted from its gross charges (CMS cost report, Worksheet G-3). It covers resident care only; money the home earns from other sources is shown separately as "Other income."
$10.5M Rank #5 / 197Revenue — State benchmarkedThis home is ranked 5th out of 197 homes in Georgia. Shows this facility's annual revenue compared to the Georgia average. Higher revenue generally means more resources for staffing and capital — read alongside Payroll %.Rankings are based only on facilities in Georgia that report data for that category. Facilities without available data are excluded from the ranking.Click the rank badge to see the full State ranking.Click here to see the full State ranking.
Net patient income Info Net patient income: net patient revenue minus the home's total operating expenses. A positive figure means it earns more from resident care than it spends to deliver it; a negative figure means the opposite. It excludes non-operating "other income."
-$29.4M
Other income Info Money the home earns outside of resident care — such as investments, grants, rentals and other non-operating sources (CMS cost report, Worksheet G-3). It is tracked separately from net patient revenue: it is not part of that figure, and it is not included in net patient income.
$22.8M
Payroll costs Info Staff salaries plus wage-related costs — benefits such as payroll taxes, health insurance and retirement — from the home's own accounting records (CMS cost report, Worksheet A). Contract or agency labor is counted separately, under other operating costs. Rank #2 / 197Payroll — State benchmarkedThis home is ranked 2nd out of 197 homes in Georgia. Shows total annual staff payroll benchmarked to the Georgia average. Higher payroll investment relative to peers often signals better staffing and less reliance on cheaper contract labor.Rankings are based only on facilities in Georgia that report data for that category. Facilities without available data are excluded from the ranking.Click the rank badge to see the full State ranking.Click here to see the full State ranking.
$14.7M 140% of net patient revenue Info Payroll as a share of revenue: staff salaries and wage-related benefits divided by net patient revenue. A higher figure means more of each revenue dollar goes to staff pay. Rank #110 / 197Payroll % — State benchmarkedThis home is ranked 110th out of 197 homes in Georgia. Shows payroll as a percentage of revenue versus the Georgia average. Well-run Georgia facilities typically land around 50–62% — the top third Statewide. Below 25% may signal understaffing or heavy agency use — read with Staffing ratings.Rankings are based only on facilities in Georgia that report data for that category. Facilities without available data are excluded from the ranking.Click the rank badge to see the full State ranking.Click here to see the full State ranking.
Other operating costs Info Everything it costs to run the home apart from payroll — food, utilities, supplies, maintenance, contract labor and administration. Calculated as total operating expense minus payroll (staff salaries and wage-related benefits).
$25.2M
Total costs Info The home's total operating expense for the year — all the costs of running it, salaries included (CMS cost report, Worksheet G-3).
$39.9M

What does this home offer?

Room sizes icon
Room sizes icon

Room Sizes: 695 / 983 sq. ft

Housing options icon

Housing Options: 1 Bed / 2 Bed

Building type icon
Building type icon

Building Type: 3-story

Social and recreational activities icon

Social and Recreational Activities

Exercise program icon

Exercise Programs

Parking Available icon

Parking Available

Who this home usually serves

TYPE OF STAY

Mostly short-term rehab stays

Most residents typically stay for a few weeks or months before returning home or moving on.

Most new residents arrive under Medicare (51% of admissions), and a typical Medicare stay runs around 1 - 2 months.

Admissions
72 total

Coverage residents most often arrive under.

Medicare 51%
Private pay 49%
Discharges
129 total

Coverage residents most often leave under.

Medicare 43%
Private pay 57%

Managed by Marinda B. Zanders

Skilled Nursing Administrator

Living Spaces & Floor Plans for Park View Villas

Places of interest near Park View Villas

Address 2.8 miles from city center Info Estimated distance in miles from Stone Mountain's city center to Park View Villas's address, calculated via Google Maps.

Calculate Travel Distance to Park View Villas

Add your location

Address

Financial Assistance for
Senior Living in Georgia

Park View Villas is located in Stone Mountain, Georgia.
Here are the financial assistance programs available to residents in Georgia.

Get Financial aid guidance

Community Care Services Program

Georgia Medicaid CCSP

Age 65+ or disabled
General Georgia resident, Medicaid-eligible, nursing home-level care need.
Income Limits (2025) ~$2,829/month 300% FBR, individual
Asset Limits $2,000 (individual), $3,000 (couple).
GA

High rural demand; waitlists possible.

Benefits
Personal care (5-7 hours/day) Adult day care (~$75/day) Respite (240 hours/year) Meals

Respite Care Program

Georgia NFCSP Respite

Age Caregiver of someone 60+ (or with dementia)
General Georgia resident.
Income Limits No strict limit; prioritizes low-income.
Asset Limits Not applicable.
GA

Focus on metro and rural balance.

Benefits
In-home aide (4-6 hours/day) Adult day care (~$75/day) Facility stay (up to 5 days)

Home and Community Services (HCS)

Georgia Home and Community Services (Non-Medicaid)

Age 60+
General Georgia resident, functionally impaired, at risk of nursing home placement.
Income Limits (2025) No strict limit; prioritizes ~$41,000/year; cost-sharing for higher incomes.
Asset Limits Not specified; need-based.
GA

Non-Medicaid; AAA-managed.

Benefits
Personal care (4-6 hours/day) Homemaker Adult day care ($80/day) Respite (~5 days/year)

Medicare Savings Program (MSP)

Georgia Medicare Savings Program

Age 65+ or disabled
General Georgia resident, Medicare Part A/B.
Income Limits (2025) ~$2,510/month (QMB), ~$3,380/month (SLMB), ~$3,598/month (QI).
Asset Limits $9,430 (individual), $14,130 (couple).
GA

Three tiers; entitlement benefit.

Benefits
Covers Part B premiums ($174.70/month) Deductibles ($240/year) Copays (~20%)

Program of All-Inclusive Care for the Elderly (PACE)

Georgia Medicaid PACE

Age 55+
General Georgia resident, nursing home-level care need, safe with PACE support.
Income Limits (2025) ~$2,829/month 300% FBR
Asset Limits $2,000 (individual), $3,000 (couple).
GA

Limited areas (e.g., Macon, Augusta).

Benefits
Personal care (5-7 hours/day) Medical care Meals Transportation Therapy

SOURCE (Service Options Using Resources in a Community Environment)

Georgia Medicaid SOURCE Program

Age 65+ or disabled
General Georgia resident, Medicaid-eligible, frail but not necessarily nursing home-level.
Income Limits (2025) ~$914/month (SSI level); QIT allowed.
Asset Limits $2,000 (individual), $3,000 (couple).
GA

Enhanced primary care model; statewide via 12 sites.

Benefits
Personal care (4-6 hours/day) Case management Adult day health ($80/day) Respite (limited)

Optional State Supplementation (OSS)

Georgia Optional State Supplementation

Age 65+ or disabled
General Georgia resident, in approved facility, low-income/SSI recipient.
Income Limits (2025) ~$1,004/month including SSI
Asset Limits $2,000 (individual), $3,000 (couple).
GA

~$20-$489/month based on facility type.

Benefits
Cash (~$20-$489/month) for room/board in personal care homes

Frequently Asked Questions about Park View Villas

What neighborhood is Park View Villas in?

Park View Villas is in the Stone Mountain neighborhood.

Is Park View Villas in a walkable area?

Park View Villas has a walk score of 20. Car-dependent. Most errands require a car, with limited nearby walkable options.

What is the occupancy rate at Park View Villas?

Park View Villas's occupancy is 58.0%.

Does Park View Villas have different floorplan options?

Yes — see the floorplan options available at Park View Villas on this page.

Does Park View Villas operate as a for-profit or non-profit?

Park View Villas is registered as a for-profit.

Are there photos of Park View Villas?

Yes — there are 10 photos of Park View Villas in the photo gallery on this page.

What is the address of Park View Villas?

Park View Villas is located at 500 Springhouse Cir, Stone Mountain, GA 30087.

Guides for Better Senior Living

Care Cost Calculator: See Prices in Your Area

Nursing Home Data Explorer

Don’t Wait Too Long: 7 Red Flag Signs Your Parent Needs Assisted Living Now

The True Cost of Assisted Living in 2025 – And How Families Are Paying For It

Understanding Senior Living Costs: Pricing Models, Discounts & Financial Assistance