Parsons Hill Rehabilitation and Health Care Center
Nursing Home, Skilled Nursing, Assisted Living & Hospice Care · Worcester, MA
CMS overall rating Info The Overall CMS Rating is scored from 1 to 5 stars and combines results from health inspections, staffing levels, and quality measures. Health inspections carry the most weight. Staffing and quality scores can increase or decrease the final rating based on performance compared to state and national standards.

Parsons Hill Rehabilitation and Health Care Center

Nursing Home, Skilled Nursing, Assisted Living & Hospice Care · Worcester, MA
CMS overall rating Info The Overall CMS Rating is scored from 1 to 5 stars and combines results from health inspections, staffing levels, and quality measures. Health inspections carry the most weight. Staffing and quality scores can increase or decrease the final rating based on performance compared to state and national standards.
Calculator: See prices in your area
Parsons Hill Rehabilitation and Health Care Center accepts Medicaid, Medicare, and private pay.

Overview of Parsons Hill Rehabilitation and Health Care Center

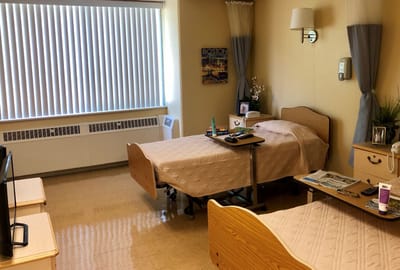
Parsons Hill Rehabilitation and Health Care Center is a remarkably skilled nursing and rehab facility in Worcester that is dedicated to enhancing the quality of life for seniors. The warm and inviting atmosphere is uniquely designed to provide comfort and peace of mind. With physicians, nurses, clinical staff, rehabilitation therapists, and other team members on standby, residents have access to everything they need, any time of day. 

Their post-hospital care and recovery programs include a wide range of specialties and facilities, such as central venous catheter management, Lasix IV push, blood draws, oxygen therapy, and nutritional management. They also provide post-surgical care and a behavioral management unit to meet the needs of all residents. Moreover, Parsons Hill offers 24-hour supervision, restorative care programs, registered dietitian services, and a selective menu dining program to promote overall well-being. They also provide family counseling and support groups to ensure that families are supported in their loved one’s care.

Managed by Norma B-Mullings

Administrator

Norma B-Mullings serves as the Administrator at Parsons Hill Rehabilitation & Health Care Center, overseeing the care of residents and staff. She is dedicated to guiding families through healthcare decisions for both short-term rehab and long-term care, ensuring a supportive and professional environment.

Quality ratings

Measured by Centers for Medicare & Medicaid Services (CMS)

Overall rating Info The Overall CMS Rating combines results from health inspections, staffing levels and quality measures. Health inspections carry the most weight. Staffing and quality scores can increase or decrease the final rating based on performance compared to state and national standards.
▼ 37.7% Below MA avg. ▼ 37.7% Below MA avg.Click the badge to see the full State ranking.Click here to see the full State ranking.
Health Inspection Info Based on the results of the facility's three most recent standard inspections and any complaint investigations. CMS reviews the number, scope, and severity of deficiencies, with more recent findings weighted more heavily.
▼ 33.3% Below MA avg. ▼ 33.3% Below MA avg.Click the badge to see the full State ranking.Click here to see the full State ranking.
Staffing Info Measures average nursing staff hours per resident per day, including Registered Nurses (RNs) and total nursing staff. Ratings are adjusted based on the level of care residents require and are compared to state and national benchmarks.
▼ 12.5% Below MA avg. ▼ 12.5% Below MA avg.Click the badge to see the full State ranking.Click here to see the full State ranking.
Quality Measures Info Based on clinical and physical health indicators reported to CMS, such as hospital readmissions, falls, pressure ulcers, and improvements in mobility. These measures reflect how well residents' health needs are being managed.
▲ 21.6% Above MA avg. ▲ 21.6% Above MA avg.Click the badge to see the full State ranking.Click here to see the full State ranking.

Staffing hours breakdown

Info Daily nursing hours per resident by staff type, reported to CMS. Higher is generally better — compare this facility to state and national averages to see where staffing stands.

Hours per resident per day — compared to Massachusetts state averages

Total nursing care / resident Info This home is ranked 50th out of 63 homes in Massachusetts.

Total adjusted nursing hours per resident per day, combining RN, LPN, and aide time. CMS adjusts this for case-mix so facilities can be fairly compared.
3h 30m per day
Rank #50 / 63Nurse hours — State benchmarkedThis home is ranked 50th out of 63 homes in Massachusetts.Shows adjusted nurse hours per resident per day benchmarked to the Massachusetts average, with a ranking across 63 Massachusetts SNFs. More hours mean more direct care. The national average is about 3.5 hrs; below 3.0 is a red flag.Click the rank badge to see the full State ranking.Click here to see the full State ranking.
This facility Massachusetts avg (4h 18m per day)
vs Massachusetts avg
-19%

5 of 6 metrics below state avg

Staff typeHours / Day / Residentvs state avg
Registered Nurse (RN) Info RNs hold the highest nursing license and can assess residents, interpret test results, and direct care plans. More RN hours per day often signals stronger clinical oversight and faster response to health changes. 25m per day ▼ 36% State avg: 39m per day · National avg: 41m per day
LPN / LVN Info Licensed Practical Nurses (LPNs) or Licensed Vocational Nurses (LVNs) deliver routine hands-on care — medication administration, wound dressing, and monitoring vital signs. They work under RN supervision and make up a large share of daily bedside care. 54m per day ▼ 7% State avg: 58m per day · National avg: 52m per day
Nurse Aide Info Certified Nurse Aides (CNAs) provide the most direct day-to-day assistance: bathing, dressing, feeding, and mobility. Nurse aide hours are typically the largest staffing category and directly affect residents' quality of life. 1h 51m per day ▼ 18% State avg: 2h 16m per day · National avg: 2h 21m per day
Total Nursing (Weekend) Info Combined nursing hours (RN + LPN + Nurse Aide) per resident per day on weekends. Staffing often drops on weekends — this figure reveals whether the facility maintains adequate coverage outside of weekday hours. 2h 56m per day ▼ 15% State avg: 3h 27m per day · National avg: 3h 26m per day
Physical Therapist Info Hours per resident per day provided by licensed Physical Therapists (PTs) or PT Assistants. PT services help residents recover mobility after injury or illness and are especially important for post-acute (short-stay) rehabilitation. 4m per day ■ Avg State avg: 4m per day · National avg: 4m per day
RN (Weekend) Info Registered nurse hours specifically on weekends. Facilities sometimes reduce RN presence on Saturdays and Sundays — a low weekend RN figure compared to weekday hours can indicate reduced clinical oversight when most administrative staff are absent. 15m per day ▼ 46% State avg: 28m per day · National avg: 29m per day

Capacity and availability

This home usually has limited availability

Occupancy between 85% and 95% suggests balanced demand.

Higher occupancy than the Massachusetts average: 82%
Occupancy rate 91.4% Rank #17 / 64Occupancy rate — State benchmarkedThis home is ranked 17th out of 64 homes in Massachusetts.Shows this facility's occupancy rate versus the Massachusetts average, with its Statewide rank out of 64. Higher occupancy signals strong local demand and financial stability.Click the rank badge to see the full State ranking.Click here to see the full State ranking.
Avg. Length of Stay 293 days
Occupancy rate
91.4% Rank #17 / 64Occupancy rate — State benchmarkedThis home is ranked 17th out of 64 homes in Massachusetts.Shows this facility's occupancy rate versus the Massachusetts average, with its Statewide rank out of 64. Higher occupancy signals strong local demand and financial stability.Click the rank badge to see the full State ranking.Click here to see the full State ranking.
Avg. Length of Stay
293 days

Who this home usually serves

TYPE OF STAY

Primarily long-term care, limited rehab

Most residents stay long-term, while a smaller portion are admitted for short-term rehab.

Breakdown by payment type

Medicare

13% of new residents, usually for short-term rehab.

Typical stay 1 - 2 months

Private pay

64% of new residents, often for short stays.

Typical stay 1 - 2 months

Medicaid

22% of new residents, often for long-term daily care.

Typical stay 3 years

Finances and operations

Privately-owned community
Operated by a partnership between two or more business owners.
Home revenue
$30.0M
Profit
$2.1M
Privately-owned community Operated by a partnership between two or more business owners.
Home revenue
$30.0M Rank #14 / 65Revenue — State benchmarkedThis home is ranked 14th out of 65 homes in Massachusetts.Shows this facility's annual revenue compared to the Massachusetts SNF average. Higher revenue generally means more resources for staffing and capital — read alongside Payroll %.Click the rank badge to see the full State ranking.Click here to see the full State ranking.
Profit
$2.1M
Payroll costs Info The portion of the home's budget spent on staff, including nurses, caregivers, and other employees who support care and operations. Rank #24 / 65Payroll — State benchmarkedThis home is ranked 24th out of 65 homes in Massachusetts.Shows total annual staff payroll benchmarked to the Massachusetts average. Higher payroll investment relative to peers often signals better staffing and less reliance on cheaper contract labor.Click the rank badge to see the full State ranking.Click here to see the full State ranking.
$12.3M
41.1% of revenue Rank #55 / 65Payroll % — State benchmarkedThis home is ranked 55th out of 65 homes in Massachusetts.Shows payroll as a percentage of revenue versus the Massachusetts average. Well-run Massachusetts SNFs typically land around 54–65% — the top third Statewide. Below 25% may signal understaffing or heavy agency use — read with Staffing ratings.Click the rank badge to see the full State ranking.Click here to see the full State ranking.
Other operating costs Info All remaining costs needed to run the home, such as food, utilities, building maintenance, supplies and administrative expenses.
$15.6M
Total costs $27.9M
Walk Score
Walk Score: 76 / 100 Rank #16 / 66Walk Score — State benchmarkedThis home is ranked 16th out of 66 homes in Massachusetts.Shows how walkable this facility's neighborhood is compared to the average Walk Score across Massachusetts SNFs. Higher scores benefit residents, families, and staff.Click the rank badge to see the full State ranking.Click here to see the full State ranking.
Very walkable. Most errands can be accomplished on foot, and many essentials are within a short walk.

About this community

Staffing

Key information about the people who lead and staff this community.

Leadership

ContactMr. Ed Murphy, Administrator

Payment & Insurance

2 services
Accept Medicaid
Accept Medicare

Therapy & Rehabilitation

3 services
Rehabilitation Services
Respite Care
Short-Term Rehab

Additional Services

1 service
Short-Term Rehabilitation

Amenities & Lifestyle

Specific ProgramsLife Enrichment Programming, Skilled Nursing Care, Substance Use Supportive Services
Operating HoursVisiting hours are suggested from 10 AM – 8 PM, with accommodations as requested.

What does this home offer?

Minimum age icon
Minimum age icon

Minimum Age: 55 Years Old

Fitness and recreation icon

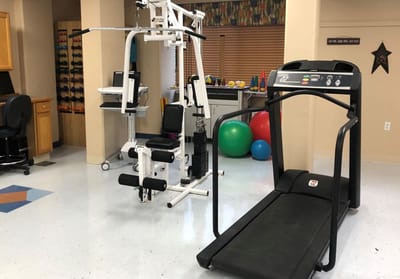
Fitness and Recreation

Types of Care at Parsons Hill Rehabilitation and Health Care Center

Skilled Nursing Assisted Living Hospice Care

Contact Parsons Hill Rehabilitation and Health Care Center

Inspection History

In Massachusetts, the Executive Office of Elder Affairs (for assisted living facilities) and the Department of Public Health (for nursing homes) are the agencies authorized to inspect and report on facility safety.

Since 2022 · 4 years of data 51 citations

Inspection Scorecard Info This scorecard compares key inspection, citation, and complaint metrics at this facility against the Massachusetts state average. Metrics rated ≥15% worse than average are highlighted in red; those ≥15% better are highlighted in green.

Since 2022 vs. Massachusetts state average
Latest Inspection August 19, 2025 Plan Of Correction

Citations Info Citations are formal regulatory issues recorded during state inspections.

MetricThis FacilityMA Averagevs. MA Avg
Total citations Info Formal regulatory issues recorded by inspectors across all inspection types. 5114 This facility has 264% more total citations than a typical Massachusetts nursing home (51 vs. MA avg 14). Click this badge to view the full Massachusetts ranking.↑ 264% worse
Citations per year Info Average citations per year since 2022. 12.83.5 This facility has 266% more citations per year than a typical Massachusetts nursing home (12.8 vs. MA avg 3.5). Click this badge to view the full Massachusetts ranking.↑ 266% worse

Inspection Reports Summary Info An editor-reviewed summary of the themes and findings across this facility's recent inspection reports.

The most recent inspection on August 19, 2025, found deficiencies related to failure to provide required Notices of Intent to Discharge to residents and to send copies to the Office of the State Long-Term Care Ombudsman. Earlier inspections identified issues with resident dignity and abuse prevention, medication management, infection control, environmental safety, and documentation accuracy. Complaint investigations substantiated abuse allegations against a staff member and noted failures in supervision and resident rights, including an incident of resident elopement. Enforcement actions such as fines or license suspensions were not listed in the available reports. The inspection history shows ongoing challenges with regulatory compliance, particularly in resident rights and care coordination, with no clear pattern of sustained improvement.

Read the full inspection reports for this facility, including detailed findings and corrective actions.

Show Inspection Reports

Health Inspection History

Inspections Since 2022
Total health inspections 8

Massachusetts average 4.5


Last Health inspection on Aug 2025

Total health citations
50 Rank #56 / 62Health citations — State benchmarkedThis home is ranked 56th out of 62 homes in Massachusetts.Shows this facility's total health deficiency citations benchmarked to the Massachusetts State average, with a ranking across all 62 MA SNFs. Lower citation counts earn a better rank.Click the rank badge to see the full State ranking.Click here to see the full State ranking.

Massachusetts average 32.7

Citations per inspection
6.25 Rank #36 / 62Citations per inspection — State benchmarkedThis home is ranked 36th out of 62 homes in Massachusetts.Shows average deficiency citations per CMS inspection for this facility versus the Massachusetts mean across 62 SNFs with citation data. Lower is better.Click the rank badge to see the full State ranking.Click here to see the full State ranking.

Massachusetts average 7.24


Health citations are formal notices following inspections when they fail to comply with safety and care standards.

41 of 50 citations resulted from standard inspections; and 7 of 50 resulted from complaint investigations.

Breakdown of citation severity (last 4 years)
Critical Health citations
0
100% better than Massachusetts average

Massachusetts average: 0.3


Serious Health citations
0
100% better than Massachusetts average

Massachusetts average: 1.5

0 critical citations Massachusetts average: 0.3

0 serious citations Massachusetts average: 1.5

47 moderate citations Massachusetts average: 29.7

3 minor citations Massachusetts average: 1.3
Citations history (last 4 years)
Resident Rights moderate citation Aug 19, 2025
Corrected

Resident Rights moderate citation Apr 01, 2025
Corrected

Environmental moderate citation Mar 25, 2025
Corrected

Infection Control moderate citation Mar 25, 2025
Corrected

Financial Assistance for
Nursing Home in Massachusetts

Parsons Hill Rehabilitation and Health Care Center is located in Worcester, Massachusetts.
Here are the financial assistance programs available to residents in Massachusetts.

Get Financial aid guidance

Home Care Program

MassHealth Home Care

Age 60+
General Massachusetts resident, at risk of nursing home placement.
Income Limits (2025) ~$1,500/month individual, varies by region
Asset Limits $2,000 individual, excludes home, car
MA

Coordinated through Aging Services Access Points (ASAPs); high demand in urban areas.

Benefits
In-home care (3-5 hours/day) Homemaker services Respite care (up to 14 days/year) Adult day care (~$75/day)

Frail Elder Waiver

Massachusetts Medicaid FE Waiver

Age 65+
General Massachusetts resident, Medicaid-eligible, nursing home-level care need.
Income Limits (2025) ~$2,829/month 300% FBR, individual
Asset Limits $2,000 (individual), $3,000 (couple).
MA

Requires clinical eligibility determination.

Benefits
Personal care (5-7 hours/day) Respite care (240 hours/year) Adult day care (~$75/day) Home health services

Senior Care Options (SCO)

Massachusetts Senior Care Options

Age 65+
General Massachusetts resident, eligible for MassHealth (Medicare optional), nursing home-level care need.
Income Limits (2025) ~$2,829/month (300% FBR, individual); QIT allowed.
Asset Limits $2,000 (individual), $3,000 (couple) (excludes home up to $713,000, car).
MA

Not available in Dukes/Nantucket Counties; multiple SCO providers (e.g., CCA, Tufts).

Benefits
Personal care (5-7 hours/day) Medical care Respite (240 hours/year) Adult

Medicare Savings Program (MSP)

Massachusetts Medicare Savings Program (MassHealth Buy-In)

Age 65+ or disabled
General Massachusetts resident, Medicare Part A/B.
Income Limits (2025) ~$2,510/month (QMB), ~$3,380/month (SLMB), ~$3,598/month (QI)—individual.
Asset Limits $9,430 (individual), $14,130 (couple).
MA

Three tiers; no waitlist; includes Extra Help for Part D.

Benefits
Covers Part B premiums ($174.70/month) Deductibles ($240/year) Copays (~20%)

National Family Caregiver Support Program (NFCSP) Respite

Massachusetts NFCSP Respite Care

Age
General Caregivers of 60+ needing care or 55+ caregivers of others; Massachusetts resident; functional needs (2+ ADLs).
Income Limits (2025) Prioritizes ~$24,980/year (individual); no strict cap.
Asset Limits Not assessed; need-based.
MA

27 ASAPs; prioritizes low-income, rural caregivers.

Benefits
Respite (4-6 hours/week or 5 days/year) Adult day care ($60/day) Caregiver training Supplies (~$500/year)

Prescription Advantage

Massachusetts Prescription Advantage

Age 65+ or disabled
General Massachusetts resident, enrolled in Medicare Part D (or ineligible for Medicare).
Income Limits (2025) No strict limit; copays vary by income ~$24,980-$75,000/year individual
Asset Limits Not assessed.
MA

Supplements Medicare Part D; no enrollment fee for low-income.

Benefits
Covers prescription copays ($5-$40/drug) Fills coverage gaps Catastrophic cost protection ($4,000+ covered)

VA Aid and Attendance (A&A) and Housebound Benefits

Massachusetts VA Aid and Attendance/Housebound

Age 65+ or disabled veteran/spouse
General Massachusetts resident, wartime service, need for ADL help (A&A) or homebound.
Income Limits (2025) Net income < ~$1,984/month (veteran with dependent, A&A); pension offsets income.
Asset Limits ~$155,356 net worth limit
MA

High veteran demand statewide.

Benefits
Cash (~$1,433-$2,642/month veteran, ~$951-$1,318 spouse) for care costs (e.g., in-home, assisted living)

Places of interest near Parsons Hill Rehabilitation and Health Care Center

Address 2.9 miles from city center Info Estimated distance in miles from Worcester's city center to Parsons Hill Rehabilitation and Health Care Center's address, calculated via Google Maps. — 2.24 miles to nearest hospital (Webster Square Medical Center)

Calculate Travel Distance to Parsons Hill Rehabilitation and Health Care Center

Add your location

Address

Staffing Data

Reporting period: April 1 – June 30, 2025 (Q2 2025). Source: CMS Payroll-Based Journal report.

Total staff 134
Employees 130
Contractors 4
Staff to resident ratio 0.88:1
49% worse than Massachusetts average
Massachusetts average ratio: 1.70:1 Massachusetts average ratio: 1.70:1See full Massachusetts ranking
Avg staff/day 71
Average shift 8.2 hours
0% compared with Massachusetts average
Massachusetts average: 7.9 hours Massachusetts average shift: 7.9 hoursSee full Massachusetts ranking
Total staff hours (quarter) 53,171

Nursing staff breakdown

Q2 2025 · Apr 1 – Jun 30 More info This data comes from the CMS Payroll-Based Journal report covering April 1 – June 30, 2025.
Registered Nurse

Manages medical care and health needs.

Total count 4
Average shift length Info Average shift length. Calculated as total hours divided by days worked and average staff per day. 9.3 hours

No contractors work on this role.

Licensed Practical Nurse

Assists with medical care and medications.

Total count 21
Average shift length Info Average shift length. Calculated as total hours divided by days worked and average staff per day. 8.7 hours

No contractors work on this role.

Certified Nursing Assistant

Helps with daily care and mobility.

Total count 63
Average shift length Info Average shift length. Calculated as total hours divided by days worked and average staff per day. 8.4 hours

No contractors work on this role.

Contractor staffing

Q2 2025 · Apr 1 – Jun 30 More info This data comes from the CMS Payroll-Based Journal report covering April 1 – June 30, 2025.

Total hours from contractors

0.2%

101 contractor hours this quarter

Feeding Assistant: 2 Medical Director: 2

Staff by category

Q2 2025 · Apr 1 – Jun 30 More info This data comes from the CMS Payroll-Based Journal report covering April 1 – June 30, 2025.
Certified Nursing Assistant6306326,30891100%8.4
Licensed Practical Nurse2102110,45191100%8.7
Clinical Nurse Specialist9093,90891100%8
Mental Health Service Worker9092,3718088%7.2
RN Director of Nursing3031,9718796%9.8
Registered Nurse4041,81591100%9.3
Other Dietary Services Staff5051,58491100%7.5
Physical Therapy Assistant4048997684%7.1
Respiratory Therapy Technician2028786875%7.4
Physical Therapy Aide2025316470%7
Therapeutic Recreation Specialist1015316976%7.7
Speech Language Pathologist2024836774%7.1
Dietitian1014575763%8
Nurse Practitioner1014385662%7.8
Occupational Therapy Aide1014215560%7.7
Feeding Assistant022774246%1
Qualified Social Worker202281011%2.8
Medical Director022241921%1
63 Certified Nursing Assistant
% of Days 100%
21 Licensed Practical Nurse
% of Days 100%
9 Clinical Nurse Specialist
% of Days 100%
9 Mental Health Service Worker
% of Days 88%
3 RN Director of Nursing
% of Days 96%
4 Registered Nurse
% of Days 100%
5 Other Dietary Services Staff
% of Days 100%
4 Physical Therapy Assistant
% of Days 84%
2 Respiratory Therapy Technician
% of Days 75%
2 Physical Therapy Aide
% of Days 70%
1 Therapeutic Recreation Specialist
% of Days 76%
2 Speech Language Pathologist
% of Days 74%
1 Dietitian
% of Days 63%
1 Nurse Practitioner
% of Days 62%
1 Occupational Therapy Aide
% of Days 60%
2 Feeding Assistant
% of Days 46%
2 Qualified Social Worker
% of Days 11%
2 Medical Director
% of Days 21%

Facility Characteristics

Source: CMS Long-Term Care Facility Characteristics (Data as of Jan 2026)

Total residents 153
Medicare
4
2.6% of residents
Medicaid
99
64.7% of residents
Private pay or other
50
32.7% of residents
Programs & Services
Residents Group

Residents meet regularly to discuss policies, care quality, and activities

Active Resident Council

Organized group of residents that meets regularly to discuss facility policies, quality of life, and activities.

Quality of care over time

These measures show how residents usually do over time at this home, based on health outcomes and preventive care.

High-risk clinical events score Info A composite score based on pressure ulcers, falls with injury, weight loss, walking ability decline, and activities of daily living decline. 7.9
22% better than Massachusetts average

Massachusetts average: 10.2

Functional decline score Info A composite score based on activities of daily living decline, walking ability decline, and incontinence. 14.2
29% better than Massachusetts average

Massachusetts average: 20.0

Long-stay resident measures
Significantly above average Massachusetts avg: 3.6 Info CMS star rating based on long-stay quality measure performance. 5 stars = significantly above average, 1 star = significantly below average.
Need for Help with Daily Activities Increased Info Percent of long-stay residents whose need for help with daily activities has increased 16.6%
11% better than Massachusetts average

Massachusetts average: 18.7%

Walking Ability Worsened Info Percent of long-stay residents whose ability to move independently worsened 8.9%
54% better than Massachusetts average

Massachusetts average: 19.3%

Low Risk Residents with Bowel/Bladder Incontinence Info Percent of low risk long-stay residents who lose control of their bowels or bladder 17.1%
23% better than Massachusetts average

Massachusetts average: 22.1%

Falls with Major Injury Info Percent of long-stay residents experiencing one or more falls with major injury 2.7%
25% better than Massachusetts average

Massachusetts average: 3.6%

High Risk Residents with Pressure Ulcers Info Percent of long-stay high risk residents with pressure ulcers 4.7%
In line with Massachusetts average

Massachusetts average: 4.7%

Urinary Tract Infection Info Percent of long-stay residents with a urinary tract infection 0.6%
72% better than Massachusetts average

Massachusetts average: 2.1%

Lost Too Much Weight Info Percent of long-stay residents who lose too much weight 6.6%
28% worse than Massachusetts average

Massachusetts average: 5.2%

Depressive Symptoms Info Percent of long-stay residents who have depressive symptoms 3.0%
72% better than Massachusetts average

Massachusetts average: 10.7%

Antipsychotic Use Info Percent of long-stay residents who received an antipsychotic medication 42.4%
109% worse than Massachusetts average

Massachusetts average: 20.3%

Pneumococcal Vaccine Info Percent of long-stay residents assessed and appropriately given the pneumococcal vaccine 98.3%
7% better than Massachusetts average

Massachusetts average: 91.9%

Influenza Vaccine Info Percent of long-stay residents assessed and appropriately given the seasonal influenza vaccine 95.1%
In line with Massachusetts average

Massachusetts average: 94.8%

Hospitalizations per 1,000 days Info Number of hospitalizations per 1,000 long-stay resident days. 1.53
18% better than Massachusetts average

Massachusetts average: 1.86

ED visits per 1,000 days Info Number of outpatient emergency department visits per 1,000 long-stay resident days. 0.62
60% better than Massachusetts average

Massachusetts average: 1.54

Short-stay resident measures
Average Massachusetts avg: 3.2 Info CMS star rating based on short-stay quality measure performance. 5 stars = much above average, 1 star = much below average.
Pneumococcal Vaccine Info Percent of short-stay residents assessed and appropriately given the pneumococcal vaccine 91.6%
19% better than Massachusetts average

Massachusetts average: 76.7%

Antipsychotic medication increase Info Percent of short-stay residents who newly received an antipsychotic medication 2.0%
54% worse than Massachusetts average

Massachusetts average: 1.3%

Influenza Vaccine Info Percent of short-stay residents assessed and appropriately given the seasonal influenza vaccine 91.7%
18% better than Massachusetts average

Massachusetts average: 77.7%

Re-hospitalized after SNF stay Info Percentage of short-stay residents who were re-hospitalized after their nursing home admission. 11.4%
56% better than Massachusetts average

Massachusetts average: 25.8%

Emergency department visits Info Percentage of short-stay residents who had an outpatient emergency department visit. 14.4%
22% worse than Massachusetts average

Massachusetts average: 11.8%

Falls with major injury Info Percentage of SNF residents who experience falls with major injury during their stay. 0.0%
100% better than Massachusetts average

Massachusetts average: 0.8%

Successful return to home or community Info Rate of successful return to home or community from a skilled nursing facility. 31.5%
38% worse than Massachusetts average

Massachusetts average: 50.6%

Penalties and fines

Federal penalties imposed by CMS for regulatory violations, including civil money penalties (fines) and denials of payment for new Medicare/Medicaid admissions.

Source: CMS Penalties Database

No penalties in the past 3 years

No civil money penalties or payment denials were reported in the last 3 years.

Compare Nursing Home around Worcester

The information below is reported by the Massachusetts Executive Office of Elder Affairs and Department of Public Health.

2 facilities compared · CMS & MA Dept. of Health data

Filter by care type
Christopher Heights of Worcester
NH

Nursing Home Licensed facility providing 24/7 skilled nursing care for residents with complex, ongoing medical needs. Staffed by RNs, LPNs, and CNAs. Inspected and star-rated annually by CMS. Accepts Medicare (short-term rehab) and Medicaid (long-term care).

AL

Assisted Living A licensed, long-term care setting for seniors or individuals with disabilities who need help with daily activities — like bathing, dressing, and medication management — but not 24-hour skilled nursing. Offers housing, meals, and around-the-clock support while aiming to maximize resident independence.

IL

Independent Living Lifestyle-focused communities for older adults offering dining, activities, and transportation with minimal personal care. Best for active, independent seniors who want community without medical support.

Worcester (Biotech Park Area)80 92.8% +13%4.36 -43%+11%$21.5k225.52143A+ 30 The Grantham Group, LLC$26.6M$13.2M49.5%225385
Parsons Hill Rehabilitation and Health Care Center
NH

Nursing Home Licensed facility providing 24/7 skilled nursing care for residents with complex, ongoing medical needs. Staffed by RNs, LPNs, and CNAs. Inspected and star-rated annually by CMS. Accepts Medicare (short-term rehab) and Medicaid (long-term care).

AL

Assisted Living A licensed, long-term care setting for seniors or individuals with disabilities who need help with daily activities — like bathing, dressing, and medication management — but not 24-hour skilled nursing. Offers housing, meals, and around-the-clock support while aiming to maximize resident independence.

HC

Home Care Professional care delivered in the person's own home — from companionship and errands to skilled nursing and therapy. Allows seniors to age in place. Medicare covers skilled home health when medically necessary.

Worcester (Webster Square)162 94.6% +15%3.50 -77%-11%$0506.3-150- 76 -$30.0M$12.3M41.1%225390

Guides for Better Senior Living

Care Cost Calculator: See Prices in Your Area

Nursing Home Data Explorer

Don’t Wait Too Long: 7 Red Flag Signs Your Parent Needs Assisted Living Now

The True Cost of Assisted Living in 2025 – And How Families Are Paying For It

Understanding Senior Living Costs: Pricing Models, Discounts & Financial Assistance

Frequently Asked Questions about Parsons Hill Rehabilitation and Health Care Center

What neighborhood is Parsons Hill Rehabilitation and Health Care Center in?

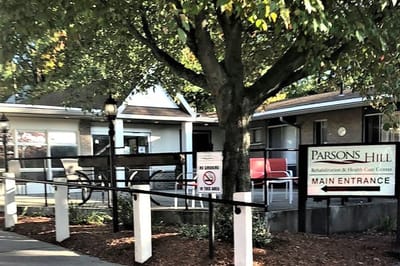
Parsons Hill Rehabilitation and Health Care Center is in the Webster Square neighborhood of Worcester.

Is Parsons Hill Rehabilitation and Health Care Center in a walkable area?

Parsons Hill Rehabilitation and Health Care Center has a walk score of 76. Very walkable. Most errands can be accomplished on foot, and many essentials are within a short walk.

Are there photos of Parsons Hill Rehabilitation and Health Care Center?

Yes — there are 3 photos of Parsons Hill Rehabilitation and Health Care Center in the photo gallery on this page.

What is the phone number of Parsons Hill Rehabilitation and Health Care Center?

(508) 791-4200 will put you in contact with the team at Parsons Hill Rehabilitation and Health Care Center.

Is Parsons Hill Rehabilitation and Health Care Center Medicare or Medicaid certified?

Yes — Parsons Hill Rehabilitation and Health Care Center is a CMS-certified provider of Medicare and Medicaid.

Explore Open Rooms
1 Contact details
2 What type of senior care service are you looking for?
3 What budget do you have in mind for senior care?
4 How soon do you need to find care?
5 Additional details

Thank you for your interest!

Our team will be in touch shortly to help with next steps.