Peace Gardens Assisted Living
Nursing Home, Assisted Living, Memory Care & Nursing Care · Catonsville, MD
CMS overall rating Info CMS (the Centers for Medicare & Medicaid Services) is the federal agency that rates nursing home quality. Its Overall Rating runs from 1 to 5 stars, combining health inspections, staffing, and quality measures, with inspections weighted most heavily.

Peace Gardens Assisted Living

Nursing Home, Assisted Living, Memory Care & Nursing Care · Catonsville, MD
CMS overall rating Info CMS (the Centers for Medicare & Medicaid Services) is the federal agency that rates nursing home quality. Its Overall Rating runs from 1 to 5 stars, combining health inspections, staffing, and quality measures, with inspections weighted most heavily.
Calculator: See prices in your area
Peace Gardens Assisted Living accepts Medicare, Medicaid, and private pay.

Overview of Peace Gardens Assisted Living

Peace Gardens Assisted Living has dedicated professionals who provide each senior with respectful and dignified family-like treatment. A beautiful community that is quiet and calming, the assisted living home hints at a refreshing experience through its activities that make some of the residents feel young and secure in a home-like environment. The resident-centered approach prioritizes the wellness and well-being of each resident, promoting purposeful independence and cultivating individual growth.

Their featured services include assistance with daily living (ADLs), entertainment programs, transportation services, housekeeping, mobility assistance, healthy meals, and social activities. Specialized therapy programs including speech, occupational, and physical services. A memory care therapy program is also available for those in need.

Quality ratings

Measured by Centers for Medicare & Medicaid Services (CMS)

Overall rating Info The Overall CMS Rating combines results from health inspections, staffing levels and quality measures. Health inspections carry the most weight. Staffing and quality scores can increase or decrease the final rating based on performance compared to state and national standards.
At MD avg. At MD avg.MD average: 3.0Click the badge to see the full State ranking.Click here to see the full State ranking.
Health Inspection Info Based on the results of the facility's three most recent standard inspections and any complaint investigations. CMS reviews the number, scope, and severity of deficiencies, with more recent findings weighted more heavily.
▲ 6.5% Above MD avg. ▲ 6.5% Above MD avg.MD average: 2.8Click the badge to see the full State ranking.Click here to see the full State ranking.
Staffing Info Measures average nursing staff hours per resident per day, including Registered Nurses (RNs) and total nursing staff. Ratings are adjusted based on the level of care residents require and are compared to state and national benchmarks.
▼ 34.3% Below MD avg. ▼ 34.3% Below MD avg.MD average: 3.0Click the badge to see the full State ranking.Click here to see the full State ranking.
Quality Measures Info Based on clinical and physical health indicators reported to CMS, such as hospital readmissions, falls, pressure ulcers, and improvements in mobility. These measures reflect how well residents' health needs are being managed.
▲ 8.2% Above MD avg. ▲ 8.2% Above MD avg.MD average: 3.7Click the badge to see the full State ranking.Click here to see the full State ranking.

Staffing hours breakdown

Info Daily nursing hours per resident by staff type, reported to CMS. Higher is generally better — compare this facility to state and national averages to see where staffing stands.

Hours per resident per day — compared to Maryland state averages

Total nursing care / resident Info Total adjusted nursing hours per resident per day, combining RN, LPN, and aide time. CMS adjusts this for case-mix so facilities can be fairly compared.
3h 21m per day
This facility Maryland avg (3h 46m per day)
vs Maryland avg
-11%

4 of 6 metrics below state avg

Standout metric Weekend RN is +12% above state avg
Staff typeHours / Day / Residentvs state avg
Registered Nurse (RN) Info RNs hold the highest nursing license and can assess residents, interpret test results, and direct care plans. More RN hours per day often signals stronger clinical oversight and faster response to health changes. 47m per day ▼ 5% State avg: 49m per day · National avg: 41m per day
LPN / LVN Info Licensed Practical Nurses (LPNs) or Licensed Vocational Nurses (LVNs) deliver routine hands-on care — medication administration, wound dressing, and monitoring vital signs. They work under RN supervision and make up a large share of daily bedside care. 29m per day ▼ 46% State avg: 55m per day · National avg: 52m per day
Nurse Aide Info Certified Nurse Aides (CNAs) provide the most direct day-to-day assistance: bathing, dressing, feeding, and mobility. Nurse aide hours are typically the largest staffing category and directly affect residents' quality of life. 2h 11m per day ■ Avg State avg: 2h 8m per day · National avg: 2h 20m per day
Weekend Total Nursing Info Combined nursing hours (RN + LPN + Nurse Aide) per resident per day on weekends. Staffing often drops on weekends — this figure reveals whether the facility maintains adequate coverage outside of weekday hours. 3h 6m per day ▼ 12% State avg: 3h 31m per day · National avg: 3h 27m per day
Physical Therapist Info Hours per resident per day provided by licensed Physical Therapists (PTs) or PT Assistants. PT services help residents recover mobility after injury or illness and are especially important for post-acute (short-stay) rehabilitation. 4m per day ▼ 36% State avg: 6m per day · National avg: 4m per day
Weekend RN Info Registered nurse hours specifically on weekends. Facilities sometimes reduce RN presence on Saturdays and Sundays — a low weekend RN figure compared to weekday hours can indicate reduced clinical oversight when most administrative staff are absent. 41m per day ▲ 12% State avg: 37m per day · National avg: 29m per day

Capacity and availability

Avg. Length of Stay
189 days
Bed community size
47-bed community Rank #230 / 697Bed count — State benchmarkedThis home is ranked 230th out of 697 homes in Maryland. Shows this facility's certified or reported bed count compared to other Maryland facilities. Larger communities may offer more amenities, programs, and on-site services for residents and families.Rankings are based only on facilities in Maryland that report data for that category. Facilities without available data are excluded from the ranking.Click the rank badge to see the full State ranking.Click here to see the full State ranking.
A moderately sized community that may balance personal attention with shared amenities and social activities.
Years in operation
33 years in operation Rank #24 / 208Years in operation — State benchmarkedThis home is ranked 24th out of 208 homes in Maryland. Shows how long this facility has been in operation compared to other Maryland facilities. Longer operating histories may benefit residents, families, and staff.Rankings are based only on facilities in Maryland that report data for that category. Facilities without available data are excluded from the ranking.Click the rank badge to see the full State ranking.Click here to see the full State ranking.
A longer operating history, which may indicate experience navigating regulations and delivering ongoing care.
Walk Score
Walk Score: 60 / 100 Rank #316 / 985Walk Score — State benchmarkedThis home is ranked 316th out of 985 homes in Maryland. Shows how walkable this facility's neighborhood is compared to the average Walk Score across Maryland facilities. Higher scores benefit residents, families, and staff.Rankings are based only on facilities in Maryland that report data for that category. Facilities without available data are excluded from the ranking.Click the rank badge to see the full State ranking.Click here to see the full State ranking.
Moderately walkable. Some errands can be accomplished on foot, with a mix of nearby amenities.

About this community

Occupancy

Occupancy rate
86%
Higher than the Maryland average: 60%
Occupied beds
40 / 47
Average occupied beds in Maryland homes 104 beds

License Details

Facility TypeAl
CountyBaltimore

Ownership & Operating Entity

Profit StatusFor-profit
Nonprofit OwnershipNo

Room costs

Private Room $130 - $177 per day
Semi-Private Room $130 - $130 per day

Hospice Affiliations

AccentCare Hospice and Palliative Care of Maryland
Gilchrist Hospice Care

Staffing

Key information about the people who lead and staff this community.

Leadership

No CNA training program

Memory & Specialized Care

4 services
Dedicated Alzheimer's Unit
Mild Alzheimer's Level
Moderate Alzheimer's Level
Severe Alzheimer's Level

Contact Peace Gardens Assisted Living

Health Inspection History

Inspections since 2018
Total health inspections 4

Maryland average 3.9


Last Health inspection on Oct 2025
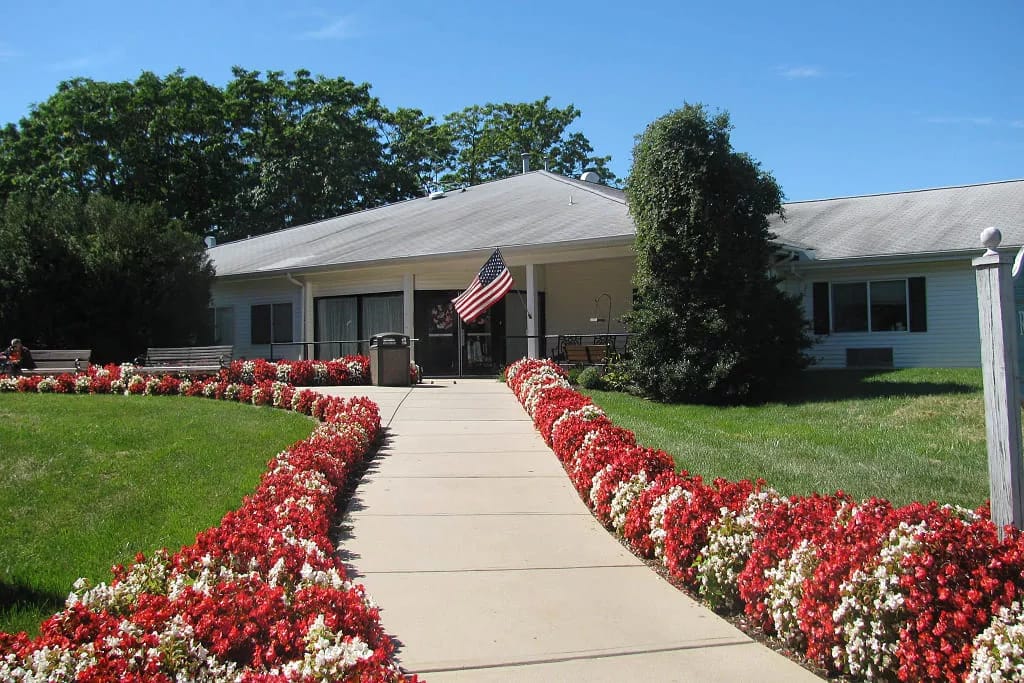
Total health citations
56 Rank #104 / 149Health citations — State benchmarkedThis home is ranked 104th out of 149 homes in Maryland. Shows this facility's total health deficiency citations benchmarked to the Maryland State average, with a ranking across all 149 MD facilities. Lower citation counts earn a better rank.Rankings are based only on facilities in Maryland that report data for that category. Facilities without available data are excluded from the ranking.Click the rank badge to see the full State ranking.Click here to see the full State ranking.

Maryland average 49.9

Citations per inspection
14

Maryland average 12.81


Health citations are formal notices following inspections when they fail to comply with safety and care standards.

53 of 56 citations resulted from standard inspections; 2 of 56 resulted from complaint investigations; and 1 of 56 came from combined inspections (standard and complaint).

Breakdown of citation severity (last 8 years)
Critical health citations
0
100% better than Maryland average

Maryland average: 0.5


Serious health citations
0
100% better than Maryland average

Maryland average: 0.6

0 critical citations Maryland average: 0.5

0 serious citations Maryland average: 0.6

54 moderate citations Maryland average: 47.2

2 minor citations Maryland average: 1.7
Citations history (last 8 years)
Abuse/Neglect moderate citation Oct 16, 2025

Care Planning moderate citation Oct 16, 2025

Abuse/Neglect moderate citation Nov 06, 2024
Corrected

Administration minor citation Nov 06, 2024
Corrected

Demographics

Resident demographic information for this facility.

Gender

  • Female 83.3%
  • Male 16.7%

Age Distribution

  • 75-84 37.5%
  • 85-94 29.2%
  • 65-74 20.8%
  • 95+ 8.3%
  • ≤64 4.2%

Ethnicity

  • White 58.3%
  • African American 41.7%

Infection Prevention & Vaccination

How this facility protects residents through staff vaccination policies and immunization practices.

Influenza Gold Star

Awarded by the Maryland Health Care Commission (MHCC) to healthcare facilities that achieve a high influenza vaccination rate.

Staffing Data

Reporting period: October 1 – December 31, 2025 (Q4 2025). Source: CMS Payroll-Based Journal report.

Total staff 105
Employees 75
Contractors 30
Staff to resident ratio 1.91 : 1
5% more staff per resident than Maryland average
Maryland average ratio: 1.81 : 1 Maryland average ratio: 1.81 : 1See full Maryland ranking
Avg staff/day 29
Average shift 7.1 hours
11% worse than Maryland average
Maryland average: 8 hours Maryland average shift: 8 hoursSee full Maryland ranking
Total staff hours (quarter) 18,923

Nursing staff breakdown

Q4 2025 · Oct 1 – Dec 31 More info This data comes from the CMS Payroll-Based Journal report covering October 1 – December 31, 2025.
Registered Nurse

Manages medical care and health needs.

RN Staff Info 11 total: 9 full-time employees and 2 contractors. 11
Average shift length Info Average shift length. Calculated as total hours divided by days worked and average staff per day. 8.4 hours
Licensed Practical Nurse

Assists with medical care and medications.

LPN Staff Info 8 total: 7 full-time employees and 1 contractor. 8
Average shift length Info Average shift length. Calculated as total hours divided by days worked and average staff per day. 7.6 hours
Certified Nursing Assistant

Helps with daily care and mobility.

CNA Staff Info 54 total: 30 full-time employees and 24 contractors. 54
Average shift length Info Average shift length. Calculated as total hours divided by days worked and average staff per day. 7.5 hours

Contractor staffing

Q4 2025 · Oct 1 – Dec 31 More info This data comes from the CMS Payroll-Based Journal report covering October 1 – December 31, 2025.

Total hours from contractors

4.5%

859 contractor hours this quarter

Certified Nursing Assistant: 24 Registered Nurse: 2 Licensed Practical Nurse: 1 Medical Director: 1 Occupational Therapy Aide: 1 Occupational Therapy Assistant: 1

Staff by category

Q4 2025 · Oct 1 – Dec 31 More info This data comes from the CMS Payroll-Based Journal report covering October 1 – December 31, 2025.
Certified Nursing Assistant3024548,76092100%7.5
Registered Nurse92113,07692100%8.4
Licensed Practical Nurse7181,8349199%7.6
Medication Aide/Technician7071,4728997%7.6
Dietitian2026096773%6.5
Administrator1015126470%8
RN Director of Nursing1014565762%8
Physical Therapy Aide1014145964%7
Nurse Practitioner1014005054%8
Mental Health Service Worker2023364751%7.1
Respiratory Therapy Technician4042927379%4
Physical Therapy Assistant2022216166%3.5
Clinical Nurse Specialist1011786773%2.6
Qualified Social Worker5051694549%3.8
Occupational Therapy Aide011801011%8
Speech Language Pathologist202522325%2.3
Medical Director011451213%3.8
Occupational Therapy Assistant0111833%6
54 Certified Nursing Assistant
% of Days 100%
11 Registered Nurse
% of Days 100%
8 Licensed Practical Nurse
% of Days 99%
7 Medication Aide/Technician
% of Days 97%
2 Dietitian
% of Days 73%
1 Administrator
% of Days 70%
1 RN Director of Nursing
% of Days 62%
1 Physical Therapy Aide
% of Days 64%
1 Nurse Practitioner
% of Days 54%
2 Mental Health Service Worker
% of Days 51%
4 Respiratory Therapy Technician
% of Days 79%
2 Physical Therapy Assistant
% of Days 66%
1 Clinical Nurse Specialist
% of Days 73%
5 Qualified Social Worker
% of Days 49%
1 Occupational Therapy Aide
% of Days 11%
2 Speech Language Pathologist
% of Days 25%
1 Medical Director
% of Days 13%
1 Occupational Therapy Assistant
% of Days 3%

Penalties and fines

Includes penalties issued in 2024

Federal penalties imposed by CMS for regulatory violations, including civil money penalties (fines) and denials of payment for new Medicare/Medicaid admissions.

Source: CMS Penalties Database (Data as of Jan 2026)

Total fines amount $38K
38% lower than Maryland average

Maryland average: $61K

Number of fines 1
33% fewer fines than Maryland average

Maryland average: 1.5

Payment Denials Info Serious action where Medicare and/or Medicaid temporarily stops payments for new residents until issues are fixed. 0
100% fewer payment denials than Maryland average

Maryland average: 0.1

Fines amount comparison
This facility $38K
Maryland average $61K
Penalty History

Penalties are imposed by CMS for violations of federal nursing home regulations.

1 penalty in the past 3 years

Nov 6, 2024 · $38K

Civil Money Penalty Info Fines imposed for noncompliance, which can be assessed per day or per instance of violation. Nov 6, 2024
$38K

Last updated: Jan 2026

Quality of care over time

These measures show how residents usually do over time at this home, based on health outcomes and preventive care.

High-risk clinical events score Info A composite score based on pressure ulcers, falls with injury, weight loss, walking ability decline, and activities of daily living decline. 17.2
33% worse than Maryland average

Maryland average: 12.9

Functional decline score Info A composite score based on activities of daily living decline, walking ability decline, and incontinence. 36.1
41% worse than Maryland average

Maryland average: 25.7

Long-stay resident measures
Need for Help with Daily Activities Increased Info Percent of long-stay residents whose need for help with daily activities has increased 28.7%
21% worse than Maryland average

Maryland average: 23.7%

Walking Ability Worsened Info Percent of long-stay residents whose ability to move independently worsened 47.2%
70% worse than Maryland average

Maryland average: 27.7%

Low Risk Residents with Bowel/Bladder Incontinence Info Percent of low risk long-stay residents who lose control of their bowels or bladder 32.4%
25% worse than Maryland average

Maryland average: 25.9%

Falls with Major Injury Info Percent of long-stay residents experiencing one or more falls with major injury 0.5%
77% better than Maryland average

Maryland average: 2.3%

High Risk Residents with Pressure Ulcers Info Percent of long-stay high risk residents with pressure ulcers 4.8%
26% better than Maryland average

Maryland average: 6.5%

Urinary Tract Infection Info Percent of long-stay residents with a urinary tract infection 0.5%
67% better than Maryland average

Maryland average: 1.6%

Lost Too Much Weight Info Percent of long-stay residents who lose too much weight 4.8%
18% better than Maryland average

Maryland average: 5.8%

Depressive Symptoms Info Percent of long-stay residents who have depressive symptoms 22.9%
13% worse than Maryland average

Maryland average: 20.2%

Antipsychotic Use Info Percent of long-stay residents who received an antipsychotic medication 16.0%
23% worse than Maryland average

Maryland average: 12.9%

Pneumococcal Vaccine Info Percent of long-stay residents assessed and appropriately given the pneumococcal vaccine 73.5%
20% worse than Maryland average

Maryland average: 92.0%

Influenza Vaccine Info Percent of long-stay residents assessed and appropriately given the seasonal influenza vaccine 66.7%
31% worse than Maryland average

Maryland average: 96.6%

Short-stay resident measures
Pneumococcal Vaccine Info Percent of short-stay residents assessed and appropriately given the pneumococcal vaccine 36.8%
53% worse than Maryland average

Maryland average: 78.4%

Antipsychotic medication increase Info Percent of short-stay residents who newly received an antipsychotic medication 1.6%
15% worse than Maryland average

Maryland average: 1.4%

Influenza Vaccine Info Percent of short-stay residents assessed and appropriately given the seasonal influenza vaccine 40.9%
49% worse than Maryland average

Maryland average: 80.6%

Breakdown by payment type

Medicare

83% of new residents, usually for short-term rehab.

Typical stay 1 months

Private pay

13% of new residents, often for short stays.

Typical stay 3 - 4 months

Medicaid

4% of new residents, often for long-term daily care.

Typical stay 9 years

Facility Characteristics

Source: CMS Long-Term Care Facility Characteristics (Data as of Jan 2026)

Total residents 55
Medicare
6
10.9% of residents
Medicaid
46
83.6% of residents
Private pay or other
3
5.5% of residents
Programs & Services
Residents Group

Residents meet regularly to discuss policies, care quality, and activities

Active Resident Council

Organized group of residents that meets regularly to discuss facility policies, quality of life, and activities.

Finances and operations

Based on CMS SNF Cost Report for fiscal year ending in 12/2023.

For-profit
Operated by a single business entity.
Net patient revenue Info Net patient revenue — what the home actually collects for resident care, after contractual allowances, bad debt and discounts are subtracted from its gross charges (CMS cost report, Worksheet G-3). It covers resident care only; money the home earns from other sources is shown separately as "Other income."
$8.8M
Net patient income Info Net patient income: net patient revenue minus the home's total operating expenses. A positive figure means it earns more from resident care than it spends to deliver it; a negative figure means the opposite. It excludes non-operating "other income."
-$146.4K
For-profit Operated by a single business entity.
Net patient revenue Info Net patient revenue — what the home actually collects for resident care, after contractual allowances, bad debt and discounts are subtracted from its gross charges (CMS cost report, Worksheet G-3). It covers resident care only; money the home earns from other sources is shown separately as "Other income."
$8.8M
Net patient income Info Net patient income: net patient revenue minus the home's total operating expenses. A positive figure means it earns more from resident care than it spends to deliver it; a negative figure means the opposite. It excludes non-operating "other income."
-$146.4K
Other income Info Money the home earns outside of resident care — such as investments, grants, rentals and other non-operating sources (CMS cost report, Worksheet G-3). It is tracked separately from net patient revenue: it is not part of that figure, and it is not included in net patient income.
$59.3K
Payroll costs Info Staff salaries plus wage-related costs — benefits such as payroll taxes, health insurance and retirement — from the home's own accounting records (CMS cost report, Worksheet A). Contract or agency labor is counted separately, under other operating costs.
$4.5M 51.1% of net patient revenue Info Payroll as a share of revenue: staff salaries and wage-related benefits divided by net patient revenue. A higher figure means more of each revenue dollar goes to staff pay.
Other operating costs Info Everything it costs to run the home apart from payroll — food, utilities, supplies, maintenance, contract labor and administration. Calculated as total operating expense minus payroll (staff salaries and wage-related benefits).
$4.4M
Total costs Info The home's total operating expense for the year — all the costs of running it, salaries included (CMS cost report, Worksheet G-3).
$8.9M

What does this home offer?

Pets allowed icon
Pets allowed icon

Pets Allowed

Building type icon
Building type icon

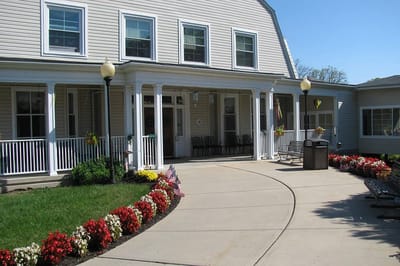
Building Type: Two-storey

Transportation services icon

Transportation Services

Fitness and recreation icon

Fitness and Recreation

Who this home usually serves

TYPE OF STAY

Mostly short-term rehab stays

Most residents typically stay for a few weeks or months before returning home or moving on.

Most new residents arrive under Medicare (83% of admissions), and a typical Medicare stay runs around 1 months.

Admissions
132 total

Coverage residents most often arrive under.

Medicare 83%
Private pay 13%
Medicaid 4%
Discharges
118 total

Coverage residents most often leave under.

Medicare 76%
Private pay 17%
Medicaid 7%

Places of interest near Peace Gardens Assisted Living

Address 1.5 miles from city center Info Estimated distance in miles from Catonsville's city center to Peace Gardens Assisted Living's address, calculated via Google Maps. — 2.32 miles to nearest hospital (Ascension Saint Agnes Hospital)

Calculate Travel Distance to Peace Gardens Assisted Living

Add your location

Address

Compare Assisted Living around Catonsville

The information below is reported by the Maryland Department of Health, Office of Health Care Quality.

Peace Gardens Assisted Living
AL
NH
MC
NC
Catonsville -
47
Facility 47
MD AVG 43
Rank #230 / 697
-
60
Facility 60
MD AVG 43
Rank #316 / 985
-
The Waterfalls of Catonsville
AL
NH
MC
Catonsville (Colonial Gardens) -
4
Facility 4
MD AVG 43
Rank #601 / 697
-
56
Facility 56
MD AVG 43
Rank #357 / 985
Suite
Golden Oasis Senior Living II
AL
NH
HC
Elkridge (West Elkridge) -
70
Facility 70
MD AVG 43
Rank #191 / 697
-
12
Facility 12
MD AVG 43
Rank #802 / 985
Private / Semi-Private Rooms

Financial Assistance for
Assisted Living in Maryland

Peace Gardens Assisted Living is located in Catonsville, Maryland.
Here are the financial assistance programs available to residents in Maryland.

Get Financial aid guidance

Community Options Waiver

Maryland Medicaid Community Options Waiver

Age 65+ or disabled
General Maryland resident, Medicaid- eligible, nursing home-level care need.
Income Limits (2025) ~$2,829/month 300% FBR, individual
Asset Limits $2,000 (individual), $3,000 (couple) (excludes home, car).
MD

High urban demand; rural outreach efforts.

Benefits
Personal care (5-7 hours/day, e.g., bathing, dressing) Respite care (up to 240 hours/year) Adult day care ($70/day) Home modifications ($1,500 avg.)

Senior Care Program

Maryland Senior Care

Age 65+
General Maryland resident, at risk of nursing home placement.
Income Limits ~$2,000/month individual, varies by county
Asset Limits $11,000 individual
MD

Limited funding; waitlists common in high-demand areas.

Benefits
In-home care (3-5 hours/week) Respite care (up to 10 days/year) Meals (~$6/meal) Transportation (~5 trips/month) Case management

Maryland Nursing Home Medicaid

Maryland Medical Assistance (Medicaid) Nursing Home Program

Age 65+
General Maryland resident, Medicaid-eligible, requires nursing home-level care.
Income Limits (2025) $943/month (individual); most income applied to care costs.
Asset Limits $2,500 (individual), $3,000 (couple); spousal protections up to $155,356.
MD

Home equity limit $636,000; estate recovery applies post-55.

Benefits
24/7 nursing care Meals Therapy Medications (unlimited per medical need)

Senior Assisted Living Subsidy Program

Maryland Senior Assisted Living Group Home Subsidy

Age 62+
General Maryland resident, in or moving to approved assisted living, low/moderate income.
Income Limits (2025) ~$34,000/year individual, varies by county
Asset Limits Not strict; prioritizes low-income.
MD

Not available statewide; facility must be licensed by MDH.

Benefits
Personal care Meals 24-hour supervision (up to $1,500/month subsidy typical)

Veterans Aid and Attendance (A&A) Benefit

Maryland VA Aid and Attendance

Age
General Wartime veteran/spouse, age 65+ or disabled, needs ADL help, Maryland resident.
Income Limits (2025) Net income minus medical expenses < $1,984/month individual with A&A
Asset Limits $155,356 net worth limit
MD

High veteran population in suburban/rural areas.

Benefits
Cash benefit ($1,478-$2,471/month, varies by status) for care costs

Senior Prescription Drug Assistance Program (SPDAP)

Maryland Senior Prescription Drug Assistance Program

Age 65+
General Maryland resident (6+ months), Medicare Part D enrolled.
Income Limits (2025) $48,560/year individual, 300% FPL
Asset Limits None specified.
MD

Supplements Medicare Part D; annual enrollment required.

Benefits
Up to $40/month premium subsidy Reducing drug costs

Medicare Savings Programs (MSP)

Maryland Medicare Savings Programs

Age 65+
General Maryland resident, Medicare Part A/B enrollee.
Income Limits (2025) $2,014/month (QMB), $2,706/month (SLMB/QI, individual).
Asset Limits $9,090 (individual), $13,630 (couple).
MD

Includes QMB, SLMB, QI categories.

Benefits
Covers premiums (up to $174.70/month Part B) Co-pays Deductibles

Community Personal Assistance Services (CPAS)

Maryland Medicaid Community Personal Assistance Services

Age 65+
General Maryland resident, Medicaid-eligible, needs ADL assistance.
Income Limits (2025) $943/month (individual); spend-down available.
Asset Limits $2,500 (individual), $3,000 (couple).
MD

Consumer-directed option allows hiring family caregivers.

Benefits
Personal care (hours vary, typically 20-30/week) Chores Nurse supervision

Frequently Asked Questions about Peace Gardens Assisted Living

Is Peace Gardens Assisted Living in a walkable area?

Peace Gardens Assisted Living has a walk score of 60. Moderately walkable. Some errands can be accomplished on foot, with a mix of nearby amenities.

What is the occupancy rate at Peace Gardens Assisted Living?

Peace Gardens Assisted Living's occupancy is 86%.

Does Peace Gardens Assisted Living operate as a for-profit or non-profit?

Peace Gardens Assisted Living is registered as a for-profit in MD.

How many beds does Peace Gardens Assisted Living have?

Peace Gardens Assisted Living has 47 beds.

Are there photos of Peace Gardens Assisted Living?

Yes — there are 5 photos of Peace Gardens Assisted Living in the photo gallery on this page.

What is the address of Peace Gardens Assisted Living?

Peace Gardens Assisted Living is located at 5741 Edmondson Ave, Catonsville, MD 21228.

What is the phone number of Peace Gardens Assisted Living?

(410) 747-1700 will put you in contact with the team at Peace Gardens Assisted Living.

Guides for Better Senior Living

Care Cost Calculator: See Prices in Your Area

Nursing Home Data Explorer

Don’t Wait Too Long: 7 Red Flag Signs Your Parent Needs Assisted Living Now

The True Cost of Assisted Living in 2025 – And How Families Are Paying For It

Understanding Senior Living Costs: Pricing Models, Discounts & Financial Assistance