Pine Berry Senior
Nursing Home & Independent Living · Florida, FL
CMS overall rating Info The Overall CMS Rating is scored from 1 to 5 stars and combines results from health inspections, staffing levels, and quality measures. Health inspections carry the most weight. Staffing and quality scores can increase or decrease the final rating based on performance compared to state and national standards.

Pine Berry Senior

Nursing Home & Independent Living · Florida, FL
CMS overall rating Info The Overall CMS Rating is scored from 1 to 5 stars and combines results from health inspections, staffing levels, and quality measures. Health inspections carry the most weight. Staffing and quality scores can increase or decrease the final rating based on performance compared to state and national standards.
Calculator: See prices in your area
Pine Berry Senior accepts Medicare, Medicaid, and private pay.

Overview of Pine Berry Senior

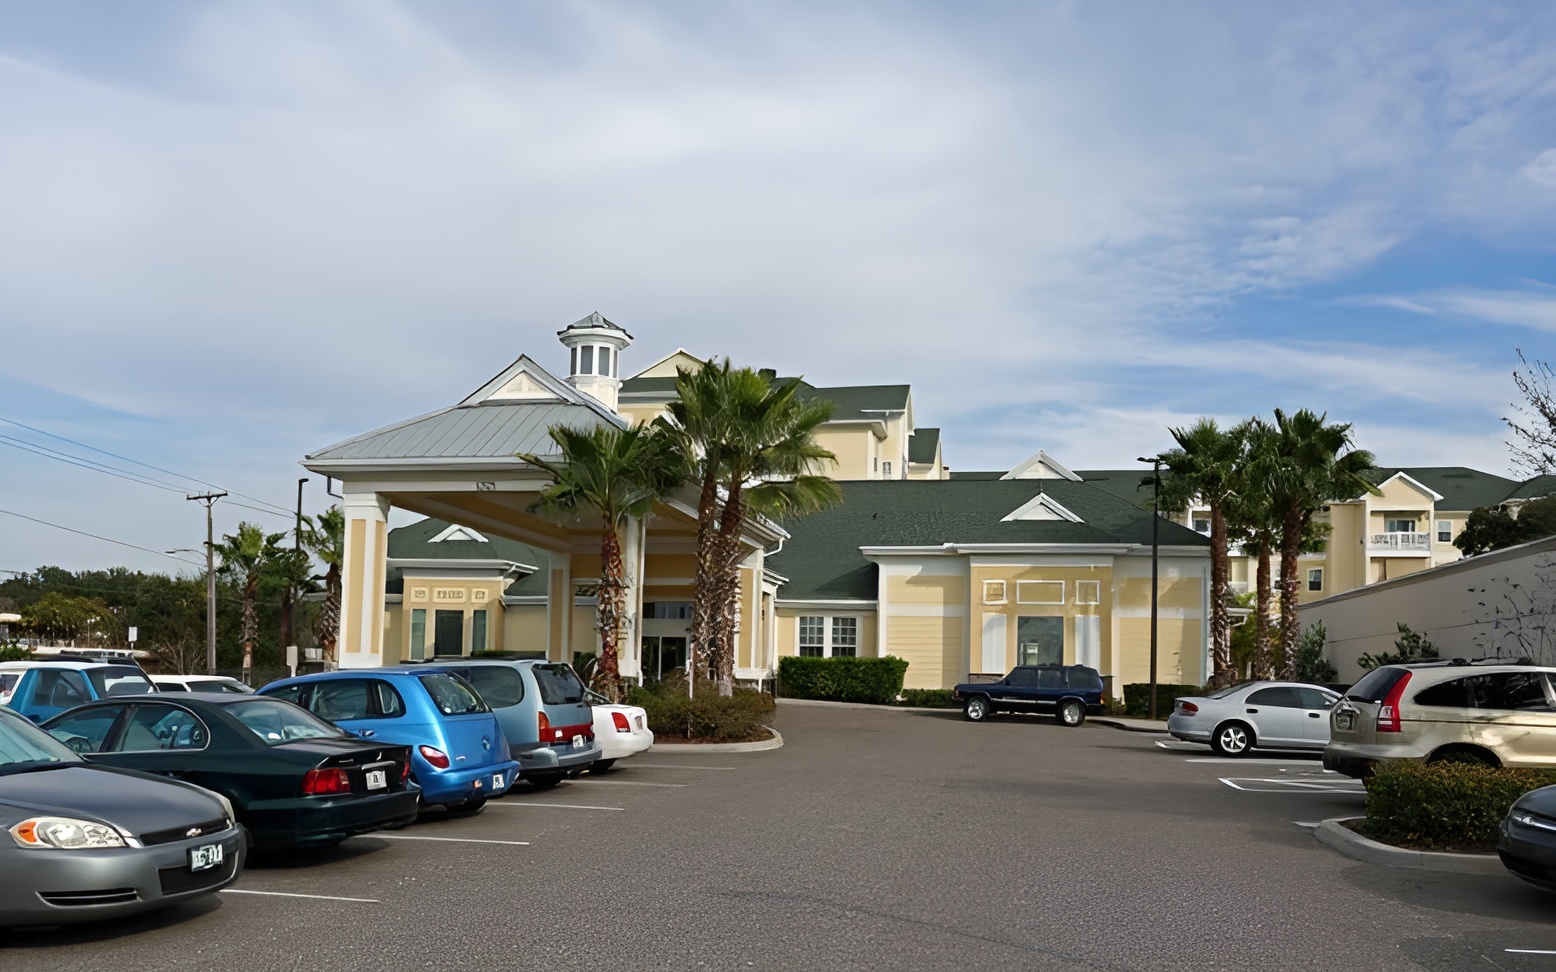
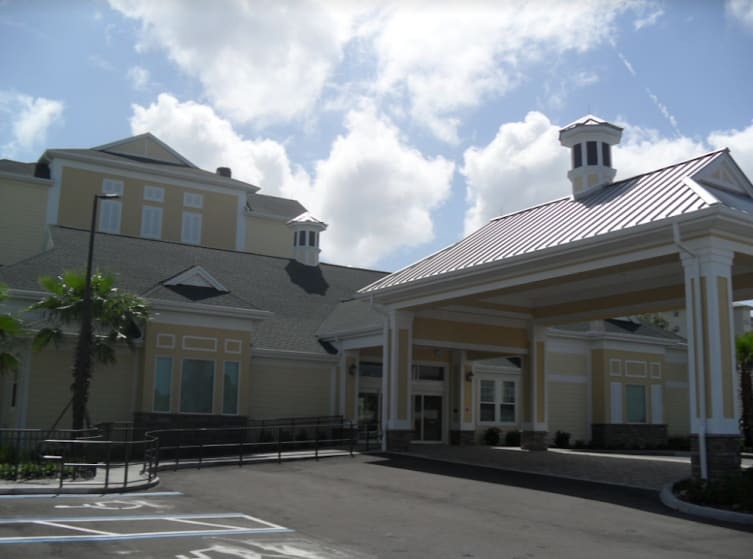
Make the most of your best years at Pine Berry Senior Apartments, a purposely built 55+ community in Clearwater, FL, offering independent living. The community has beautifully furnished and spacious one- and two-bedroom floor plans, dedicated to residents’ comfort and convenience. 24-hour emergency maintenance and laundry spaces are also available, ensuring residents have a hassle-free lifestyle.

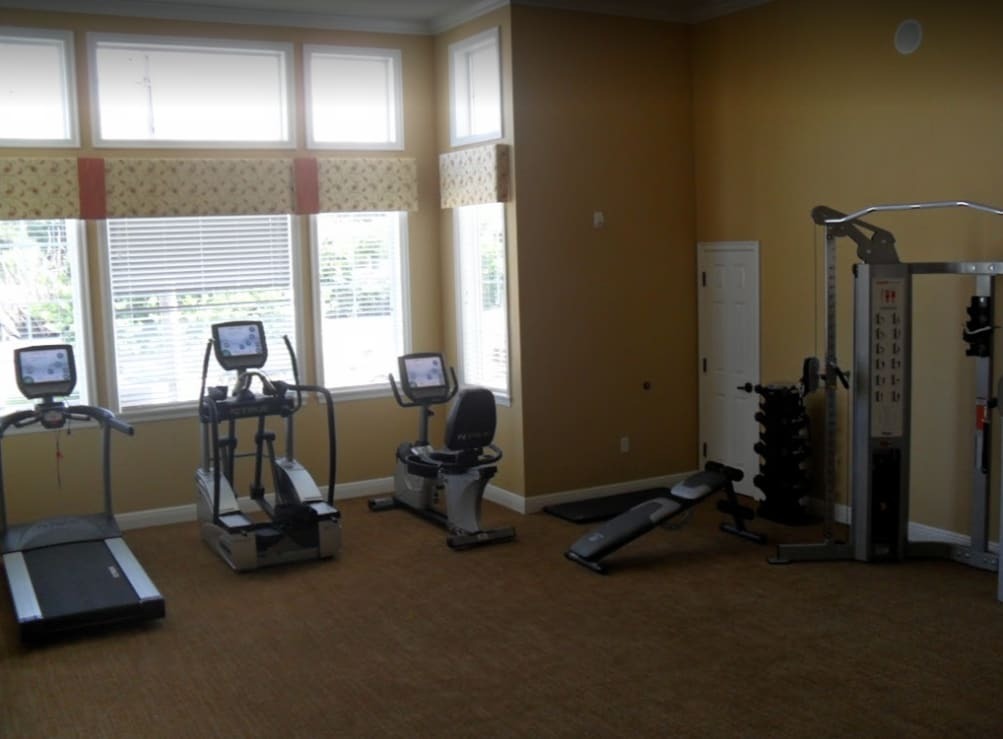
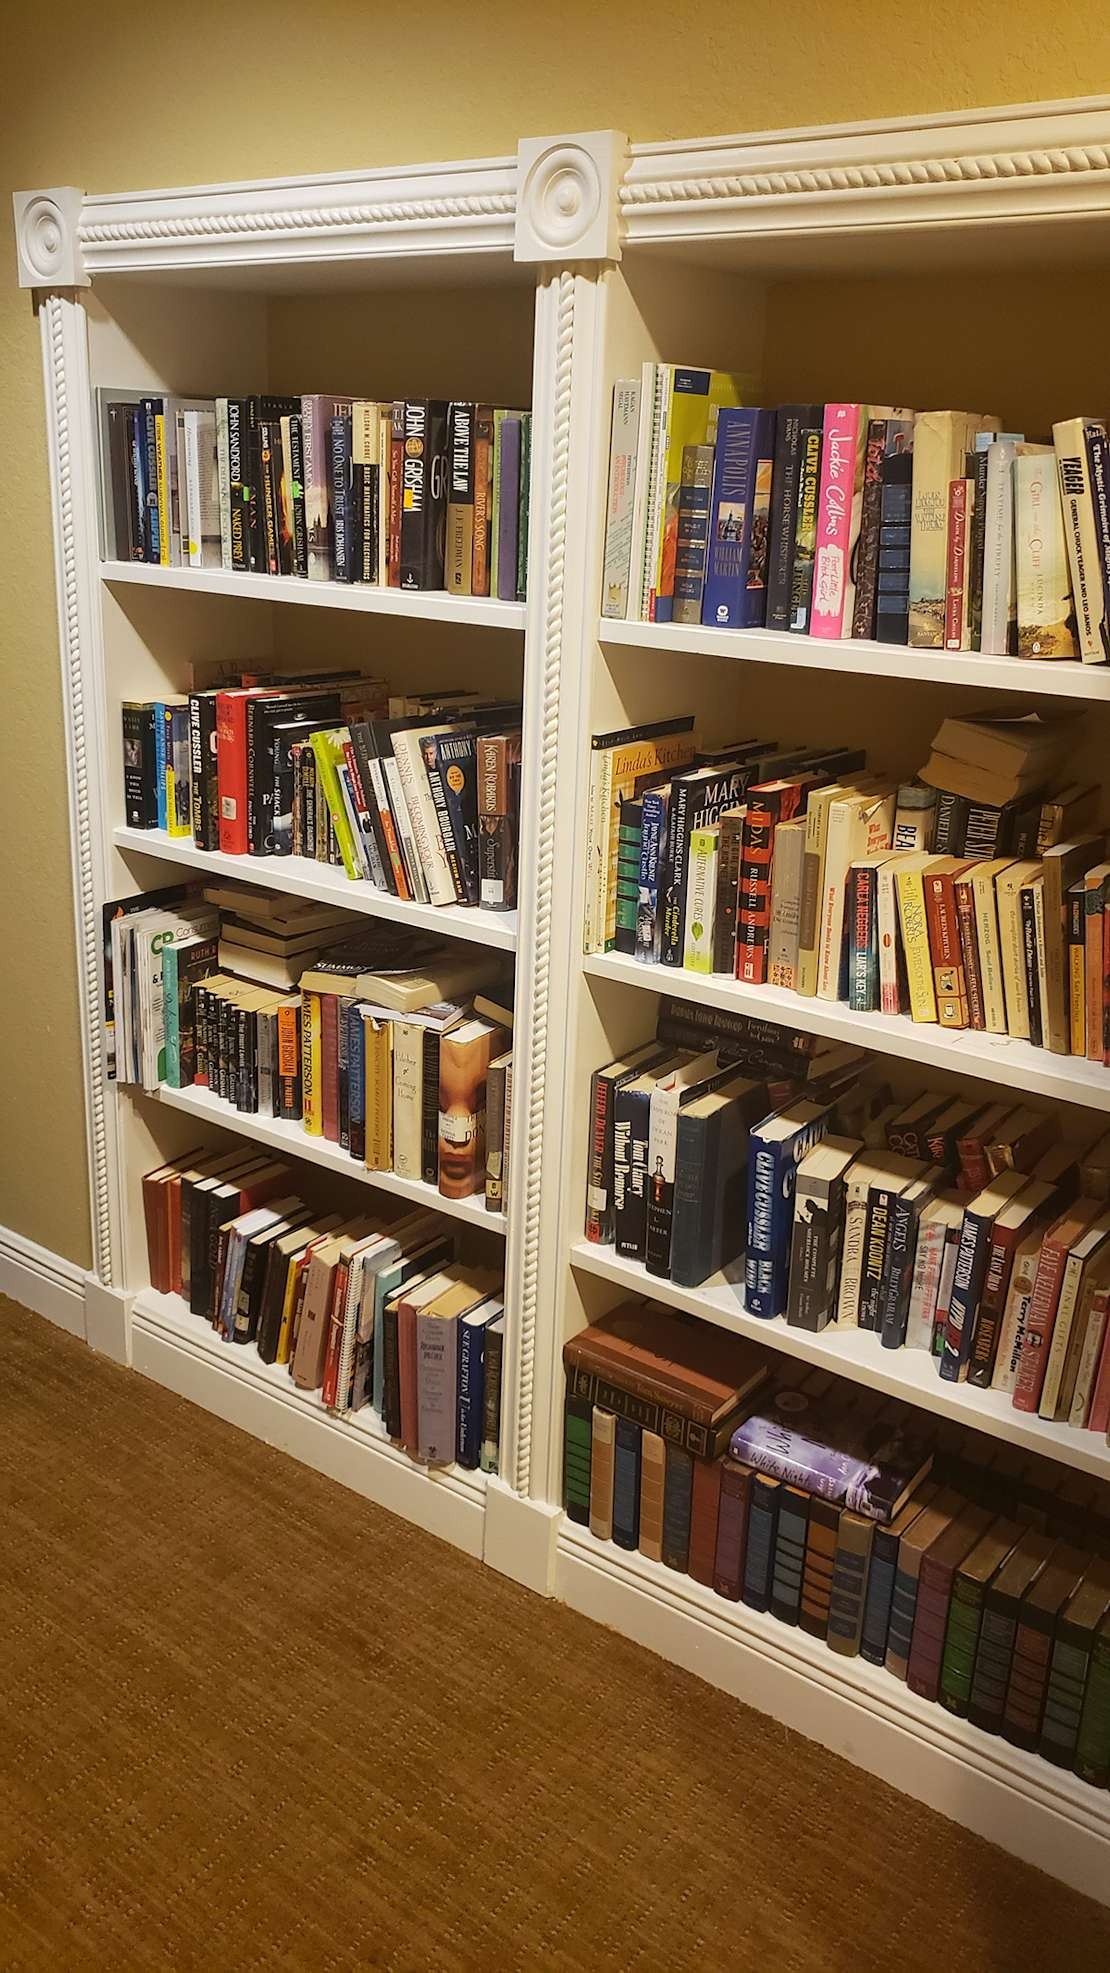
Residents will not run out of things to do for leisure and wellness with a variety of recreational opportunities and welcoming communal spaces. Residents also enjoy plenty of dining options with delightful restaurants and shops nearby. Amenities include a movie theater, a business center, a library, a clubhouse, and a swimming pool.

Quality ratings

Measured by Centers for Medicare & Medicaid Services (CMS)

Overall rating Info The Overall CMS Rating combines results from health inspections, staffing levels and quality measures. Health inspections carry the most weight. Staffing and quality scores can increase or decrease the final rating based on performance compared to state and national standards.
▼ 68.5% Below FL avg. ▼ 68.5% Below FL avg.Click the badge to see the full State ranking.Click here to see the full State ranking.
Health Inspection Info Based on the results of the facility's three most recent standard inspections and any complaint investigations. CMS reviews the number, scope, and severity of deficiencies, with more recent findings weighted more heavily.
▼ 64.4% Below FL avg. ▼ 64.4% Below FL avg.Click the badge to see the full State ranking.Click here to see the full State ranking.
Staffing Info Measures average nursing staff hours per resident per day, including Registered Nurses (RNs) and total nursing staff. Ratings are adjusted based on the level of care residents require and are compared to state and national benchmarks.
▼ 40.9% Below FL avg. ▼ 40.9% Below FL avg.Click the badge to see the full State ranking.Click here to see the full State ranking.
Quality Measures Info Based on clinical and physical health indicators reported to CMS, such as hospital readmissions, falls, pressure ulcers, and improvements in mobility. These measures reflect how well residents' health needs are being managed.
▼ 26.1% Below FL avg. ▼ 26.1% Below FL avg.Click the badge to see the full State ranking.Click here to see the full State ranking.

Staffing hours breakdown

Info Daily nursing hours per resident by staff type, reported to CMS. Higher is generally better — compare this facility to state and national averages to see where staffing stands.

Hours per resident per day — compared to Florida state averages

Total nursing care / resident Info This home is ranked 214th out of 252 homes in Florida. Total adjusted nursing hours per resident per day, combining RN, LPN, and aide time. CMS adjusts this for case-mix so facilities can be fairly compared.
3h 31m per day
Rank #214 / 252Nurse hours — State benchmarkedThis home is ranked 214th out of 252 homes in Florida. Shows adjusted nurse hours per resident per day benchmarked to the Florida average, with a ranking across 252 Florida SNFs. More hours mean more direct care. The national average is about 3.5 hrs; below 3.0 is a red flag.Click the rank badge to see the full State ranking.Click here to see the full State ranking.
This facility Florida avg (4h 2m per day)
vs Florida avg
-13%
Staff typeHours / Day / Residentvs state avg
Weekend Total Nursing Info Combined nursing hours (RN + LPN + Nurse Aide) per resident per day on weekends. Staffing often drops on weekends — this figure reveals whether the facility maintains adequate coverage outside of weekday hours. 3h 2m per day

Types of Care at Pine Berry Senior

Independent Living

Capacity and availability

This home usually has limited availability

Occupancy between 85% and 95% suggests balanced demand.

Higher occupancy than the Florida average: 84.3%
Occupancy rate 90% Rank #113 / 255Occupancy rate — State benchmarkedThis home is ranked 113th out of 255 homes in Florida. Shows this facility's occupancy rate versus the Florida average, with its Statewide rank out of 255. Higher occupancy signals strong local demand and financial stability.Click the rank badge to see the full State ranking.Click here to see the full State ranking.
Avg. Length of Stay 159 days
Occupancy rate
90% Rank #113 / 255Occupancy rate — State benchmarkedThis home is ranked 113th out of 255 homes in Florida. Shows this facility's occupancy rate versus the Florida average, with its Statewide rank out of 255. Higher occupancy signals strong local demand and financial stability.Click the rank badge to see the full State ranking.Click here to see the full State ranking.
Avg. Length of Stay
159 days
Walk Score
Walk Score: 64 / 100 Rank #290 / 1486Walk Score — State benchmarkedThis home is ranked 290th out of 1486 homes in Florida. Shows how walkable this facility's neighborhood is compared to the average Walk Score across Florida SNFs. Higher scores benefit residents, families, and staff.Click the rank badge to see the full State ranking.Click here to see the full State ranking.
Moderately walkable. Some errands can be accomplished on foot, with a mix of nearby amenities.

About this community

About the Community

Apartments feature ceramic tile in bathrooms and kitchens, patios or balconies, updated appliances, and emergency call systems.

Safety & Compliance

Emergency SystemsYes
Safety FeaturesEmergency Call System, 24 Hour Emergency Maintenance

Additional Policies & Features

Pets Allowed
Minimum Age55+

Amenities & Lifestyle

Fitness Center
Gym
Swimming Pool
Library
Spa
Restaurant
Garden
Patio
Movie Theater
Laundry
ActivitiesThe community hosts various activities in the event-filled clubhouse, encouraging social engagement among residents.
Wellness ProgramAccess to a fully equipped fitness center for maintaining wellness routines.
Specific ProgramsResidents, Lease Now
Operating HoursMonday: 9 AM to 5 PM, Tuesday: Closed, Wednesday: 9 AM to 5 PM, Thursday: Closed, Friday: 9 AM to 5 PM, Saturday: Closed, Sunday: Closed, Tuesday & Thursday: By Appointment Only, Closed Daily for Lunch: 1pm-2pm

Contact Pine Berry Senior

Staffing Data

Reporting period: October 1 – December 31, 2025 (Q4 2025). Source: CMS Payroll-Based Journal report.

Total staff 138
Employees 108
Contractors 30
Staff to resident ratio 1.31:1
11% worse than Florida average
Florida average ratio: 1.47:1 Florida average ratio: 1.47:1See full Florida ranking
Avg staff/day 51
Average shift 7.7 hours
0% compared with Florida average
Florida average: 7.9 hours Florida average shift: 7.9 hoursSee full Florida ranking
Total staff hours (quarter) 35,957

Nursing staff breakdown

Q4 2025 · Oct 1 – Dec 31 More info This data comes from the CMS Payroll-Based Journal report covering October 1 – December 31, 2025.
Registered Nurse

Manages medical care and health needs.

RN Staff 11
Average shift length Info Average shift length. Calculated as total hours divided by days worked and average staff per day. 7.4 hours

This role is partially covered by contractors.

Licensed Practical Nurse

Assists with medical care and medications.

LPN Staff 21
Average shift length Info Average shift length. Calculated as total hours divided by days worked and average staff per day. 7.9 hours

No contractors work on this role.

Certified Nursing Assistant

Helps with daily care and mobility.

CNA Staff 61
Average shift length Info Average shift length. Calculated as total hours divided by days worked and average staff per day. 8 hours

No contractors work on this role.

Contractor staffing

Q4 2025 · Oct 1 – Dec 31 More info This data comes from the CMS Payroll-Based Journal report covering October 1 – December 31, 2025.

Total hours from contractors

11%

3,938 contractor hours this quarter

Speech Language Pathologist: 7 Qualified Social Worker: 5 Respiratory Therapy Technician: 5 Physical Therapy Aide: 5 Physical Therapy Assistant: 4 Therapeutic Recreation Specialist: 1 Registered Nurse: 1 Occupational Therapy Assistant: 1 Medical Director: 1

Staff by category

Q4 2025 · Oct 1 – Dec 31 More info This data comes from the CMS Payroll-Based Journal report covering October 1 – December 31, 2025.
Certified Nursing Assistant6106118,97592100%8
Licensed Practical Nurse210215,75092100%7.9
RN Director of Nursing4042,0389199%8.1
Registered Nurse101112,0308997%7.4
Speech Language Pathologist0771,0447278%6.1
Physical Therapy Assistant0448347986%6.3
Physical Therapy Aide0557907683%7.1
Respiratory Therapy Technician0556367278%6.6
Dietitian1015467480%7.4
Clinical Nurse Specialist2024906166%7.9
Administrator1014806065%8
Nurse Practitioner1014515762%7.9
Mental Health Service Worker1014485661%8
Other Dietary Services Staff4044245459%7.8
Qualified Social Worker0554136571%6.4
Nurse Aide in Training1012172932%7.5
Occupational Therapy Aide1011762628%6.8
Therapeutic Recreation Specialist0111382022%6.9
Occupational Therapy Assistant011561112%5.1
Medical Director0112333%7.5
61 Certified Nursing Assistant
% of Days 100%
21 Licensed Practical Nurse
% of Days 100%
4 RN Director of Nursing
% of Days 99%
11 Registered Nurse
% of Days 97%
7 Speech Language Pathologist
% of Days 78%
4 Physical Therapy Assistant
% of Days 86%
5 Physical Therapy Aide
% of Days 83%
5 Respiratory Therapy Technician
% of Days 78%
1 Dietitian
% of Days 80%
2 Clinical Nurse Specialist
% of Days 66%
1 Administrator
% of Days 65%
1 Nurse Practitioner
% of Days 62%
1 Mental Health Service Worker
% of Days 61%
4 Other Dietary Services Staff
% of Days 59%
5 Qualified Social Worker
% of Days 71%
1 Nurse Aide in Training
% of Days 32%
1 Occupational Therapy Aide
% of Days 28%
1 Therapeutic Recreation Specialist
% of Days 22%
1 Occupational Therapy Assistant
% of Days 12%
1 Medical Director
% of Days 3%

Penalties and fines

Includes penalties issued in 2023-2025

Federal penalties imposed by CMS for regulatory violations, including civil money penalties (fines) and denials of payment for new Medicare/Medicaid admissions.

Source: CMS Penalties Database (Data as of Jan 2026)

Total fines amount $269K Rank #252 / 257Federal fines — State benchmarkedThis home is ranked 252nd out of 257 homes in Florida. Shows this facility's cumulative CMS federal fine dollars versus the Florida average among facilities with fines, and where it ranks among 257 skilled nursing facilities in the pool. Lower total dollars mean a better rank.Click the rank badge to see the full State ranking.Click here to see the full State ranking.
273% higher than Florida average

Florida average: $72K

Number of fines 3
14% more fines than Florida average

Florida average: 2.6

Payment Denials Info Serious action where Medicare and/or Medicaid temporarily stops payments for new residents until issues are fixed. 0
100% fewer payment denials than Florida average

Florida average: 0.1

Fines amount comparison
This facility $269K
Florida average $72K
Penalty History

Penalties are imposed by CMS for violations of federal nursing home regulations.

2 penalties in the past 3 years

Multiple penalties were reported in the last 3 years.

Civil Money Penalty Info Fines imposed for noncompliance, which can be assessed per day or per instance of violation. Apr 17, 2025
$179K
Civil Money Penalty Info Fines imposed for noncompliance, which can be assessed per day or per instance of violation. Nov 8, 2023
$14K

Last updated: Jan 2026

Quality of care over time

These measures show how residents usually do over time at this home, based on health outcomes and preventive care.

High-risk clinical events score Info A composite score based on pressure ulcers, falls with injury, weight loss, walking ability decline, and activities of daily living decline. 8.4
13% worse than Florida average

Florida average: 7.4

Functional decline score Info A composite score based on activities of daily living decline, walking ability decline, and incontinence. 12.9
In line with Florida average

Florida average: 12.4

Long-stay resident measures
Need for Help with Daily Activities Increased Info Percent of long-stay residents whose need for help with daily activities has increased 14.6%
39% worse than Florida average

Florida average: 10.5%

Walking Ability Worsened Info Percent of long-stay residents whose ability to move independently worsened 12.9%
In line with Florida average

Florida average: 12.9%

Low Risk Residents with Bowel/Bladder Incontinence Info Percent of low risk long-stay residents who lose control of their bowels or bladder 11.1%
18% better than Florida average

Florida average: 13.5%

Falls with Major Injury Info Percent of long-stay residents experiencing one or more falls with major injury 3.1%
16% worse than Florida average

Florida average: 2.6%

High Risk Residents with Pressure Ulcers Info Percent of long-stay high risk residents with pressure ulcers 6.6%
24% worse than Florida average

Florida average: 5.4%

Urinary Tract Infection Info Percent of long-stay residents with a urinary tract infection 0.5%
39% better than Florida average

Florida average: 0.9%

Lost Too Much Weight Info Percent of long-stay residents who lose too much weight 4.8%
19% better than Florida average

Florida average: 6.0%

Depressive Symptoms Info Percent of long-stay residents who have depressive symptoms 6.6%
96% worse than Florida average

Florida average: 3.3%

Antipsychotic Use Info Percent of long-stay residents who received an antipsychotic medication 3.8%
53% better than Florida average

Florida average: 8.0%

Pneumococcal Vaccine Info Percent of long-stay residents assessed and appropriately given the pneumococcal vaccine 97.4%
In line with Florida average

Florida average: 97.7%

Influenza Vaccine Info Percent of long-stay residents assessed and appropriately given the seasonal influenza vaccine 100.0%
In line with Florida average

Florida average: 99.2%

Short-stay resident measures
Pneumococcal Vaccine Info Percent of short-stay residents assessed and appropriately given the pneumococcal vaccine 87.2%
7% worse than Florida average

Florida average: 94.0%

Antipsychotic medication increase Info Percent of short-stay residents who newly received an antipsychotic medication 1.1%
30% better than Florida average

Florida average: 1.5%

Influenza Vaccine Info Percent of short-stay residents assessed and appropriately given the seasonal influenza vaccine 97.2%
In line with Florida average

Florida average: 94.7%

Breakdown by payment type

Medicare

35% of new residents, usually for short-term rehab.

Typical stay 1 - 2 months

Private pay

29% of new residents, often for short stays.

Typical stay 1 months

Medicaid

36% of new residents, often for long-term daily care.

Typical stay 1 years

Facility Characteristics

Source: CMS Long-Term Care Facility Characteristics (Data as of Jan 2026)

Total residents 105
Medicare
7
6.7% of residents
Medicaid
87
82.9% of residents
Private pay or other
11
10.5% of residents
Programs & Services
Residents Group

Residents meet regularly to discuss policies, care quality, and activities

Active Resident Council

Organized group of residents that meets regularly to discuss facility policies, quality of life, and activities.

Finances and operations

Voluntary non-profit community
Home revenue
$13.6M
Operating deficit
-$511.5K
Voluntary non-profit community
Home revenue
$13.6M Rank #185 / 256Revenue — State benchmarkedThis home is ranked 185th out of 256 homes in Florida. Shows this facility's annual revenue compared to the Florida SNF average. Higher revenue generally means more resources for staffing and capital — read alongside Payroll %.Click the rank badge to see the full State ranking.Click here to see the full State ranking.
Operating deficit
-$511.5K
Payroll costs Info The portion of the home's budget spent on staff, including nurses, caregivers, and other employees who support care and operations. Rank #141 / 256Payroll — State benchmarkedThis home is ranked 141st out of 256 homes in Florida. Shows total annual staff payroll benchmarked to the Florida average. Higher payroll investment relative to peers often signals better staffing and less reliance on cheaper contract labor.Click the rank badge to see the full State ranking.Click here to see the full State ranking.
$7.6M
55.7% of revenue Rank #30 / 256Payroll % — State benchmarkedThis home is ranked 30th out of 256 homes in Florida. Shows payroll as a percentage of revenue versus the Florida average. Well-run Florida SNFs typically land around 49–56% — the top third Statewide. Below 25% may signal understaffing or heavy agency use — read with Staffing ratings.Click the rank badge to see the full State ranking.Click here to see the full State ranking.
Other operating costs Info All remaining costs needed to run the home, such as food, utilities, building maintenance, supplies and administrative expenses.
$6.5M
Total costs $14.1M

What does this home offer?

Minimum age icon
Minimum age icon

Minimum Age: 55 Years Old

Housing options icon

Housing Options: 1 Bed / 2 Bed

Building type icon
Building type icon

Building Type: Mid-rise

Social and recreational activities icon

Social and Recreational Activities

Exercise program icon

Exercise Programs

Swimming pool icon
Swimming pool icon

Swimming Pool

Who this home usually serves

TYPE OF STAY

Mostly long-term care residents

Most residents stay for extended periods and receive ongoing daily care.

Places of interest near Pine Berry Senior

Address 2.2 miles from city center Info Estimated distance in miles from Clearwater's city center to Pine Berry Senior's address, calculated via Google Maps.

Calculate Travel Distance to Pine Berry Senior

Add your location

Address

Financial Assistance for
Nursing Home in Florida

Pine Berry Senior is located in Clearwater, Florida.
Here are the financial assistance programs available to residents in Florida.

Get Financial aid guidance

Long-Term Care Waiver

Florida Medicaid LTC Waiver

Age 65+ or 21+ disabled
General Florida resident, Medicaid- eligible, nursing home-level care need.
Income Limits (2025) ~$2,829/month 300% FBR, individual
Asset Limits $2,000 (individual), $3,000 (couple).
FL

High demand; waitlists common.

Benefits
In-home care (6-8 hours/day) Assisted living Respite (240 hours/year) Case management

Community Care for the Elderly (CCE)

Florida CCE

Age 60+
General Florida resident, at risk of nursing home.
Income Limits ~$2,000/month varies
Asset Limits $5,000 individual
FL

Limited funding; regional variation.

Benefits
Homemaker services (3-5 hours/week) Adult day care (~$60/day) Respite (up to 10 days/year)

Home Care for the Elderly (HCE)

Florida Home Care for the Elderly

Age 60+
General Florida resident, at risk of nursing home placement; caregiver must be approved.
Income Limits (2025) ~$2,829/month individual, aligned with Medicaid thresholds
Asset Limits ~$2,000 (individual); varies by case manager discretion.
FL

Limited funding (~3,500 served annually); prioritizes low-income frail seniors.

Benefits
Basic subsidy (~$160/month) for housing/medical costs; special subsidies for supplies/services (e.g., incontinence supplies, ~$50-$200/month)

Program of All-Inclusive Care for the Elderly (PACE)

Florida Medicaid PACE

Age 55+
General Florida resident, nursing home-level care need, safe with PACE support.
Income Limits (2025) ~$2,829/month 300% FBR
Asset Limits $2,000 (individual), $3,000 (couple).
FL

Limited to specific counties (e.g., Hillsborough, Miami-Dade); ~10 sites statewide.

Benefits
Personal care (5-7 hours/day) Medical care Meals Transportation Therapy

Optional State Supplementation (OSS)

Florida Optional State Supplementation

Age 65+ or disabled
General Florida resident, living in approved facility, receiving SSI or low-income.
Income Limits (2025) ~$1,004/month individual, including SSI
Asset Limits $2,000 (individual), $3,000 (couple).
FL

Limited to specific facility types; ~$78.40/month max supplement.

Benefits
Cash payment (~$78.40/month) for room/board or personal needs in facilities

Frequently Asked Questions about Pine Berry Senior

Is Pine Berry Senior in a walkable area?

Pine Berry Senior has a walk score of 64. Moderately walkable. Some errands can be accomplished on foot, with a mix of nearby amenities.

What is the address of Pine Berry Senior?

Pine Berry Senior is located at 1225 S Highland Ave, Clearwater, FL 33756.

What is the phone number of Pine Berry Senior?

(727) 761-1187 will put you in contact with the team at Pine Berry Senior.

Is Pine Berry Senior Medicare or Medicaid certified?

Yes — Pine Berry Senior is a CMS-certified provider of Medicare and Medicaid.

Guides for Better Senior Living

Care Cost Calculator: See Prices in Your Area

Nursing Home Data Explorer

Don’t Wait Too Long: 7 Red Flag Signs Your Parent Needs Assisted Living Now

The True Cost of Assisted Living in 2025 – And How Families Are Paying For It

Understanding Senior Living Costs: Pricing Models, Discounts & Financial Assistance

Explore Open Rooms
1 Contact details
2 What type of senior care service are you looking for?
3 What budget do you have in mind for senior care?
4 How soon do you need to find care?
5 Additional details

Thank you for your interest!

Our team will be in touch shortly to help with next steps.